

Could a rabies incursion spread in the northern Australian dingo population? Development of a spatial stochastic simulation model
- PMID: 33577573
- PMCID: PMC7906478
- DOI: 10.1371/journal.pntd.0009124
Could a rabies incursion spread in the northern Australian dingo population? Development of a spatial stochastic simulation model
Abstract
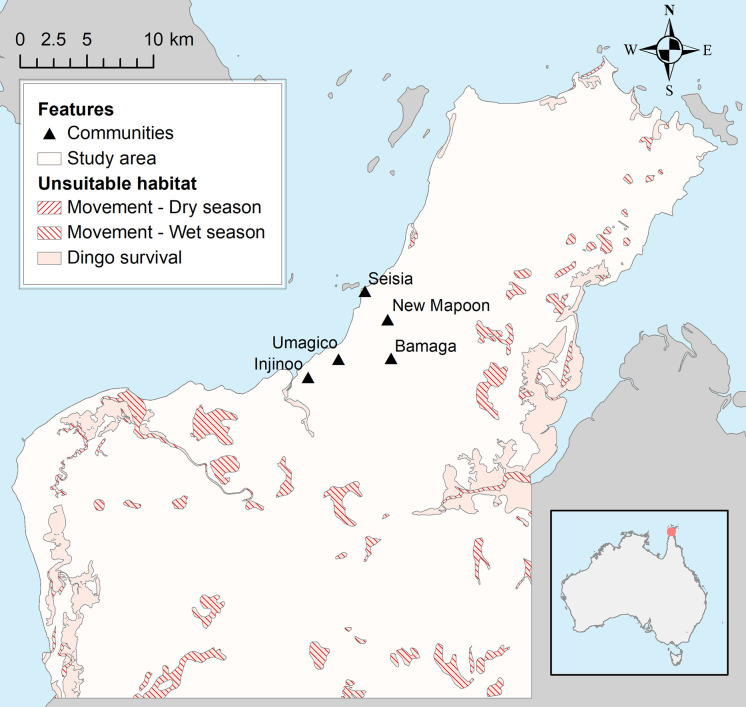
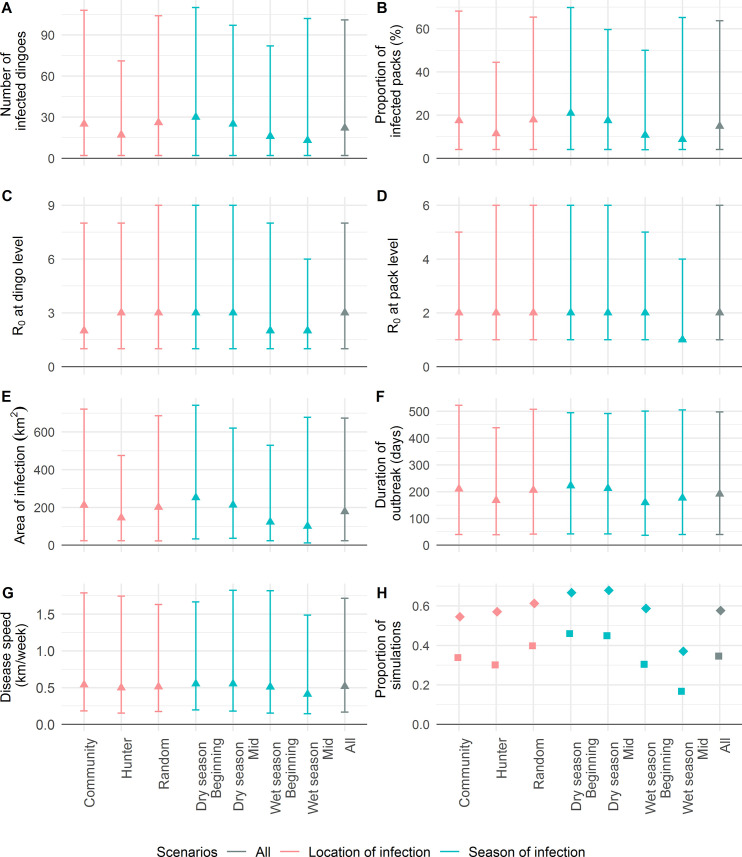
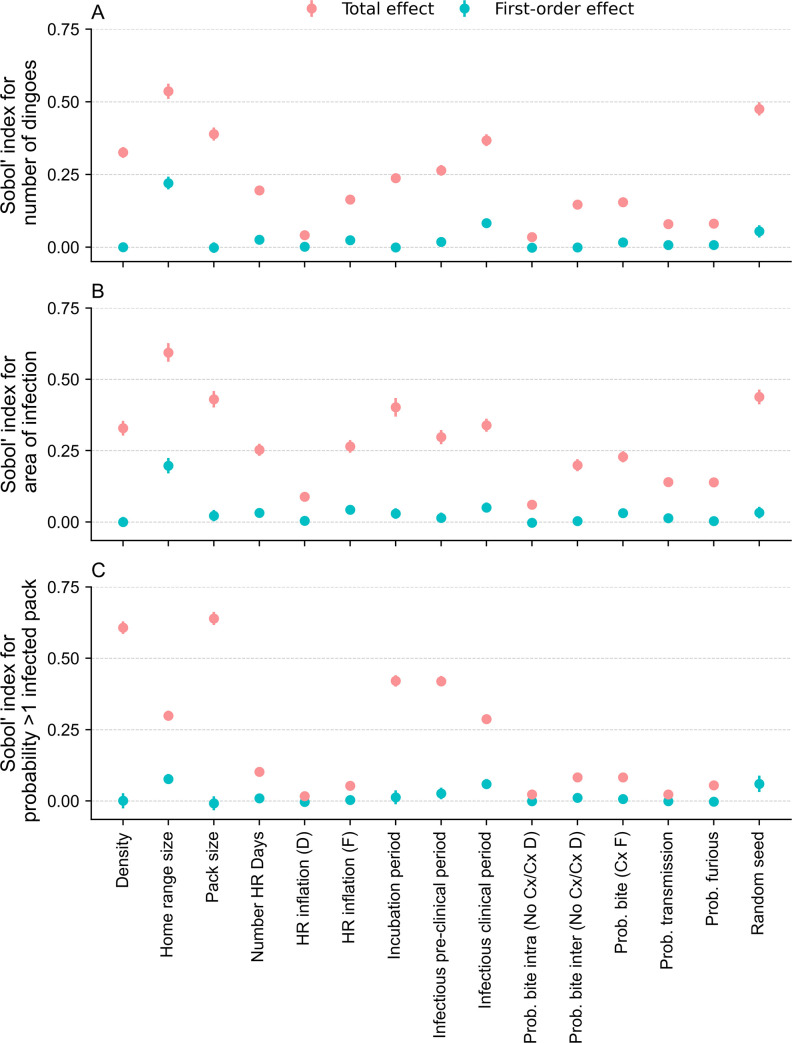
Australia, home to the iconic dingo, is currently free from canine rabies. However northern Australia, including Indigenous communities with large free-roaming domestic dog populations, is at increased risk of rabies incursion from nearby Indonesia. We developed a novel agent-based stochastic spatial rabies spread model to evaluate the potential spread of rabies within the dingo population of the Northern Peninsula Area (NPA) region of northern Australia. The model incorporated spatio-temporal features specific to this host-environment system, including landscape heterogeneity, demographic fluctuations, dispersal movements and dingo ecological parameters-such as home range size and density-derived from NPA field studies. Rabies spread between dingo packs in nearly 60% of simulations. In such situations rabies would affect a median of 22 dingoes (approximately 14% of the population; 2.5-97.5 percentiles: 2-101 dingoes) within the study area which covered 1,131 km2, and spread 0.52 km/week for 191 days. Larger outbreaks occurred in scenarios in which an incursion was introduced during the dry season (vs. wet season), and close to communities (vs. areas with high risk of interaction between dingoes and hunting community dogs). Sensitivity analyses revealed that home range size and duration of infectious clinical period contributed most to the variance of outputs. Although conditions in the NPA would most likely not support a sustained propagation of the disease in the dingo population, due to the predicted number of infected dingoes following a rabies incursion and the proximity of Indigenous communities to dingo habitat, we conclude that the risk for human transmission could be substantial.
Conflict of interest statement
The authors have declared that no competing interests exist.
Figures
Similar articles
-
Dingo Density Estimates and Movements in Equatorial Australia: Spatially Explicit Mark-Resight Models.Animals (Basel). 2020 May 17;10(5):865. doi: 10.3390/ani10050865. Animals (Basel). 2020. PMID: 32429520 Free PMC article.
-
Rabies disease dynamics in naïve dog populations in Australia.Prev Vet Med. 2016 Sep 1;131:127-136. doi: 10.1016/j.prevetmed.2016.07.015. Epub 2016 Jul 25. Prev Vet Med. 2016. PMID: 27544262
-
Investigation of the temporal roaming behaviour of free-roaming domestic dogs in Indigenous communities in northern Australia to inform rabies incursion preparedness.Sci Rep. 2019 Oct 17;9(1):14893. doi: 10.1038/s41598-019-51447-8. Sci Rep. 2019. PMID: 31624301 Free PMC article.
-
Canine rabies in Australia: a review of preparedness and research needs.Zoonoses Public Health. 2015 Jun;62(4):237-53. doi: 10.1111/zph.12142. Epub 2014 Jun 16. Zoonoses Public Health. 2015. PMID: 24934203 Review.
-
A Scoping Review of Dingo and Wild-Living Dog Ecology and Biology in Australia to Inform Parameterisation for Disease Spread Modelling.Front Vet Sci. 2019 Mar 5;6:47. doi: 10.3389/fvets.2019.00047. eCollection 2019. Front Vet Sci. 2019. PMID: 30891452 Free PMC article.
Cited by
-
Rabies in the Tropics.Curr Trop Med Rep. 2022;9(1):28-39. doi: 10.1007/s40475-022-00257-6. Epub 2022 Mar 28. Curr Trop Med Rep. 2022. PMID: 35371908 Free PMC article. Review.
-
Rabies in Our Neighbourhood: Preparedness for an Emerging Infectious Disease.Pathogens. 2021 Mar 20;10(3):375. doi: 10.3390/pathogens10030375. Pathogens. 2021. PMID: 33804778 Free PMC article. Review.
References
-
- World Health Organization. WHO Expert consultation on rabies. Second report. World Health Organization technical report series; 2013. Report No.: 982. - PubMed
Publication types
MeSH terms
LinkOut - more resources
Full Text Sources
Other Literature Sources
Medical
