. 2021 Mar 9;54(3):557-570.e5.
doi: 10.1016/j.immuni.2021.01.017. Epub 2021 Jan 29.

Leveraging the antiviral type I interferon system as a first line of defense against SARS-CoV-2 pathogenicity

Affiliations

Leveraging the antiviral type I interferon system as a first line of defense against SARS-CoV-2 pathogenicity

Daisy A Hoagland et al. Immunity. .

Abstract

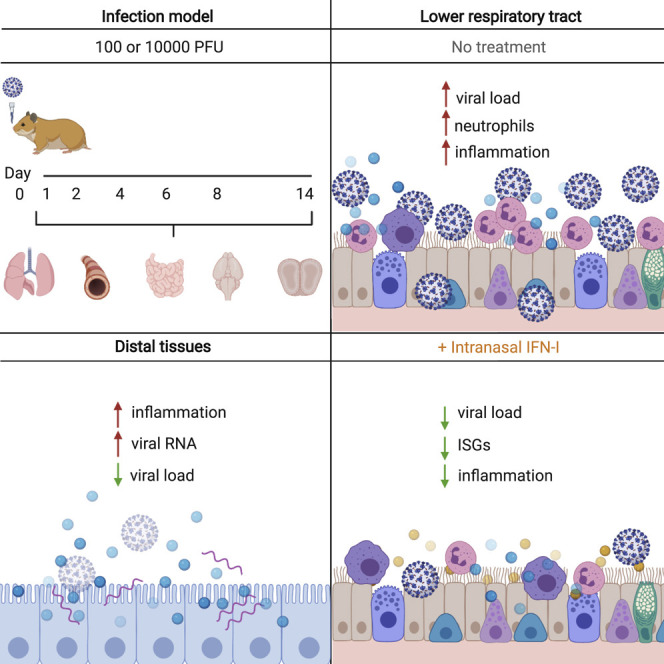
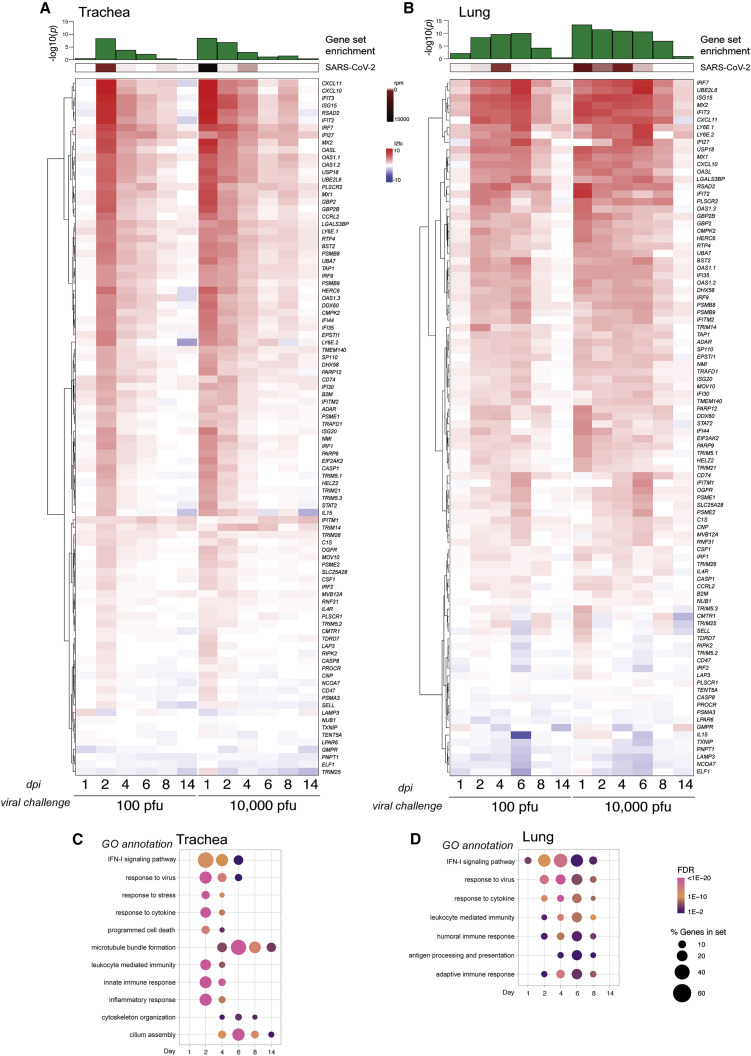
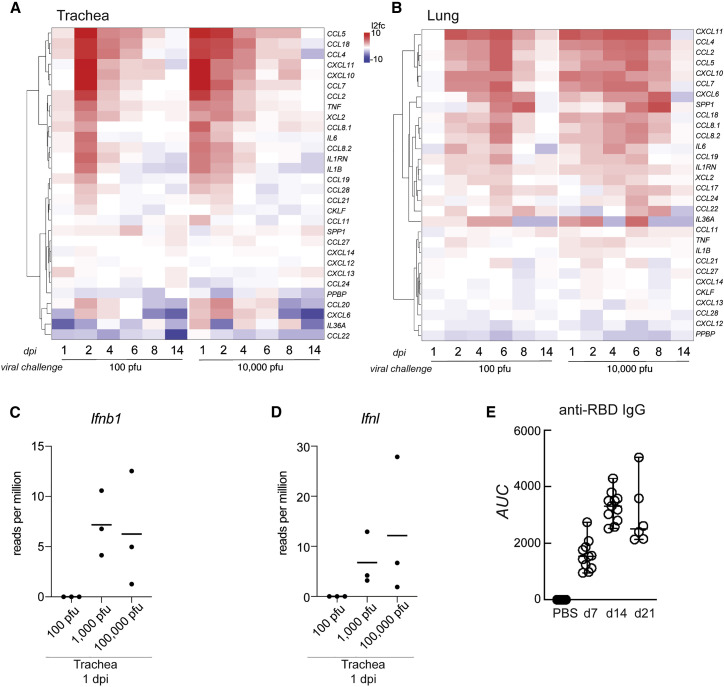
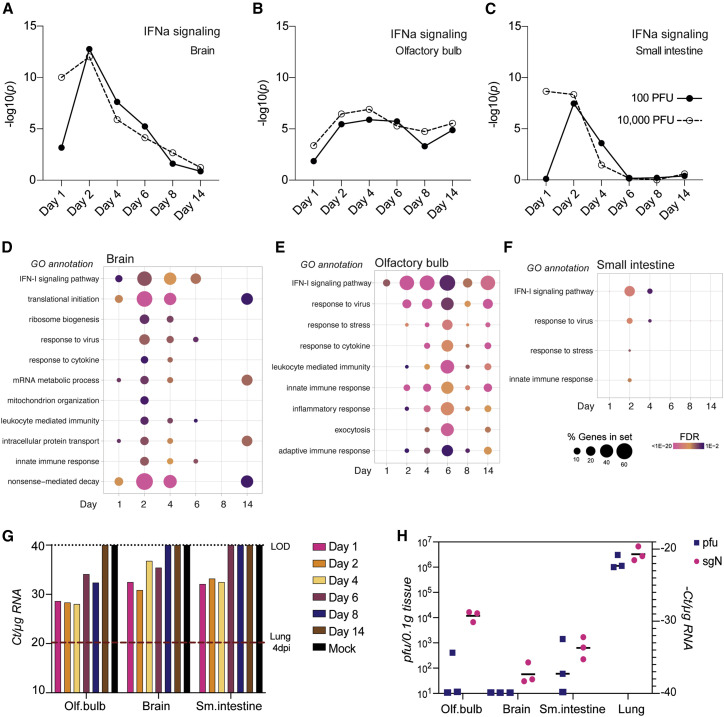
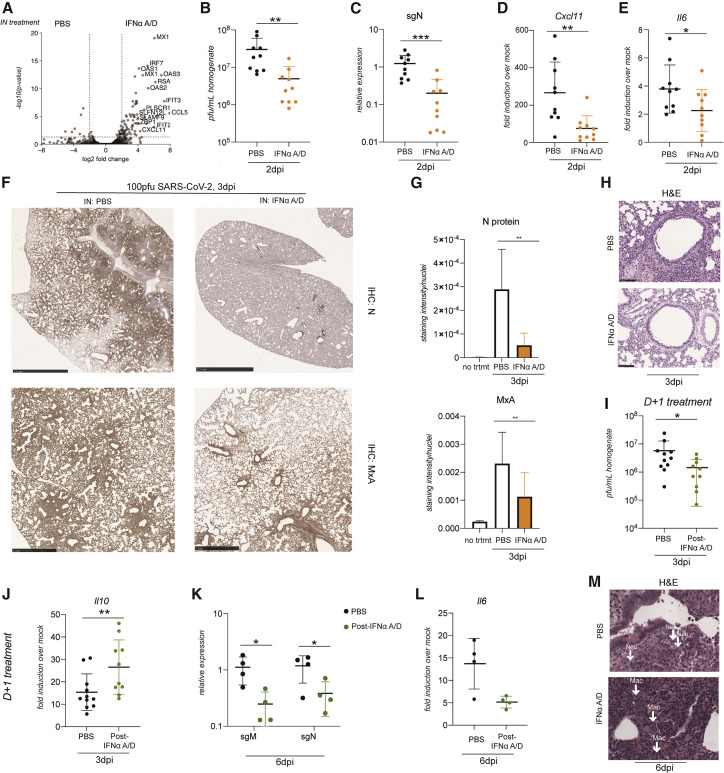
The emergence and spread of severe acute respiratory syndrome coronavirus 2 (SARS-CoV-2) has resulted in significant global morbidity, mortality, and societal disruption. A better understanding of virus-host interactions may potentiate therapeutic insights toward limiting this infection. Here we investigated the dynamics of the systemic response to SARS-CoV-2 in hamsters by histological analysis and transcriptional profiling. Infection resulted in consistently high levels of virus in the upper and lower respiratory tracts and sporadic occurrence in other distal tissues. A longitudinal cohort revealed a wave of inflammation, including a type I interferon (IFN-I) response, that was evident in all tissues regardless of viral presence but was insufficient to prevent disease progression. Bolstering the antiviral response with intranasal administration of recombinant IFN-I reduced viral disease, prevented transmission, and lowered inflammation in vivo. This study defines the systemic host response to SARS-CoV-2 infection and supports use of intranasal IFN-I as an effective means of early treatment.

Keywords: COVID-19; IFN-I; cytokine; hamster; intranasal; mRNA-seq; pandemic; prophylactic; therapeutic; transcriptomics.


Conflict of interest statement

Declaration of interests The authors declare no competing interests.

Figures

None
Graphical abstract
Figure 1
Figure 1
The transcriptional signatures from SARS-CoV-2- and IAV-infected hamster lungs differ (A) Principal-component analysis of mRNA-seq samples derived from total lungs of hamsters (n = 4/cohort) treated with IN PBS, IAV (A/Cal/04/2009), or SARS-CoV-2 (USA-WA1/2020), collected 5 days after treatment, and aligned to virus and hamster reference genomes. (B) Reads per million of SARS-CoV-2 and IAV from (A) relative to host mRNA. Error bars indicate standard error of the mean. (C) Volcano plot comparing DEGs following SARS-CoV-2 versus IAV infection as described in (A) (gray, not significant; blue, significant; red, significant and log2 fold change > 2). Genes are called by their human ortholog. See also Table S1.
Figure 2
Figure 2
SARS-CoV-2 infects the respiratory tract and activates the innate immune response in hamsters (A) Tested modes of transmission: fomite transmission using dirty nesting from a cage of an infected hamster, direct contact with an infected individual hamster, and direct inoculation ocularly or IN. (B and C) Nucleoprotein subgenomic RNA (sgRNA) (sgN) and (C) Isg15 real-time qRT-PCR of RNA extracted from hamster lungs after exposure to virus via fomites in dirty cages, direct contact with an infected hamster, eye drops (60,000 PFUs), or IN droplets (1,000 PFUs) of SARS-CoV-2, shown as fold change of transcript abundance compared with uninfected controls (n = 4; fomite transmission, n = 3). (D and E) sgN and (E) Isg15 real-time qRT-PCR of RNA extracted from hamster lungs 2 days after infection with 10, 100, 1,000, 10,000, or 100,000 PFUs of SARS-CoV-2, shown as fold change of transcript abundance compared with uninfected controls (n = 4 for 10 and 1,000 PFUs, n = 6 for 100 PFUs, and n = 3 for 10,000 and 100,000 PFUs). (F) Virus load determined by plaque assay from lung homogenates derived from lung tissue from golden hamsters infected IN with 1,000 PFUs collected 4 days after infection and homogenized in PBS (n = 12). (G and H) sgN and (H) Isg15 real-time qRT-PCR of RNA extracted from pelleted lung homogenate from (F), shown as fold change of transcript abundance compared with uninfected controls. Data are represented as mean, and the error bars indicate standard deviation. See also Figure S2.
Figure 3
Figure 3
SARS-CoV-2 infection results in severe lower respiratory tract pathology (A and B) Representative images of golden hamster lung tissue collected 2, 4, 6, 8, and 14 days after infection (100 PFUs) and immunohistochemistry with (A) N-specific antibody and (B) H&E (scale bar, 50 μm, n = 3). (C and D) Average values of histopathological scores, assessed by a certified pathologist for each of the observations, corresponding to the time points in (A) and (B) (n = 3). Error bars indicate standard deviation. (E) Cumulative clinical scores for nine different histopathological assessments (Table S2). Each point represents the score for one animal. (F and G) Representative images of (F) apoptosis in the bronchial epithelium (400× magnification), (G) accumulation of neutrophils (200× magnification), and (H) severe vascular edema (100× magnification) in hamster lungs collected 3 days after SARS-CoV-2 infection (100 PFU). See also Figure S3 and Table S2.
Figure 4
Figure 4
The upper and lower respiratory tract IFN-I transcriptional signatures (A and B) Differential gene expression of a curated list of ISGs calculated from bulk mRNA-seq from (A) tracheae and (B) lungs of hamsters infected with SARS-CoV-2 for the times and inocula indicated compared with uninfected controls. The heatmaps represent the log2 fold change of each gene indicated on the right (human ortholog) at the time points below. Averages of reads per million (rpm) mapping to the SARS-CoV-2 genome in both tissues throughout the time course are shown above each heatmap (in brown), and the statistical significance of the enrichment of the gene list in the total number of DEGs (in green) is shown as −log10(adjusted p value) (control group, n = 5; each experimental group, n = 3). (C and D) Gene enrichment analysis of all DEGs (log2 fold change > 1, false discovery rate [FDR] < 0.05) increased during infection for (C) the trachea and (D) the lungs, as depicted for the time course of infection with 100 PFU. Each dot indicates a statistically significant representation of the category of genes listed on the left at each time point. The size of the dot indicates the percentage of enriched genes from each GO annotation set, and the color represents its FDR. See also Figure S4.
Figure 5
Figure 5
The chemokine expression profile of the upper and lower respiratory tract in infected golden hamsters (A and B) Differential gene expression of a curated list of chemokines and cytokines calculated from bulk mRNA-seq from (A) the trachea and (B) the lungs of hamsters infected with SARS-CoV-2 for the times and dosages indicated compared with uninfected controls. The heatmaps represent the log2 fold change of each gene indicated on the right (human ortholog) at the time points below (control group, n = 5; each experimental group, n = 3). (C and D) Mean number of rpm from RNA-seq mapping to (C) Ifnb or (D) Ifnl in the trachea 1 day after infection (n = 3). (E) Mean IgG antibody titers specific to the spike protein in 9- to 10-week-old hamsters and controls (n = 8) 7 (n = 11), 14 (n = 11), and 21 (n = 6) days after infection, measured by ELISA and depicted as area under the curve (AUC). Error bars indicate standard deviation. See also Figure S5.
Figure 6
Figure 6
Sites distal to direct SARS-CoV-2 replication display significant inflammation (A–C) The statistical significance of the enrichment of a curated list of ISGs among the total number of DEGs is shown as –log10(adjusted p value) above each time point from transcriptome analysis of total RNA extracted from (A) the brain, (B) the olfactory bulb, or (C) the small intestine (all groups n = 3; small intestine 10,000 PFUs day 8, n = 2). (D and E) Gene enrichment analysis of all DEGs (log2 fold change > 1, FDR < 0.05) that increased during infection in (D) the brain, (E) the olfactory bulb, and (F) the small intestine are depicted for the time course of infection with 100 PFU. Each dot indicates a statistically significant representation of the category of genes listed on the left at each time point. The size of the dot indicates the percentage of enriched genes from each GO annotation set, and the color represents its FDR (n = 3). (G) sgN levels represented by real-time qRT-PCR Ct score per 1 μg RNA from the olfactory bulb, brain, and small intestine at the indicated time points after infection with 100 PFUs SARS-CoV-2. RNA samples of each organ and corresponding time point were pooled before analysis (n = 3 per condition). The red dotted line indicates the Ct value of a sample corresponding to lungs collected from a hamster 4 days after infection. (H) sgN levels represented by real-time qRT-PCR (−)Ct score per 1 μg RNA and PFUs per 100 mg of analyzed tissue homogenate (n = 3 per condition). Horizontal bars indicate mean.
Figure 7
Figure 7
IFN administration reduces the viral load and lung pathology in hamsters (A) Volcano plot showing DEGs from transcriptome analysis of RNA extracted from lungs of golden hamsters treated with 200,000 units of IN IFNα A/D for 8 h compared with mock treatment. Each dot represents a gene plotted by its log2 fold change on the x axis and the statistical significance on the y axis as −log10(p value) (n = 3 per condition). All genes with a log2 fold change of more than 4 and p value of less than 0.05 are labeled with the name of the human ortholog. (B) Plaque assay of lung homogenate from golden hamster lungs infected with 100 PFUs of SARS-CoV-2 harvested 2 days after infection after daily IN treatment with PBS or 200,000 units of IFNα A/D starting 24 h prior to infection. n = 10 per condition from two independent experiments, p = 0.007. (C) sgN relative expression levels by real-time qRT-PCR from lungs of hamsters infected with 100 PFUs of SARS-CoV-2 and treated IN starting 24 h before infection with PBS or IFNα A/D and collected 3 days after infection. n = 10 per condition from two independent experiments, p = 0.0007. (D) Real-time qRT-PCR for fold induction of Cxcl11 mRNA from corresponding hamster lungs compared with mock-infected hamster lungs (n = 3). n = 10 from two independent experiments, p = 0.0039. (E) Real-time qRT-PCR for fold induction of Il6 mRNA from corresponding hamster lungs compared with mock-infected hamster lungs (n = 3). n = 10 per condition from two independent experiments, p = 0.0476. (F) Representative images of immunohistochemistry staining with N-specific antibody and MxA in lungs 3 days after infection with IN PBS or IFNα A/D, administered beginning 24 h before infection. N-protein scale bar, 2.5 mm; MxA scale bar, 1 mm. (G) Protein expression quantification using ColorDeconvolution2 in ImageJ (see STAR methods for details) For N protein, n = 8 total representative images from 2 animals per treatment group, p = 0.0011; for MxA, n = 12 total representative images from 3 animals per treatment group, p = 0.0081. (H) Representative images of H&E stains from perfused hamster lungs harvested 3 days after infection with 100 PFUs of SARS-CoV-2 and daily IN treatment with PBS or 200,000 units of IFNα A/D. Scale bar, 100 μm. The IFNα A/D representative image is of a lung in which corresponding sgN levels were lowered a log compared with PBS- and SARS-CoV-2-infected controls. (I and J) Plaque assay and (J) real-time qRT-PCR for Il10 of lung homogenates from golden hamsters infected with 100 PFUs of SARS-CoV-2 and treated IN starting 24 h after infection with PBS or IFNα A/D and collected 3 days after infection. n = 10 per treatment group from 2 independent experiments. p = 0.0186 (I) and p = 0.0213 (J). (K) Real-time qRT-PCR for sgM and sgN from lungs of hamsters infected with SARS-CoV-2, subsequently treated daily with IN PBS or IFNα A/D, and harvested 6 days after infection, n = 4 per treatment group; sgM, p = 0.0137; sgN, p = 0.0237. (L) Real-time qRT-PCR for Il6 from lungs of hamsters infected with SARS-CoV-2, subsequently treated daily with IN PBS or IFNα A/D, and harvested 6 days after infection, represented as fold induction over baseline expression in mock-infected golden hamsters; n = 4 per treatment group. (M) Representative images of H&E stains of infiltrates from lungs of hamsters infected with SARS-CoV-2, subsequently treated daily with IN PBS or IFNα A/D, and harvested 6 days after infection; 400× magnification. “Neu” and “Mac” indicate a neutrophil or macrophage, respectively. Data are represented as mean ± standard deviation. See STAR methods for statistical tests utilized.

References

    1. Amanat F., Stadlbauer D., Strohmeier S., Nguyen T.H.O., Chromikova V., McMahon M., Jiang K., Arunkumar G.A., Jurczyszak D., Polanco J., et al. A serological assay to detect SARS-CoV-2 seroconversion in humans. Nat. Med. 2020;26:1033–1036. - PMC - PubMed
    1. Barrangou R., Fremaux C., Deveau H., Richards M., Boyaval P., Moineau S., Romero D.A., Horvath P. CRISPR provides acquired resistance against viruses in prokaryotes. Science. 2007;315:1709–1712. - PubMed
    1. Bastard P., Rosen L.B., Zhang Q., Michailidis E., Hoffmann H.H., Zhang Y., Dorgham K., Philippot Q., Rosain J., Béziat V., et al. HGID Lab. NIAID-USUHS Immune Response to COVID Group. COVID Clinicians. COVID-STORM Clinicians. Imagine COVID Group. French COVID Cohort Study Group. Milieu Intérieur Consortium. CoV-Contact Cohort. Amsterdam UMC Covid-19 Biobank. COVID Human Genetic Effort Autoantibodies against type I IFNs in patients with life-threatening COVID-19. Science. 2020;370:eabd4585. - PMC - PubMed
    1. Blanco-Melo D., Nilsson-Payant B.E., Liu W.C., Uhl S., Hoagland D., Møller R., Jordan T.X., Oishi K., Panis M., Sachs D., et al. Imbalanced Host Response to SARS-CoV-2 Drives Development of COVID-19. Cell. 2020;181:1036–1045.e9. - PMC - PubMed
    1. Boudewijns R., Thibaut H.J., Kaptein S.J.F., Li R., Vergote V., Seldeslachts L., Van Weyenbergh J., De Keyzer C., Bervoets L., Sharma S., et al. STAT2 signaling restricts viral dissemination but drives severe pneumonia in SARS-CoV-2 infected hamsters. Nat. Commun. 2020;11:5838. - PMC - PubMed

Publication types

MeSH terms