. 2021 Mar 4;184(5):1188-1200.e19.
doi: 10.1016/j.cell.2021.01.035. Epub 2021 Jan 26.

Two-component spike nanoparticle vaccine protects macaques from SARS-CoV-2 infection

Affiliations

Two-component spike nanoparticle vaccine protects macaques from SARS-CoV-2 infection

Philip J M Brouwer et al. Cell. .

Abstract

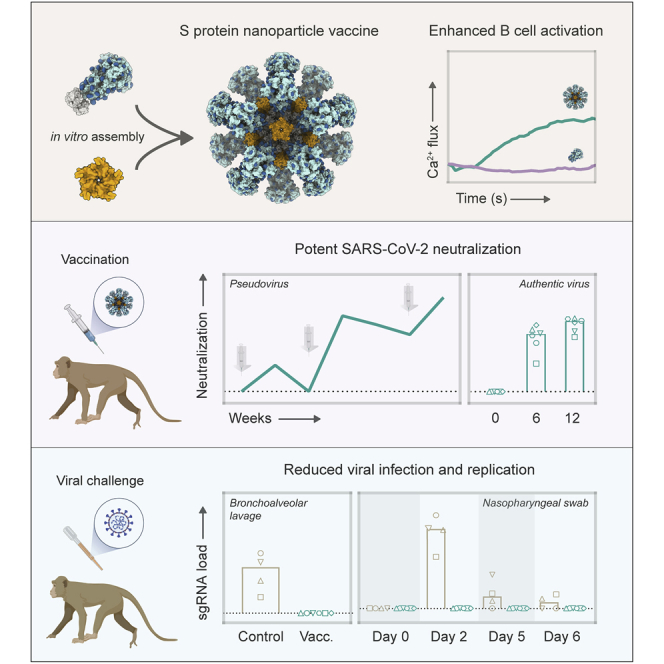
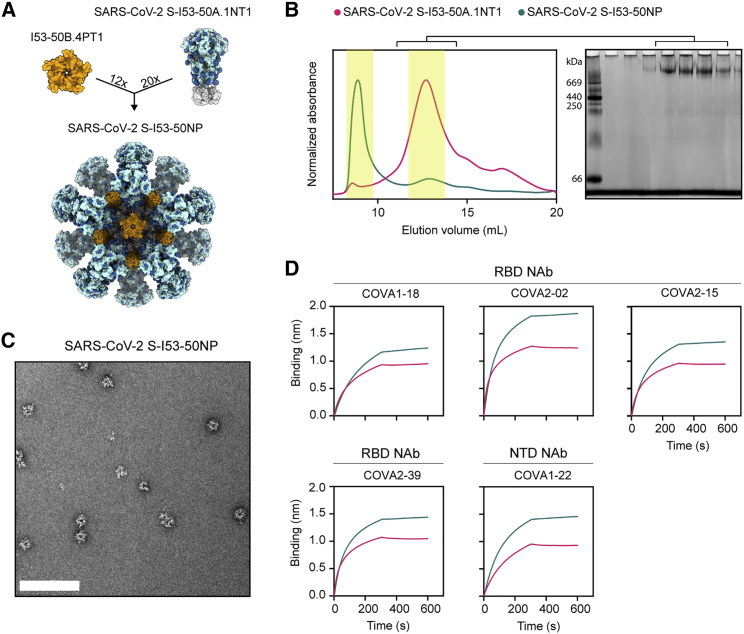
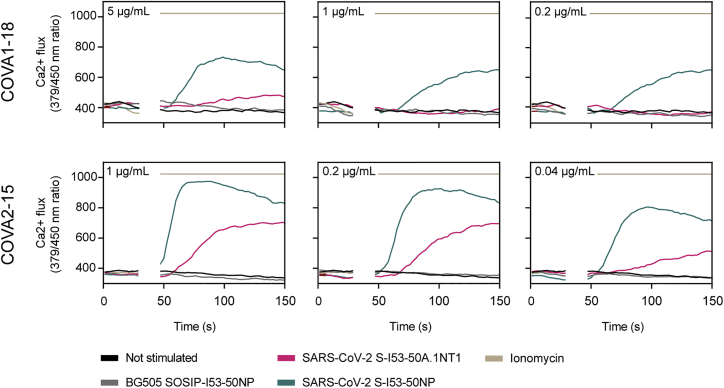
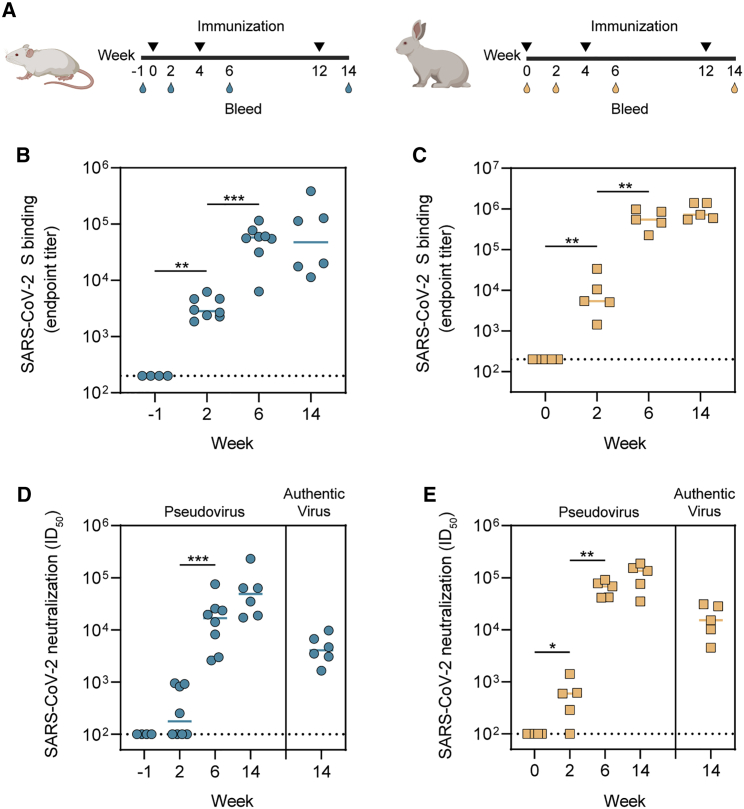
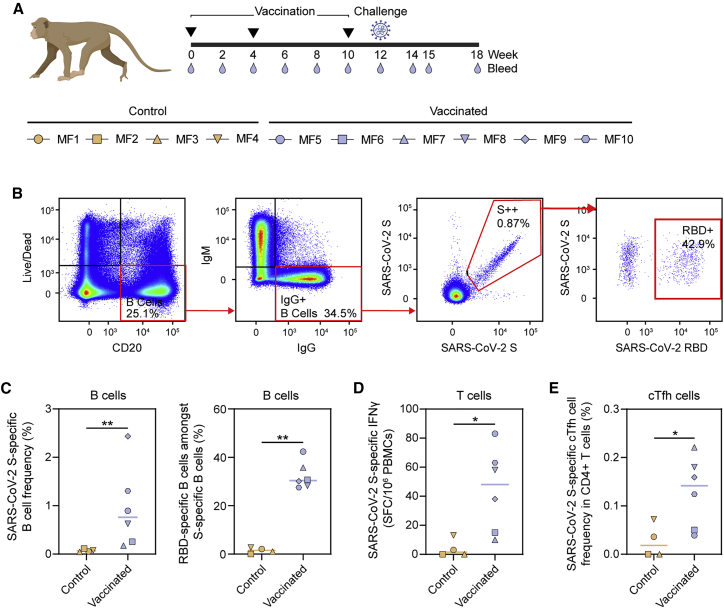
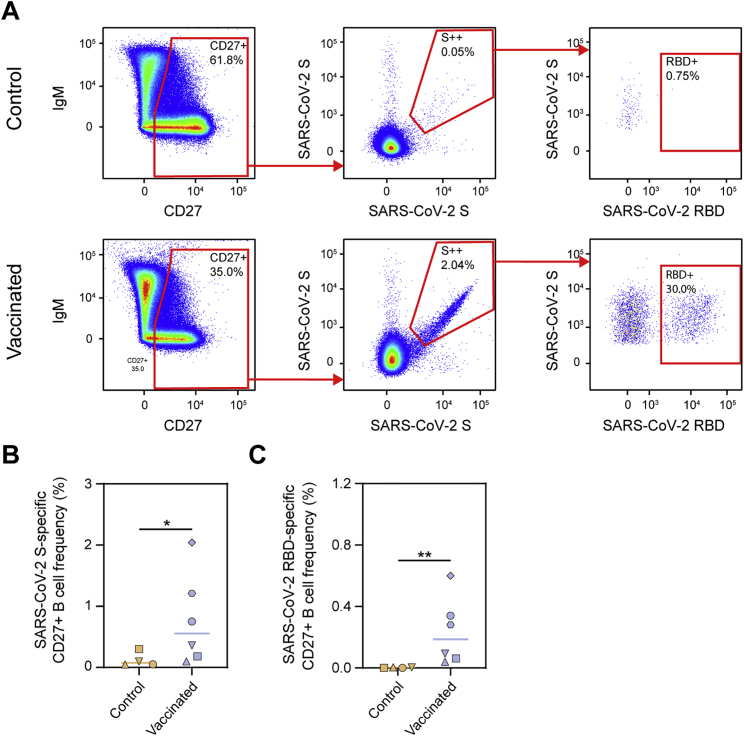
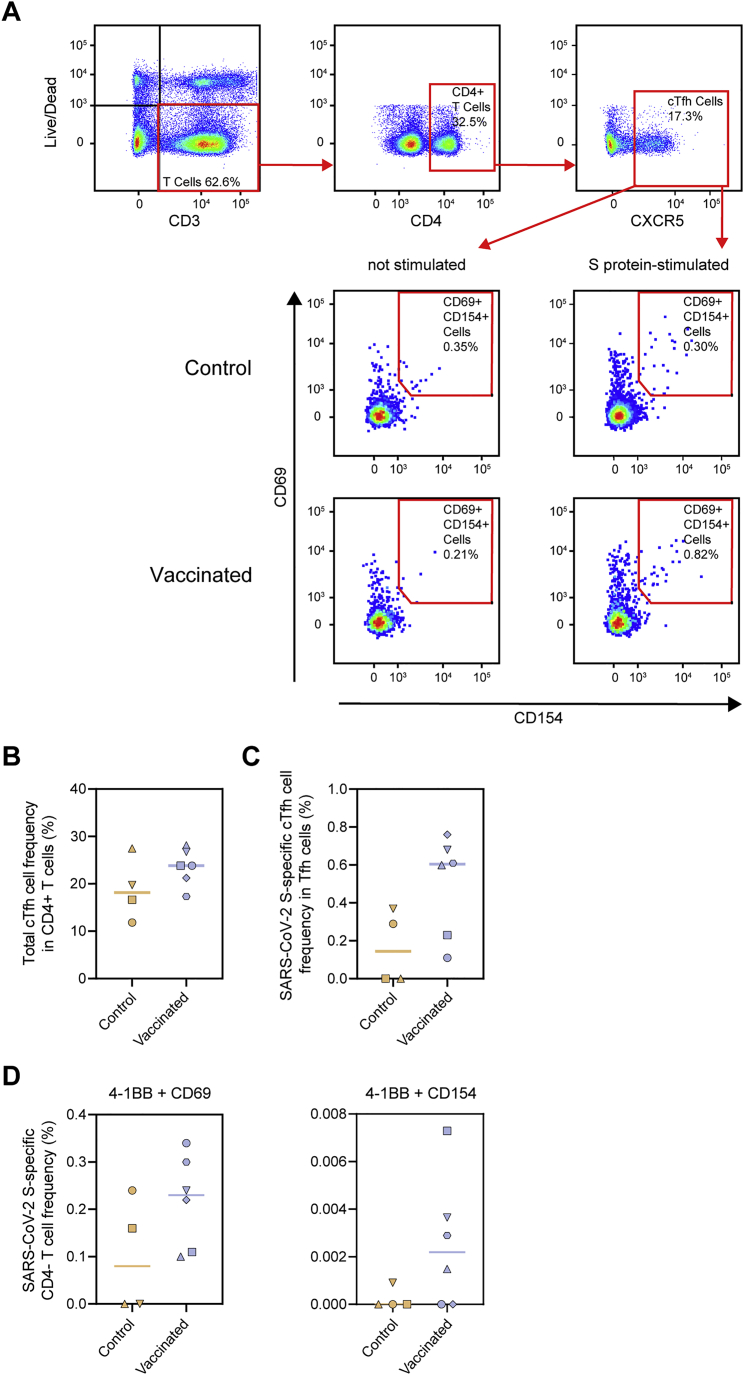
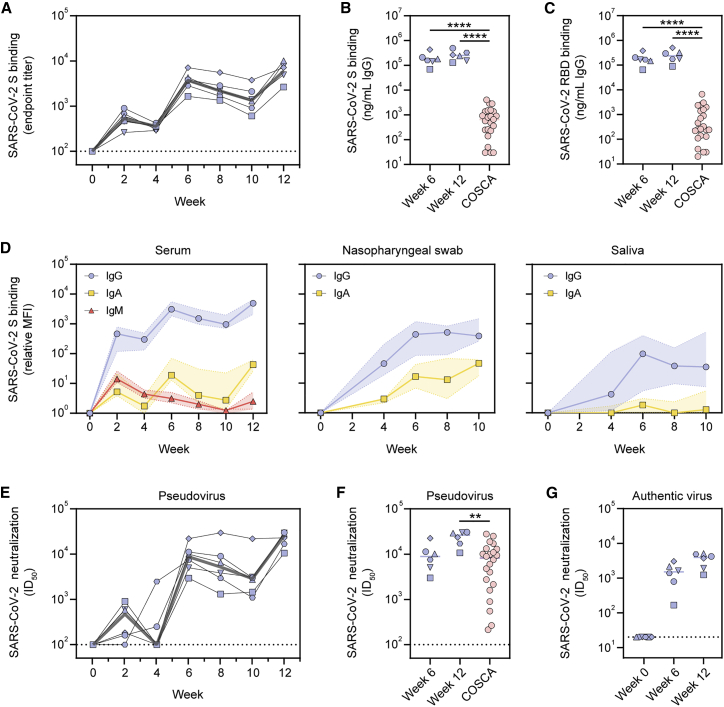
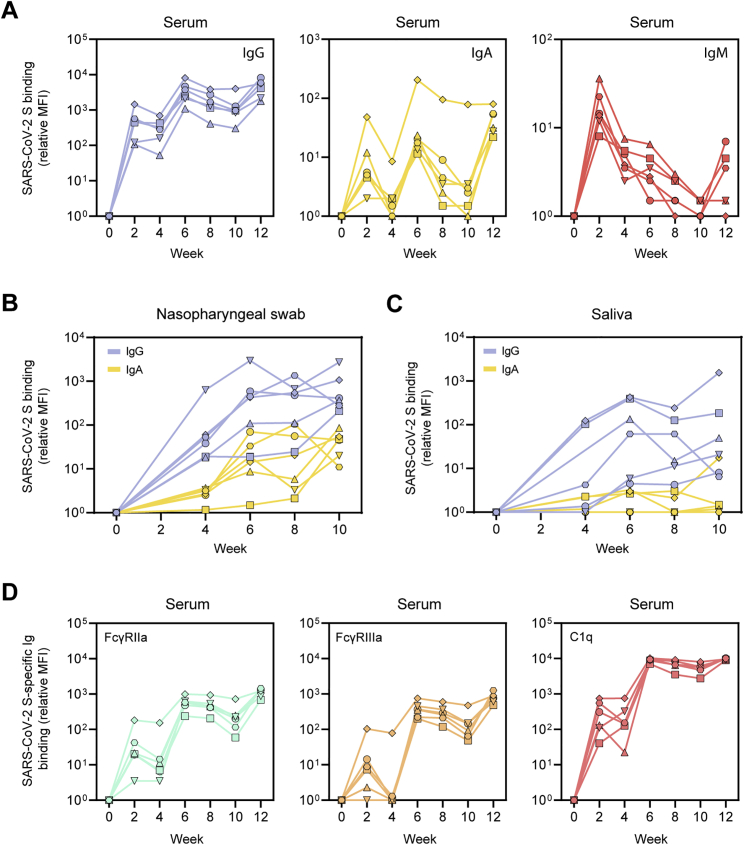
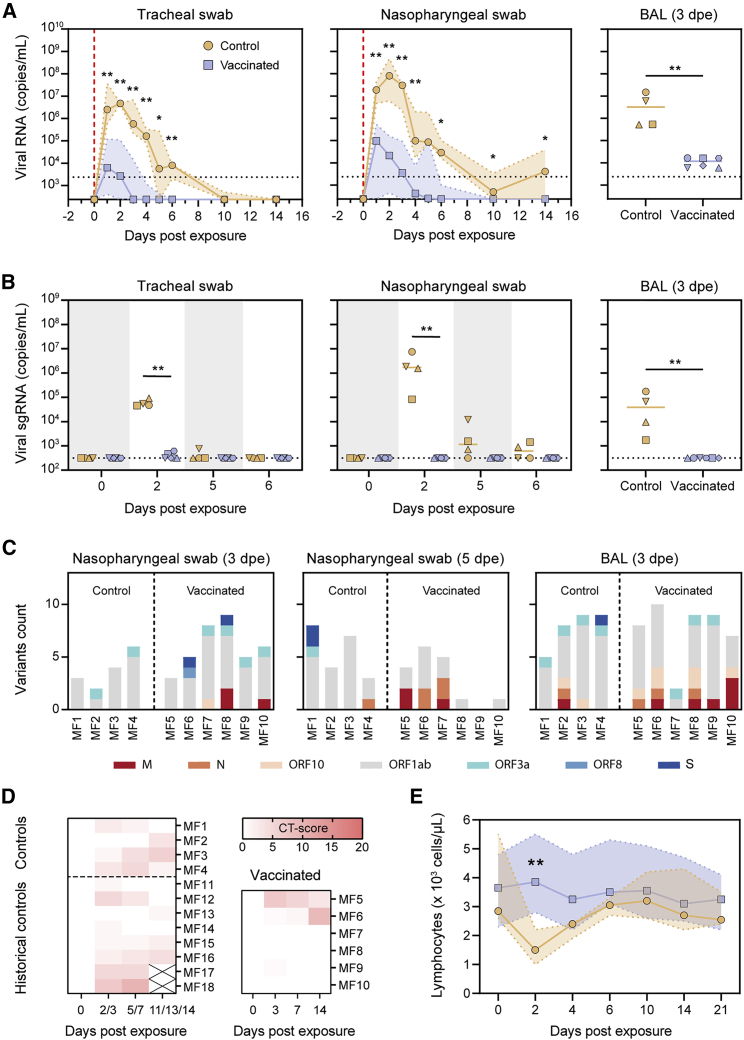
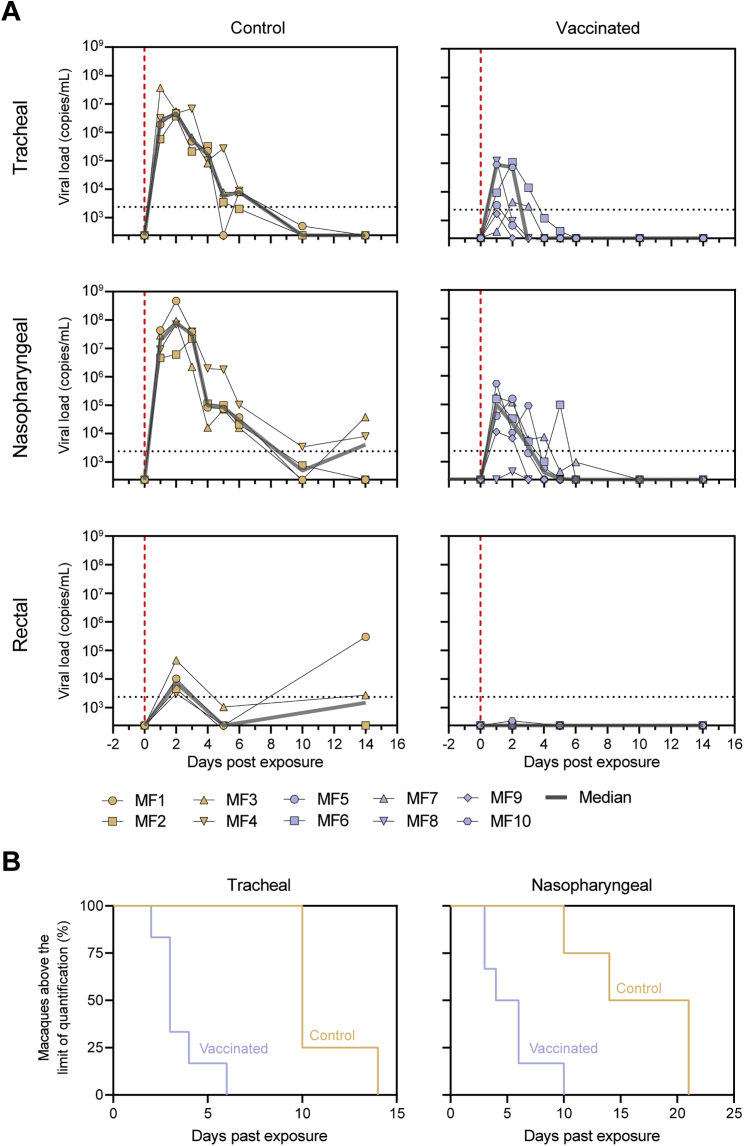
The severe acute respiratory syndrome coronavirus 2 (SARS-CoV-2) pandemic is continuing to disrupt personal lives, global healthcare systems, and economies. Hence, there is an urgent need for a vaccine that prevents viral infection, transmission, and disease. Here, we present a two-component protein-based nanoparticle vaccine that displays multiple copies of the SARS-CoV-2 spike protein. Immunization studies show that this vaccine induces potent neutralizing antibody responses in mice, rabbits, and cynomolgus macaques. The vaccine-induced immunity protects macaques against a high-dose challenge, resulting in strongly reduced viral infection and replication in the upper and lower airways. These nanoparticles are a promising vaccine candidate to curtail the SARS-CoV-2 pandemic.

Keywords: B cells; COVID-19; SARS-CoV-2; antibodies; immunity; macaques; nanoparticles; protection; vaccine.


Conflict of interest statement

Declaration of interests N.P.K. is a co-founder, shareholder, and chair of the scientific advisory board of Icosavax. The remaining authors declare no competing interests. Amsterdam UMC has filed a patent application concerning the SARS-CoV-2 mAbs used here (Brouwer et al., 2020). N.P.K. has a nonprovisional US patent (no. 14/930,792) related to I53-50 (Bale et al., 2016).

Figures

None
Graphical abstract
Figure 1
Figure 1
Biophysical and antigenic characterization of SARS-CoV-2 S-I53-50NPs (A) Schematic representation of 20 copies of SARS-CoV-2 S-I53-50A.1NT1 (SARS-CoV-2 S in light blue, glycans in dark blue, and I53-50A.1NT1 in white) and 12 copies of I53-50B.4PT1 assembling into SARS-CoV-2 S-I53-50NP. (B) Size exclusion chromatograms of SARS-CoV-2 S-I53-50A.1NT1 (magenta) and SARS-CoV-2 S-I53-50NP (green) run over a Superose 6 increase 10/300 GL column. The yellow columns specify the SEC fractions that were collected, pooled, and used. Blue native gel of pooled SARS-CoV-2 S-I53-50A.1NT1 SEC fractions. (C) Negative-stain electron microscopy (nsEM) analysis of assembled SARS-CoV-2 S-I53-50NPs. The white bar represents 200 nm. (D) BLI sensorgrams showing the binding of multiple SARS-CoV-2 NAbs to SARS-CoV-2 S-I53-50A.1NT1 (magenta) and SARS-CoV-2 S-I53-50NP (green). See also Figure S1.
Figure S1
Figure S1
Site-specific glycan analysis of SARS-CoV-2 S I53-50NPs, related to Figure 1 (A) The table categorizes the glycan compositions into oligomannose-, hybrid-, and complex-type as well as the percentage of glycan species containing at least one fucose or one sialic acid residue. The overall averages are shown in the right-hand table. (B) Site-specific distribution of N-linked glycans. The graphs summarize quantitative mass spectrometric analysis of the glycan population present at individual N-linked glycosylation sites simplified into categories of glycans. The oligomannose-type glycan series (M9 to M5; Man9GlcNAc2 to Man5GlcNAc2) is colored green, afucosylated and fucosylated hybrid-type glycans (Hybrid & F Hybrid) dashed pink, and complex glycans grouped according to the number of antennae and presence of core fucosylation (HexNAc(3)(X) to HexNAc(6+)(F)(X)) and are colored pink. Unoccupancy of an N-linked glycan site is represented in gray. The pie charts summarize the quantification of these glycans. Glycan sites are colored according to oligomannose-type glycan content with the glycan sites labeled in green (80%−100% oligomannose), orange (30%−79% oligomannose) and pink (0%−29% oligomannose).
Figure 2
Figure 2
In vitro B cell activation by SARS-CoV-2 S-I53-50A.1NT1 and SARS-CoV-2 S-I53-50NPs B cells expressing the SARS-CoV-2 S-protein-specific NAbs COVA1-18 (top) or COVA2-15 (bottom) as BCRs were incubated with either SARS-CoV-2 S-I53-50A.1NT1 (magenta), SARS-CoV-2 S-I53-50NP (green), ionomycin (beige), or BG505 I53-50NP (gray) or not stimulated (black). The experiments were performed with 5, 1, 0.2, or 0.04 μg/mL SARS-CoV-2 S-I53-50A.1NT1, as indicated in the top left corner of each graph, or the equimolar amount of SARS-CoV-2 S or BG505 SOSIP on I53-50NPs. Ionomycin was used at 1 mg/mL as a positive control.
Figure 3
Figure 3
Immunogenicity of SARS-CoV-2 S-I53-50NPs in mice and rabbits (A) Study schedule in mice (left) and rabbits (right). Black triangles indicate the time points of immunization and drops indicate the bleeds. (B) ELISA endpoint titers for SARS-CoV-2 S-protein-specific IgG in mice. (C) ELISA endpoint titers for SARS-CoV-2 S-protein-specific IgG in rabbits. (D) SARS-CoV-2 pseudovirus and authentic virus neutralization titers in mice. (E) SARS-CoV-2 pseudovirus and authentic virus neutralization in rabbits. In (B) and (C), due to limited volumes of sera at week −1, random pairs of mice sera were pooled. At week 6, two animals were sacrificed. In (B)–(E), the median titers are indicated by a bar. Titers between boosts were compared using the Mann-Whitney U test (p < 0.05; ∗∗p < 0.01; ∗∗∗p < 0.001).
Figure 4
Figure 4
SARS-CoV-2 S-protein-specific B and T cell responses induced by SARS-CoV-2 S-I53-50NPs in cynomolgus macaques (A) Vaccination, challenge, and sampling schedule in cynomolgus macaques. Black triangles indicate the time points of vaccination and drops mark the bleeds. The symbols identifying individual macaques are used consistently throughout Figures 4, 5, and 6. (B) Representative gating strategy, depicting the analysis of SARS-CoV-2 S protein and RBD-specific IgG+ B cells, shown for one vaccinated macaque. The lymphocyte population was selected, and doublets were excluded (not shown). Gating strategy from the left to the right: viable B cells (live/deadCD20+), IgG+ B cells (IgMIgG+), SARS-CoV-2 S protein (double probe staining), and RBD-specific (single probe staining) IgG+ B cells. (C) SARS-CoV-2 S-protein-specific B cell frequencies within the IgG+ population in control and vaccinated macaques (left). Percentages of SARS-CoV-2 RBD-specific B cells within the population of SARS-CoV-2 S-protein-specific IgG+ B cells (right). (D) Number of interferon-γ (IFNγ)-secreting cells after ex vivo stimulation with SARS-CoV-2 S protein as analyzed by ELISpot and plotted as spot-forming cells (SFCs) per 1.0 × 106 peripheral blood mononuclear cells (PBMCs). (E) Frequency of SARS-CoV-2 S-protein-specific Tfh cells (CD69+CD154+CXCR5+) in the total CD4+ T cell population. PBMCs were stimulated overnight with SARS-CoV-2 S protein and Tfh activation was assessed the next day by analyzing CD69 and CD154 expression by flow cytometry. The gating strategy used to identify this population is shown in Figure S3. In (C)-(E) medians are indicated by a bar. Groups were compared using the Mann-Whitney U test (p < 0.05; ∗∗p < 0.01). See also Figures S2 and S3.
Figure S2
Figure S2
SARS-CoV-2 S-protein-specific CD27+ B cell responses in control and vaccinated macaques, related to Figure 4 (A) Representative gating strategy for the identification of SARS-CoV-2 S protein and RBD-specific CD27+ B cells for control (top) and vaccinated (bottom) macaques. The live B cell population was selected and doublets were excluded (not shown). (B) Frequency of SARS-CoV-2 S protein-specific cells among CD27+ B cells in control and vaccinated macaques. (C) Frequency of SARS-CoV-2 RBD-specific cells among CD27+ B cells in control and vaccinated macaques. In (B) and (C) bars indicate median. Groups were compared using the Mann-Whitney U test (p < 0.05; ∗∗p < 0.01).
Figure S3
Figure S3
SARS-CoV-2 S-protein-specific Tfh cell and CD4 T cell responses in control and vaccinated macaques, related to Figure 4 (A) Representative gating strategy for the identification of SARS-CoV-2 S protein-specific Tfh cells. PBMCs were stimulated overnight with SARS-CoV-2 S protein and Tfh activation was assessed the next day by analyzing CD69 and CD154 expression. (B) Frequency of total Tfh cells in CD4+ T cell population following stimulation with SARS-CoV-2 S protein. (C) Frequency of SARS-CoV-2 S-protein specific Tfh cells within the total Tfh cell population. Corresponding background (i.e., frequency of activated Tfh cells in non-stimulated cells) has been subtracted from each data point. (D) Frequency of SARS-CoV-2 S protein-specific cells among CD4- T cells (CD8+ T cells by inference) as determined by the AIM assay using 4-1BB + CD69 (left) and 4-1BB + CD154 (right) as activation markers. Similar to (A), CD4- cells were stimulated overnight with SARS-CoV-2 S protein and activation was assessed using activation markers. Corresponding background (i.e., frequency of activated CD4- cells in non-stimulated cells) has been subtracted from each data point. In (B)-(D) bars indicate median.
Figure 5
Figure 5
Serological responses induced by SARS-CoV-2 S-I53-50NPs in cynomolgus macaques (A) ELISA endpoint titers for SARS-CoV-2 S-protein-specific IgG. The gray line represents the median titers over time. (B) SARS-CoV-2 S-protein-specific binding titers at weeks 6 and 12 in macaques compared to those in convalescent humans from the COSCA cohort. Patient samples were taken 4 weeks after onset of symptoms. (C) SARS-CoV-2 RBD-specific binding titers at weeks 6 and 12 in macaques compared to those in convalescent humans from the COSCA cohort. (D) Relative mean fluorescence intensity (MFI) of IgG, IgA, and IgM binding to SARS-CoV-2 S protein measured with a Luminex-based serology assay in serum samples, nasopharyngeal swabs, and saliva samples. Shown are medians with the shaded areas indicating the interquartile ranges. (E) SARS-CoV-2 pseudovirus neutralization titers. The gray line represents median titers. (F) SARS-CoV-2 pseudovirus neutralization titers at weeks 6 and 12 in macaques compared to those in convalescent humans from the COSCA cohort. (G) SARS-CoV-2 authentic virus neutralization titers at weeks 6 and 12. The bars show the median titers. In (B), (C), and (F), groups were compared using the Mann-Whitney U test (∗∗p < 0.01; ∗∗∗∗p < 0.0001). The bars indicate median titers. The dotted lines indicate the lowest serum dilution. See also Figure S4.
Figure S4
Figure S4
SARS-CoV-2 S-protein-specific Ig levels and Fc-receptor binding in vaccinated cynomolgus macaques in samples from diverse anatomical sites, related to Figure 5 (A) Relative MFI of IgG (left), IgA (middle) and IgM (right) binding to SARS-CoV-2 S protein measured with a Luminex-based serology assay in serum samples. (B) Relative MFI of IgG and IgA binding to SARS-CoV-2 S in nasopharyngeal swabs. (C) Relative MFI of IgG and IgA binding to SARS-CoV-2 S in saliva. (D) Relative MFI of FcγRIIa (left), FcγRIIIa (middle) and C1q (right) binding to SARS-CoV-2 S protein-specific IgG in serum samples.
Figure 6
Figure 6
Protective efficacy of SARS-CoV-2 S-I53-50NPs in cynomolgus macaques (A) Median RNA viral loads in tracheal swabs (left) and nasopharyngeal swabs (middle) of control and vaccinated macaques after challenge. The shaded area indicates the range. Viral loads in control and vaccinated macaques after challenge in BAL are shown (right). Bars indicate median viral loads. Vertical red dotted lines indicate the day of challenge. Horizontal dotted lines indicate the limit of quantification. (B) sgRNA viral loads in tracheal swabs (left), nasopharyngeal swabs (middle), and BAL (right) of control and vaccinated macaques after challenge. Bars indicate median viral loads. Dotted line indicates the limit of detection. (C) Emerged viral variants found by viral sequencing in nasopharyngeal swabs at 3 dpe (left) and 5 dpe (middle) and BAL at 3 dpe. Colors indicate the open reading frames (ORFs) in which mutations were found, as depicted in the legend below. For a list of all identified variants, see Table S3. Note that the challenge stock already contained two viral variants, V367F in S protein and G251V in ORF3a. (D) Lung CT scores of control and vaccinated macaques over the course of 14 dpe. CT score includes lesion type (scored from 0 to 3) and lesion volume (scored from 0 to 4) summed for each lobe. (E) Median lymphocyte counts over time in the blood of control and vaccinated macaques after challenge. Shaded area indicates the range. Symbols are the same as indicated in the left panel in (A). In (A), (B), and (E), groups were compared using the Mann-Whitney U test (p < 0.05; ∗∗p < 0.01). See also Figures S5 and S6.
Figure S5
Figure S5
Viral loads in control and vaccinated cynomolgus macaques after SARS-CoV-2 challenge, related to Figure 6 (A) RNA viral loads in tracheal swabs (top), nasopharyngeal swabs (middle) and rectal samples (bottom) of control (left) and SARS-CoV-2 S-I53-50NP vaccinated macaques (right) after challenge. The gray line represents the median viral load. Vertical red dotted lines indicate the day of challenge. Horizontal dotted lines indicate the limit of quantification. Symbols identify individual macaques. (B) Percentage of macaques in which the RNA viral loads is above the limit of quantification over time in tracheal swabs (left) and nasopharyngeal swabs (right).
Figure S6
Figure S6
Anamnestic immune response, lymphocyte counts, and emerged viral sequence variants in control and vaccinated cynomolgus macaques after SARS-CoV-2 challenge, related to Figure 6 (A) SARS-CoV-2 pseudovirus neutralization titers. The gray line represents the median titers over-time. (B) SARS-CoV-2 authentic virus neutralization titers. The gray line represents the median titers over-time. (C) Lymphocyte counts over time in the blood of control and SARS-CoV-2 S-I53-50NP vaccinated macaques after challenge. Vertical red dotted lines indicate the day of challenge. In (A)-(C) Symbols identify individual macaques as indicated Figure S5A. (D) Sum of viral variants found by viral sequencing, in nasopharyngeal swabs at 3 dpe and 5 dpe, and in BAL at 3 dpe, specified for the ORF in which it was found (top left) the type of nucleotide change (top right) and the effect is has on the amino acid sequence (bottom; missense_variant = amino acid change, synonymous_variant = no amino acid change, stop_gained = introduction of a stop codon). For a list of all identified variants see Table S3.

References

    1. Addetia A., Crawford K.H.D., Dingens A., Zhu H., Roychoudhury P., Huang M.L., Jerome K.R., Bloom J.D., Greninger A.L. Neutralizing antibodies correlate with protection from SARS-CoV-2 in humans during a fishery vessel outbreak with high attack rate. J. Clin. Microbiol. 2020;58:e02107–e02120. - PMC - PubMed
    1. Agnandji S.T., Lell B., Fernandes J.F., Abossolo B.P., Methogo B.G., Kabwende A.L., Adegnika A.A., Mordmüller B., Issifou S., Kremsner P.G., RTS,S Clinical Trials Partnership A phase 3 trial of RTS,S/AS01 malaria vaccine in African infants. N. Engl. J. Med. 2012;367:2284–2295. - PMC - PubMed
    1. Amanat F., Strohmeier S., Rathnasinghe R., Schotsaert M., Coughlan L., García-Sastre A., Krammer F. Introduction of two prolines and removal of the polybasic cleavage site leads to optimal efficacy of a recombinant spike based SARS-CoV-2 vaccine in the mouse model. bioRxiv. 2020 doi: 10.1101/2020.09.16.300970. - DOI - PMC - PubMed
    1. Antanasijevic A., Ueda G., Brouwer P.J.M., Copps J., Huang D., Allen J.D., Cottrell C.A., Yasmeen A., Sewall L.M., Bontjer I. Structural and functional evaluation of de novo-designed, two-component nanoparticle carriers for HIV Env trimer immunogens. PLoS Pathog. 2020;16:e1008665. - PMC - PubMed
    1. Bachmann M.F., Jennings G.T. Vaccine delivery: a matter of size, geometry, kinetics and molecular patterns. Nat. Rev. Immunol. 2010;10:787–796. - PubMed

Publication types

Substances