. 2021 Apr 12;39(4):509-528.e20.
doi: 10.1016/j.ccell.2021.01.006. Epub 2021 Feb 11.

Proteogenomic and metabolomic characterization of human glioblastoma

Liang-Bo Wang  1 Alla Karpova  1 Marina A Gritsenko  2 Jennifer E Kyle  2 Song Cao  1 Yize Li  1 Dmitry Rykunov  3 Antonio Colaprico  4 Joseph H Rothstein  3 Runyu Hong  5 Vasileios Stathias  6 MacIntosh Cornwell  7 Francesca Petralia  3 Yige Wu  1 Boris Reva  3 Karsten Krug  8 Pietro Pugliese  9 Emily Kawaler  5 Lindsey K Olsen  10 Wen-Wei Liang  1 Xiaoyu Song  11 Yongchao Dou  12 Michael C Wendl  13 Wagma Caravan  1 Wenke Liu  5 Daniel Cui Zhou  1 Jiayi Ji  11 Chia-Feng Tsai  2 Vladislav A Petyuk  2 Jamie Moon  2 Weiping Ma  3 Rosalie K Chu  2 Karl K Weitz  2 Ronald J Moore  2 Matthew E Monroe  2 Rui Zhao  2 Xiaolu Yang  14 Seungyeul Yoo  3 Azra Krek  3 Alexis Demopoulos  15 Houxiang Zhu  1 Matthew A Wyczalkowski  1 Joshua F McMichael  1 Brittany L Henderson  10 Caleb M Lindgren  10 Hannah Boekweg  10 Shuangjia Lu  1 Jessika Baral  1 Lijun Yao  1 Kelly G Stratton  2 Lisa M Bramer  2 Erika Zink  2 Sneha P Couvillion  2 Kent J Bloodsworth  2 Shankha Satpathy  8 Weiva Sieh  16 Simina M Boca  17 Stephan Schürer  18 Feng Chen  19 Maciej Wiznerowicz  20 Karen A Ketchum  21 Emily S Boja  22 Christopher R Kinsinger  22 Ana I Robles  22 Tara Hiltke  22 Mathangi Thiagarajan  23 Alexey I Nesvizhskii  24 Bing Zhang  12 D R Mani  8 Michele Ceccarelli  25 Xi S Chen  4 Sandra L Cottingham  26 Qing Kay Li  27 Albert H Kim  28 David Fenyö  5 Kelly V Ruggles  7 Henry Rodriguez  22 Mehdi Mesri  22 Samuel H Payne  10 Adam C Resnick  29 Pei Wang  3 Richard D Smith  2 Antonio Iavarone  30 Milan G Chheda  31 Jill S Barnholtz-Sloan  32 Karin D Rodland  33 Tao Liu  34 Li Ding  35 Clinical Proteomic Tumor Analysis Consortium
Collaborators, Affiliations

Proteogenomic and metabolomic characterization of human glioblastoma

Liang-Bo Wang et al. Cancer Cell. .

Abstract

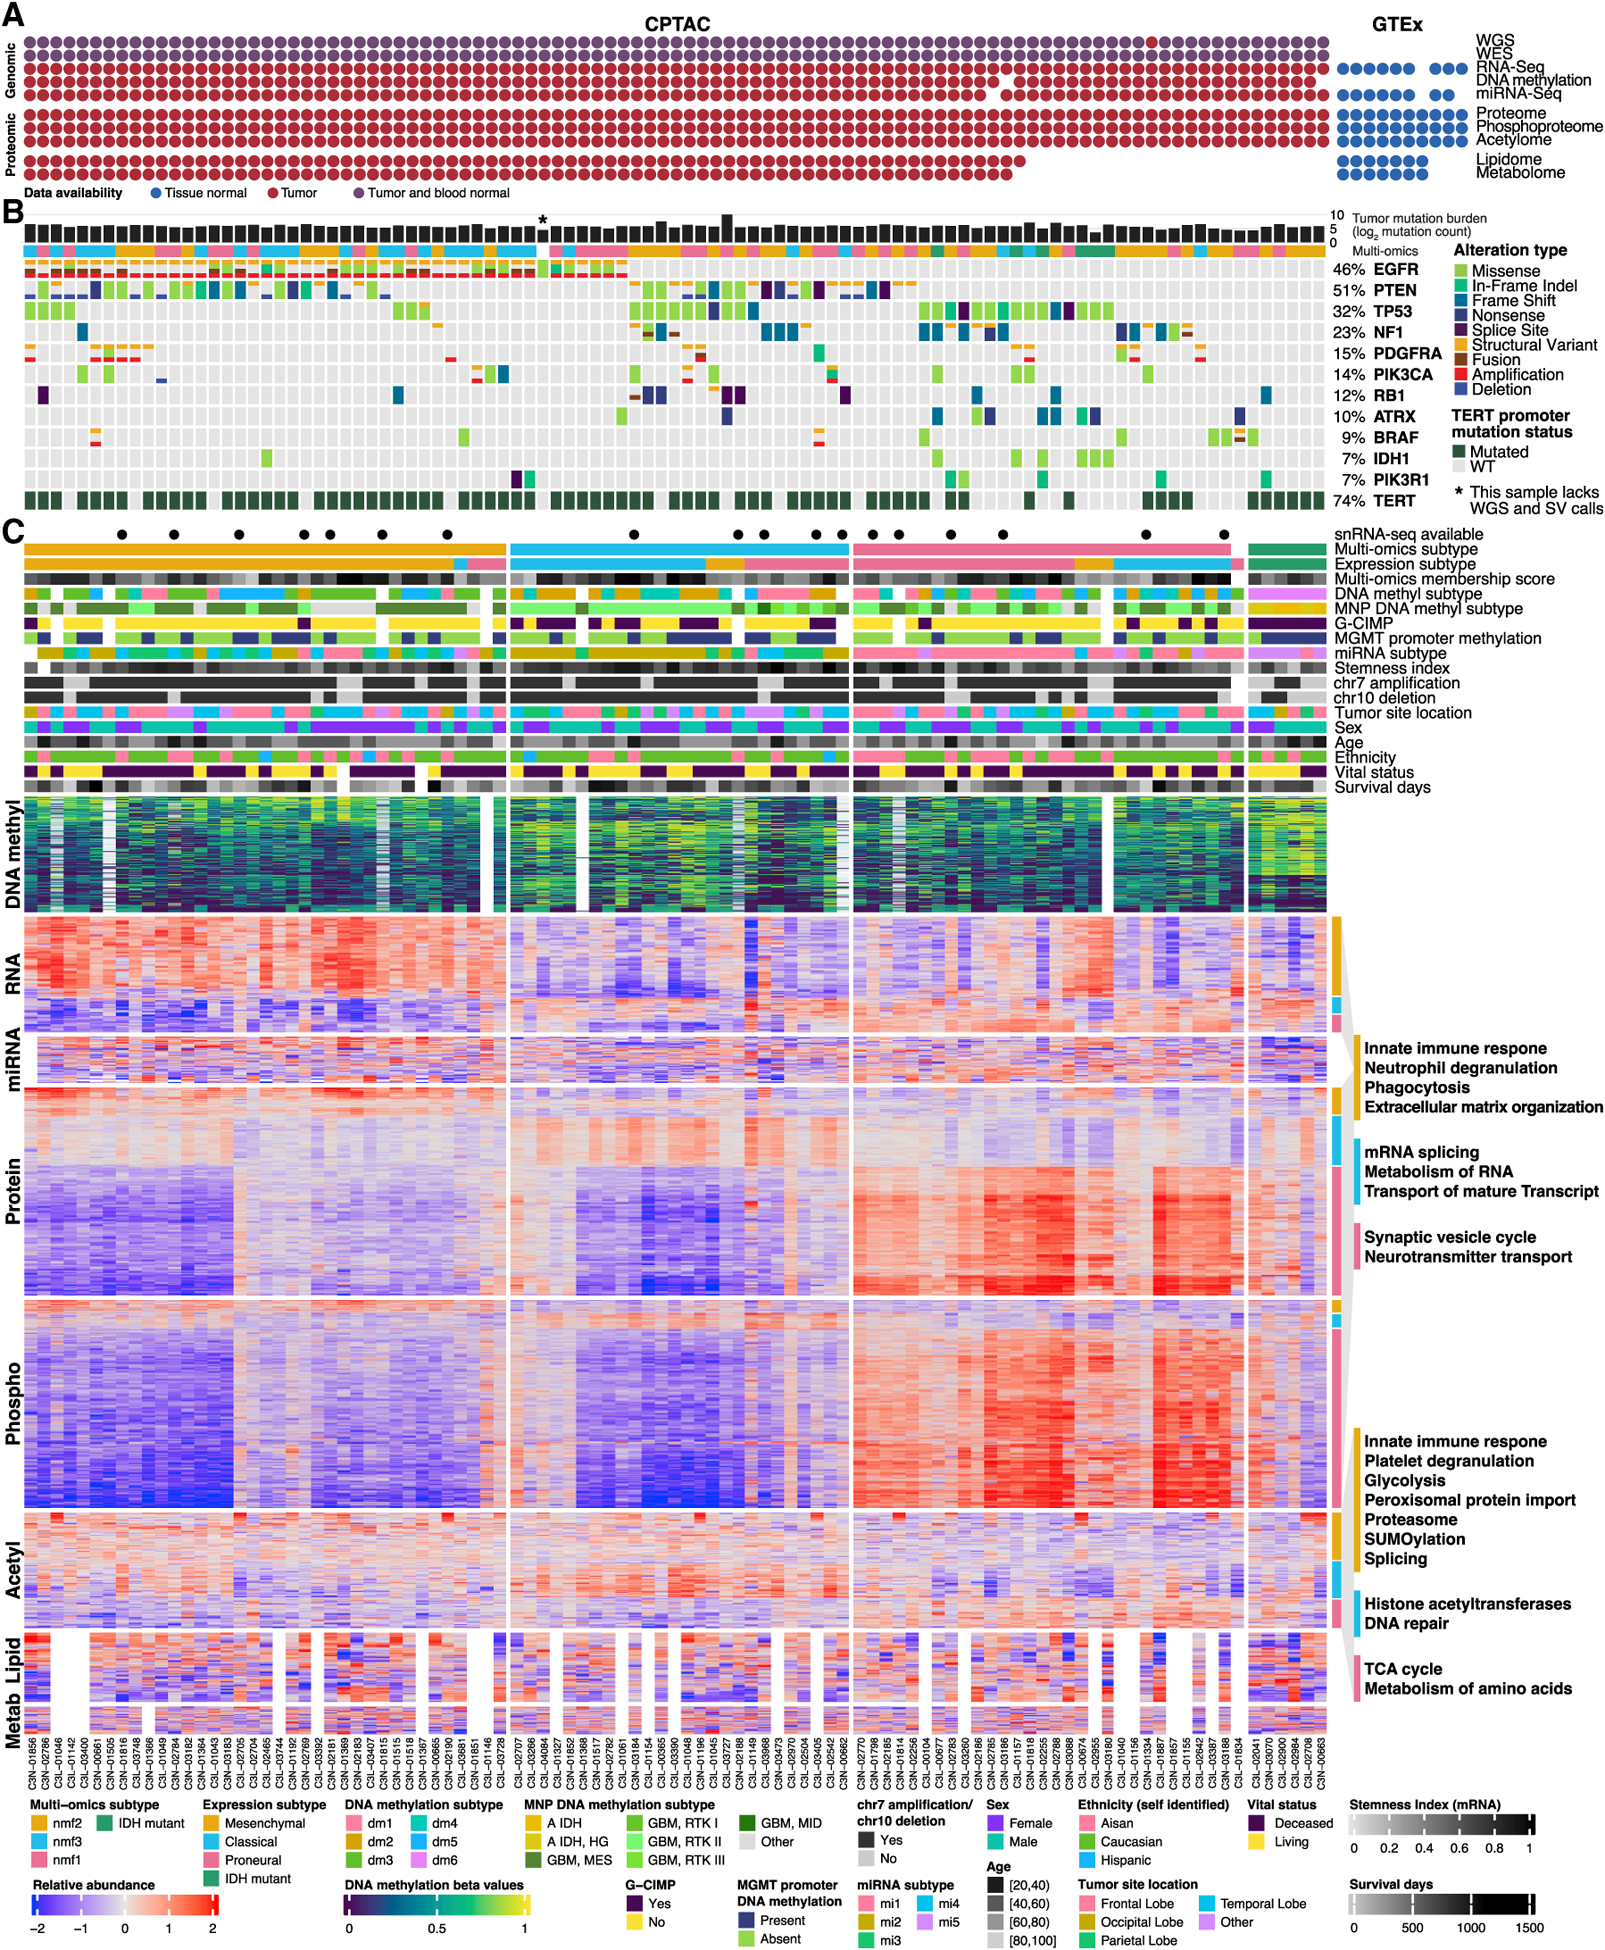
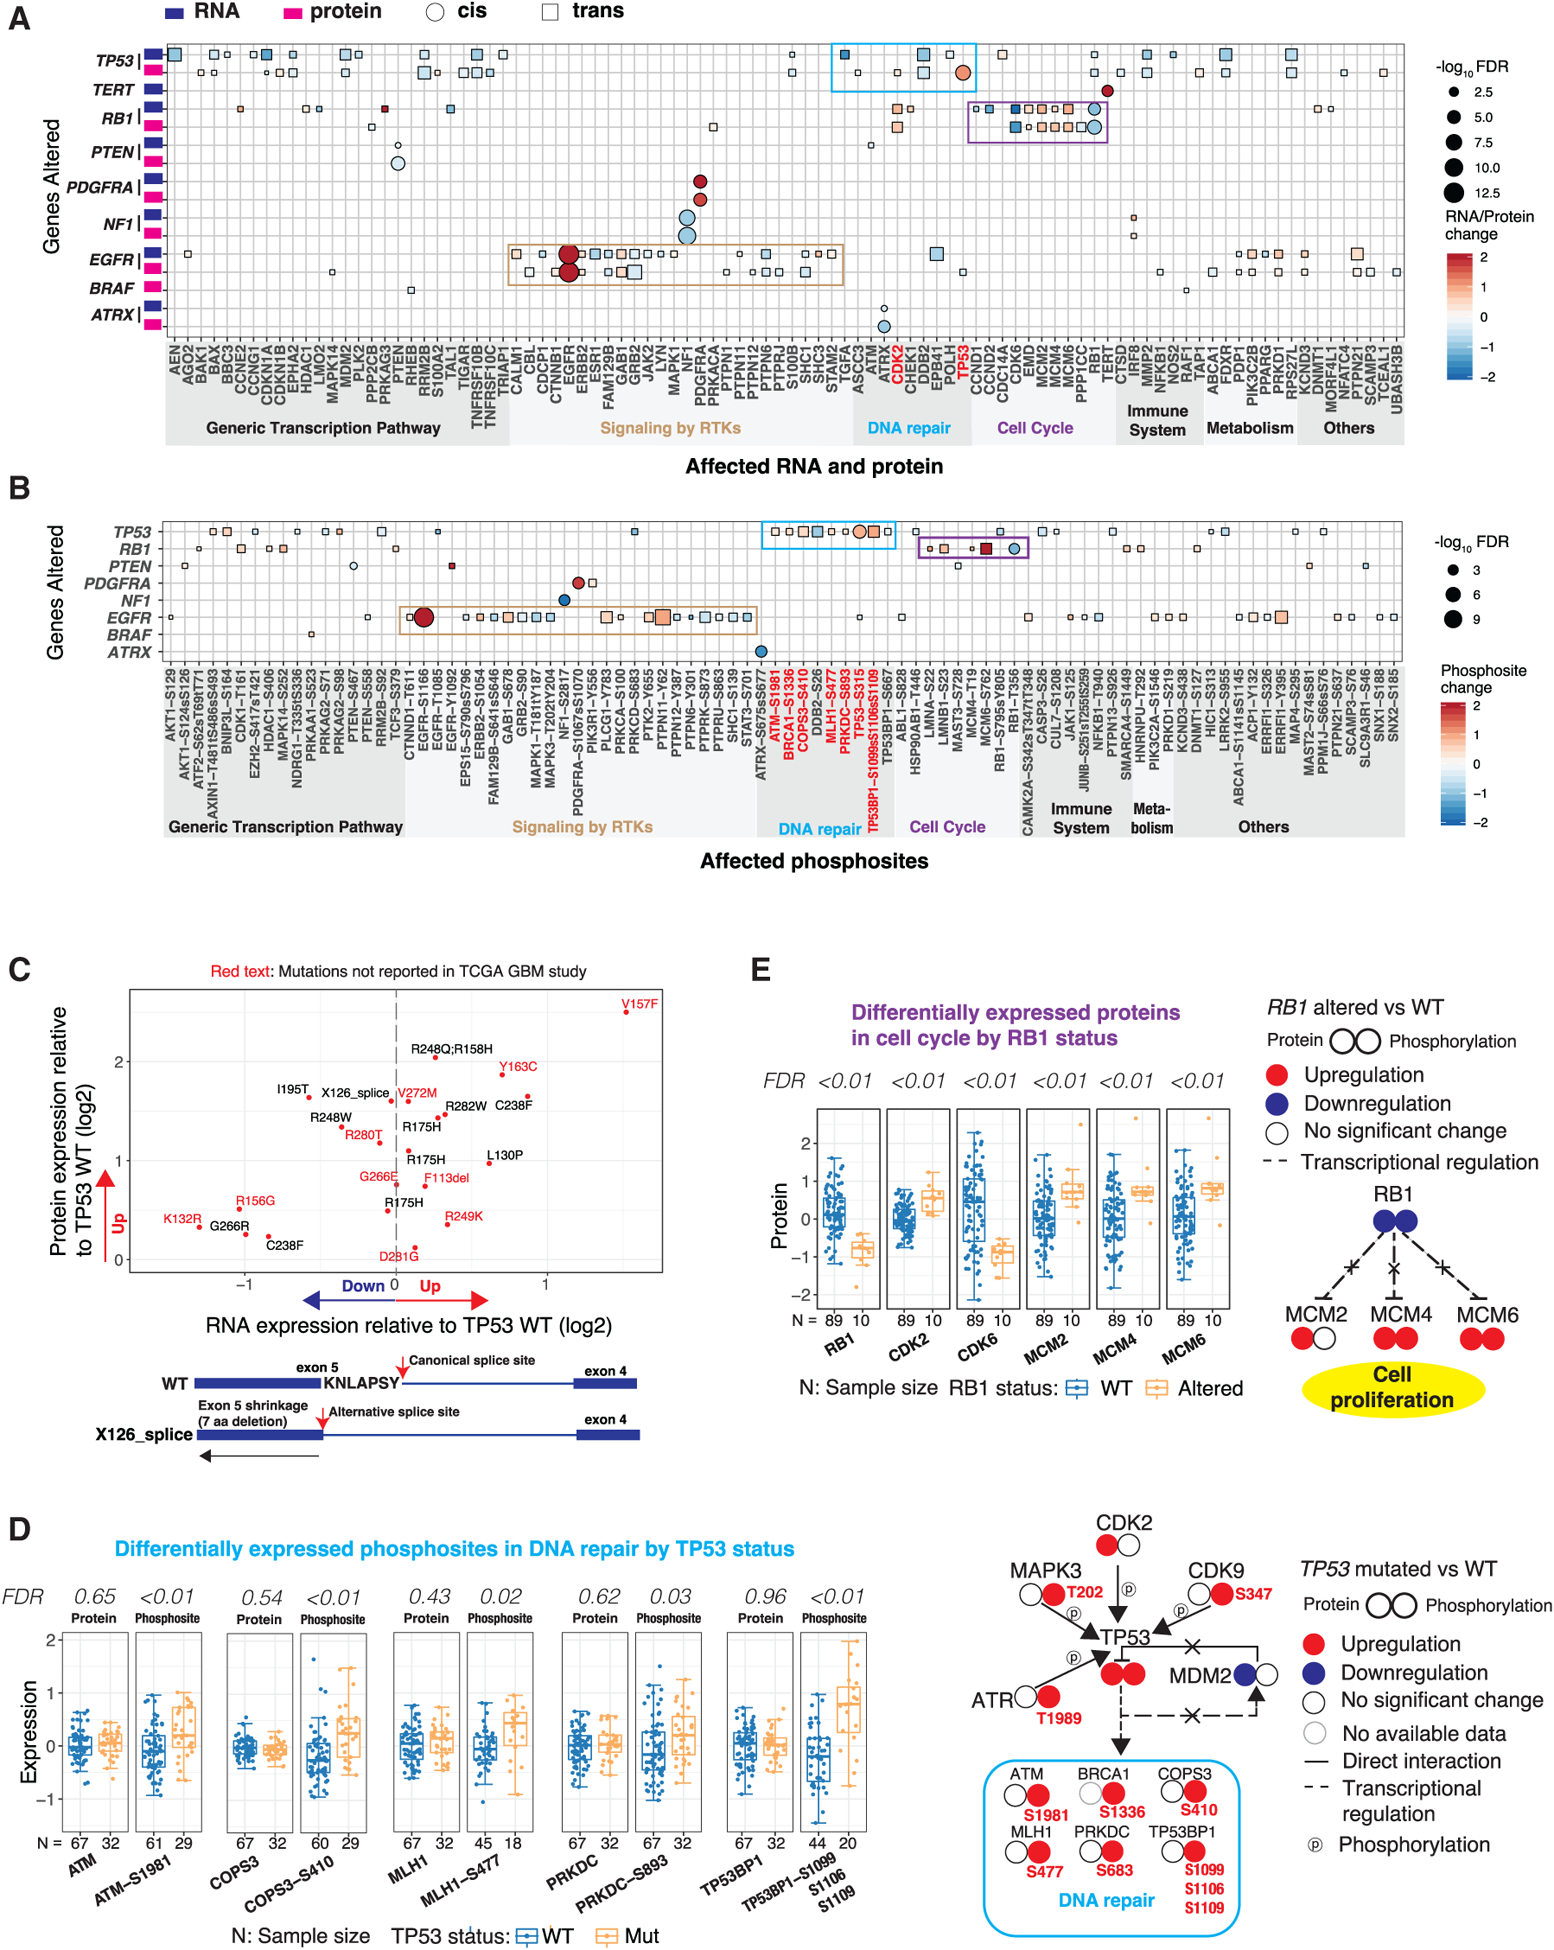
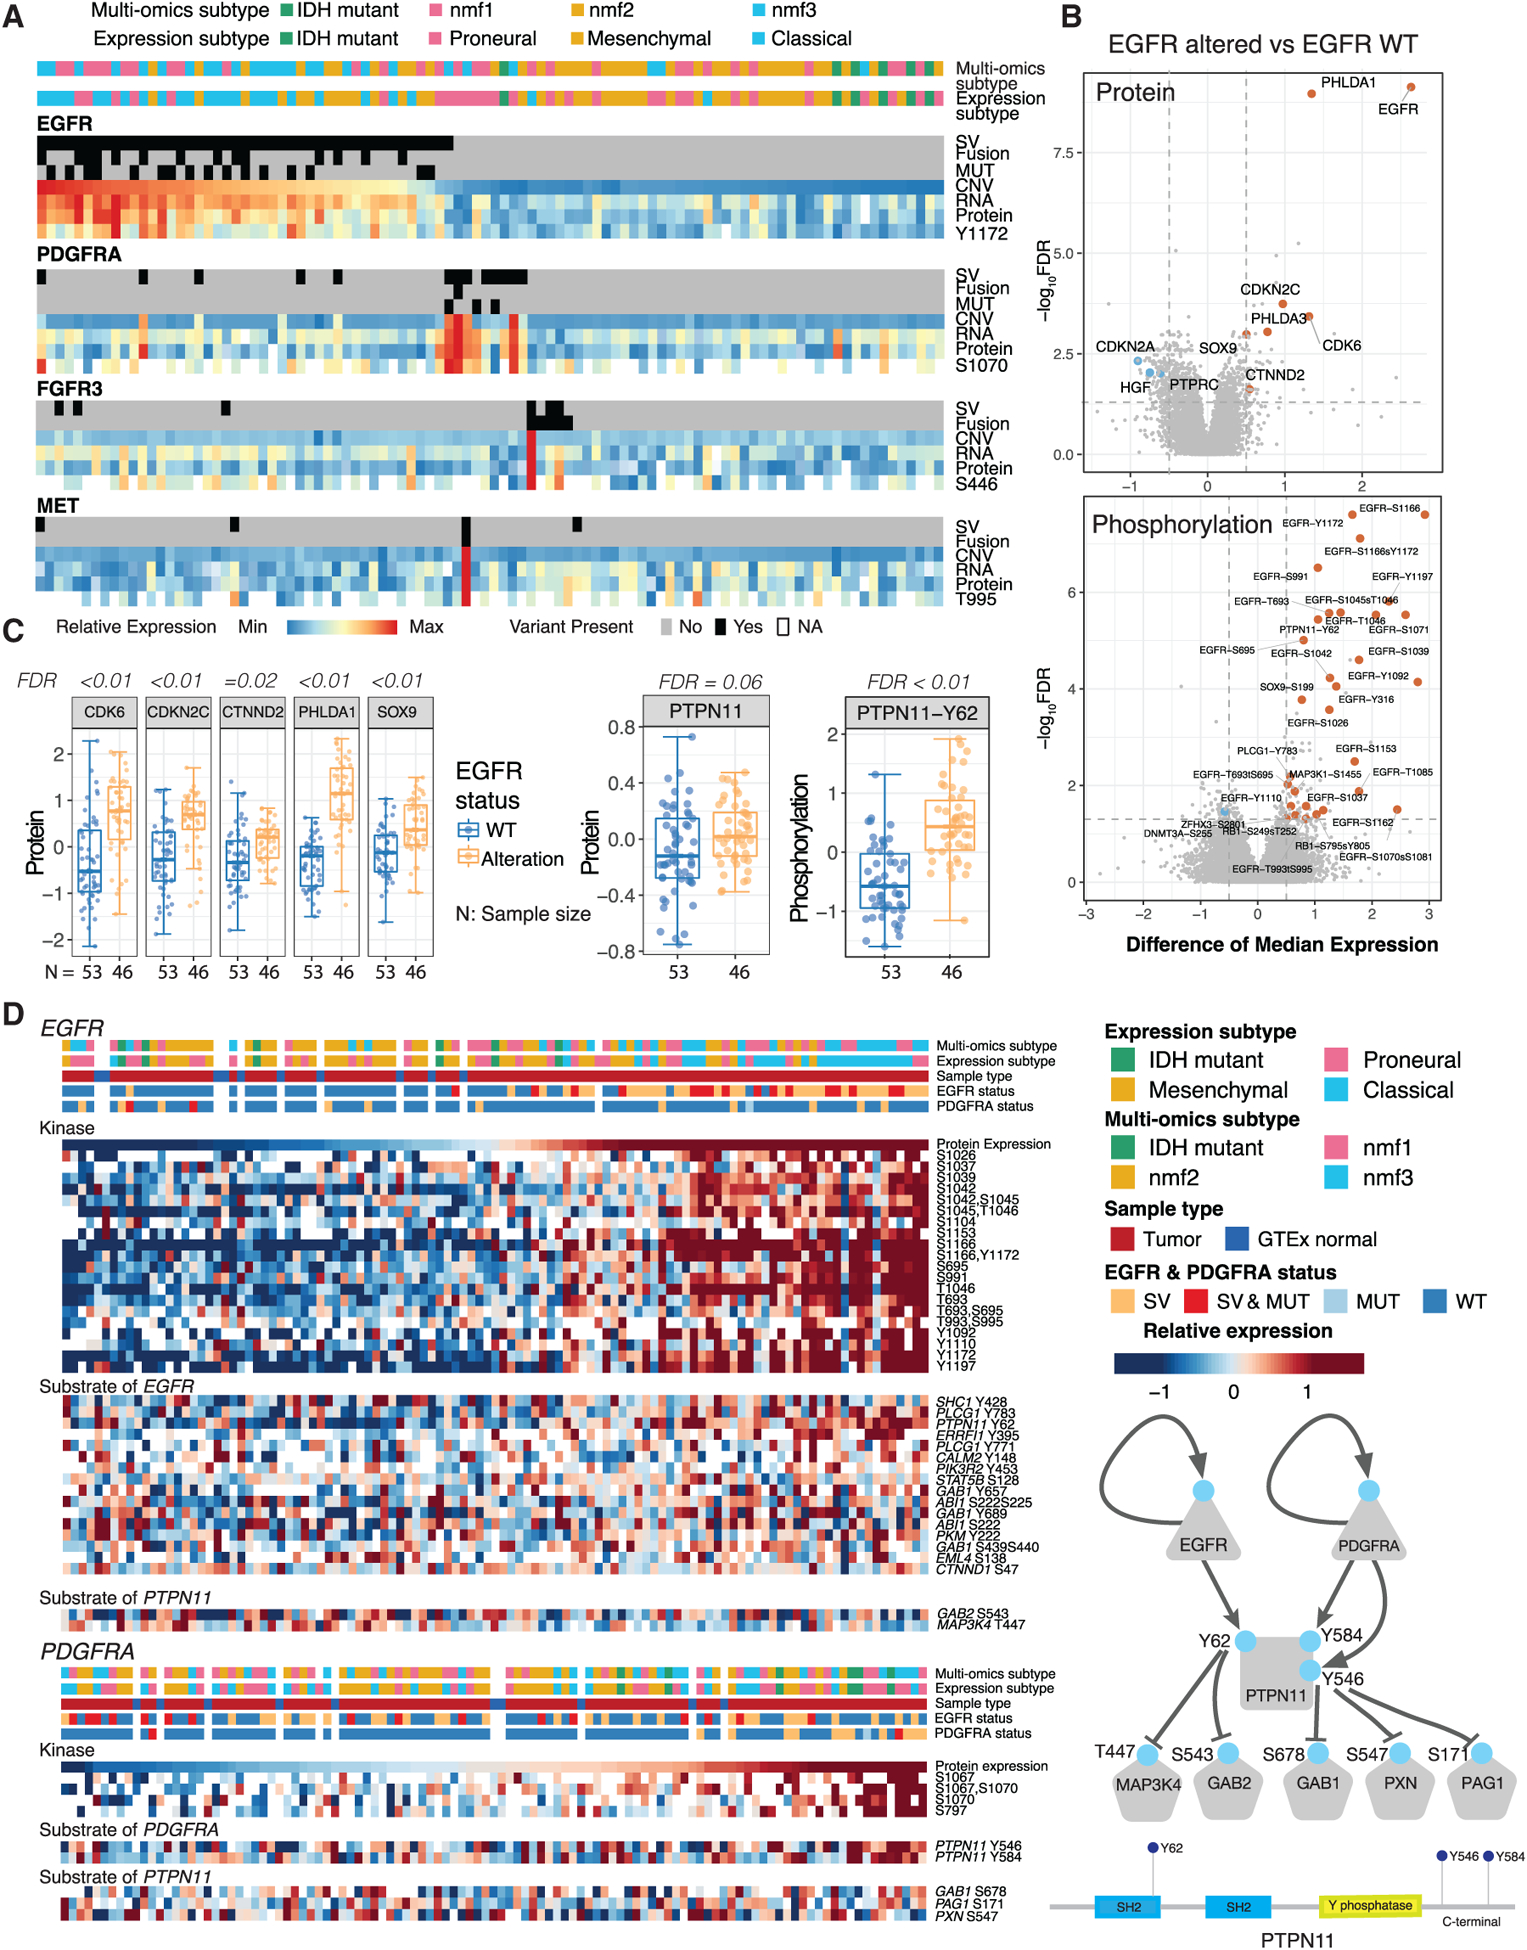
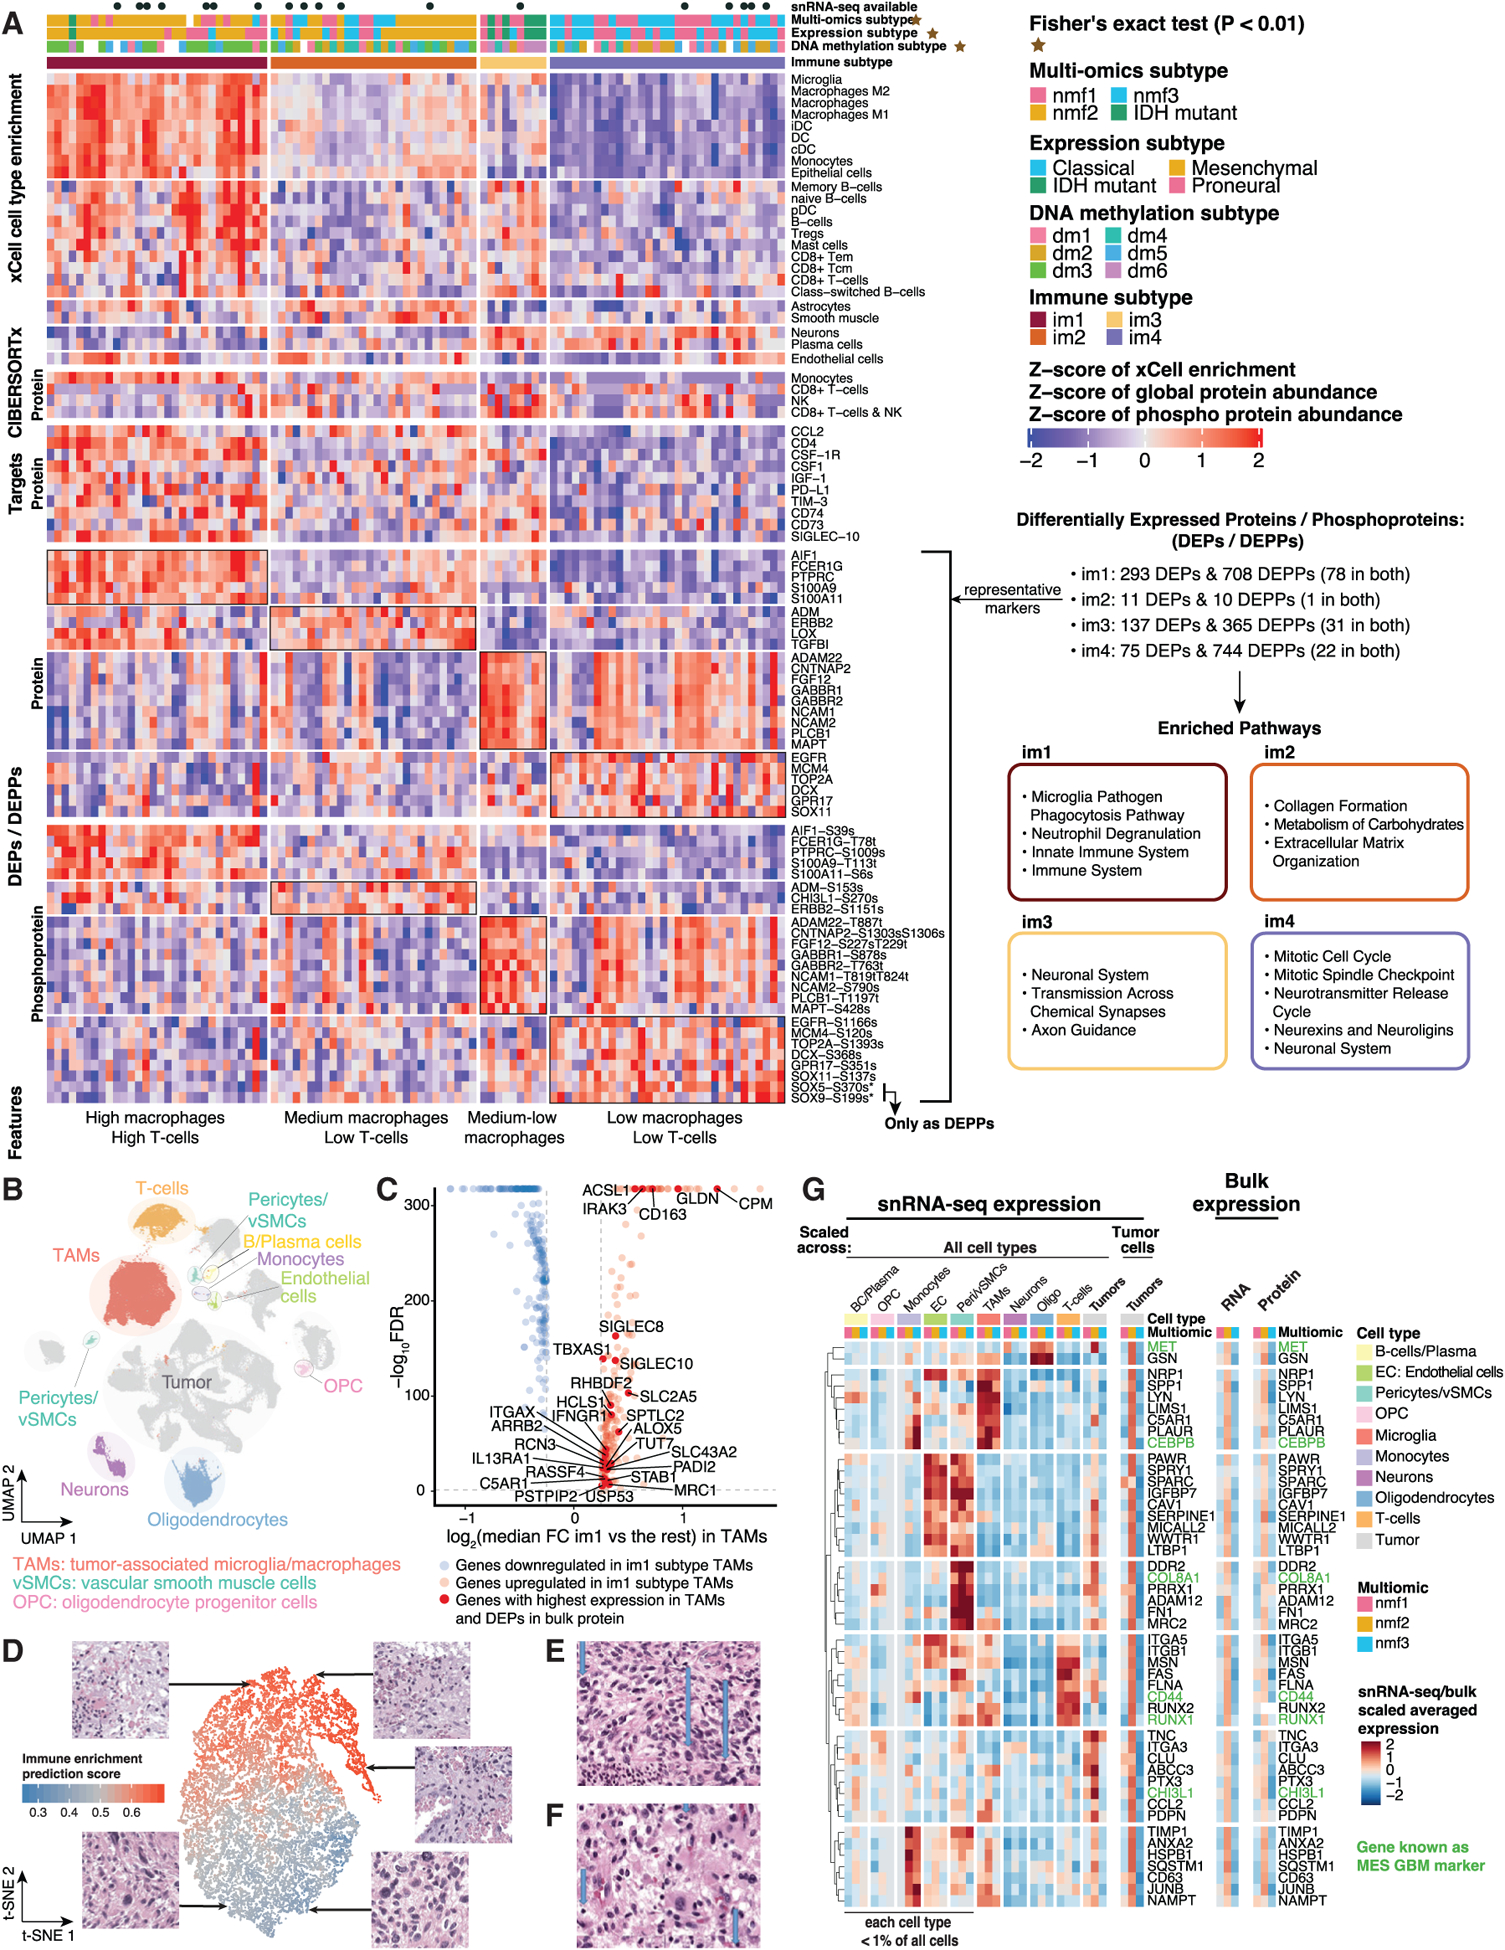
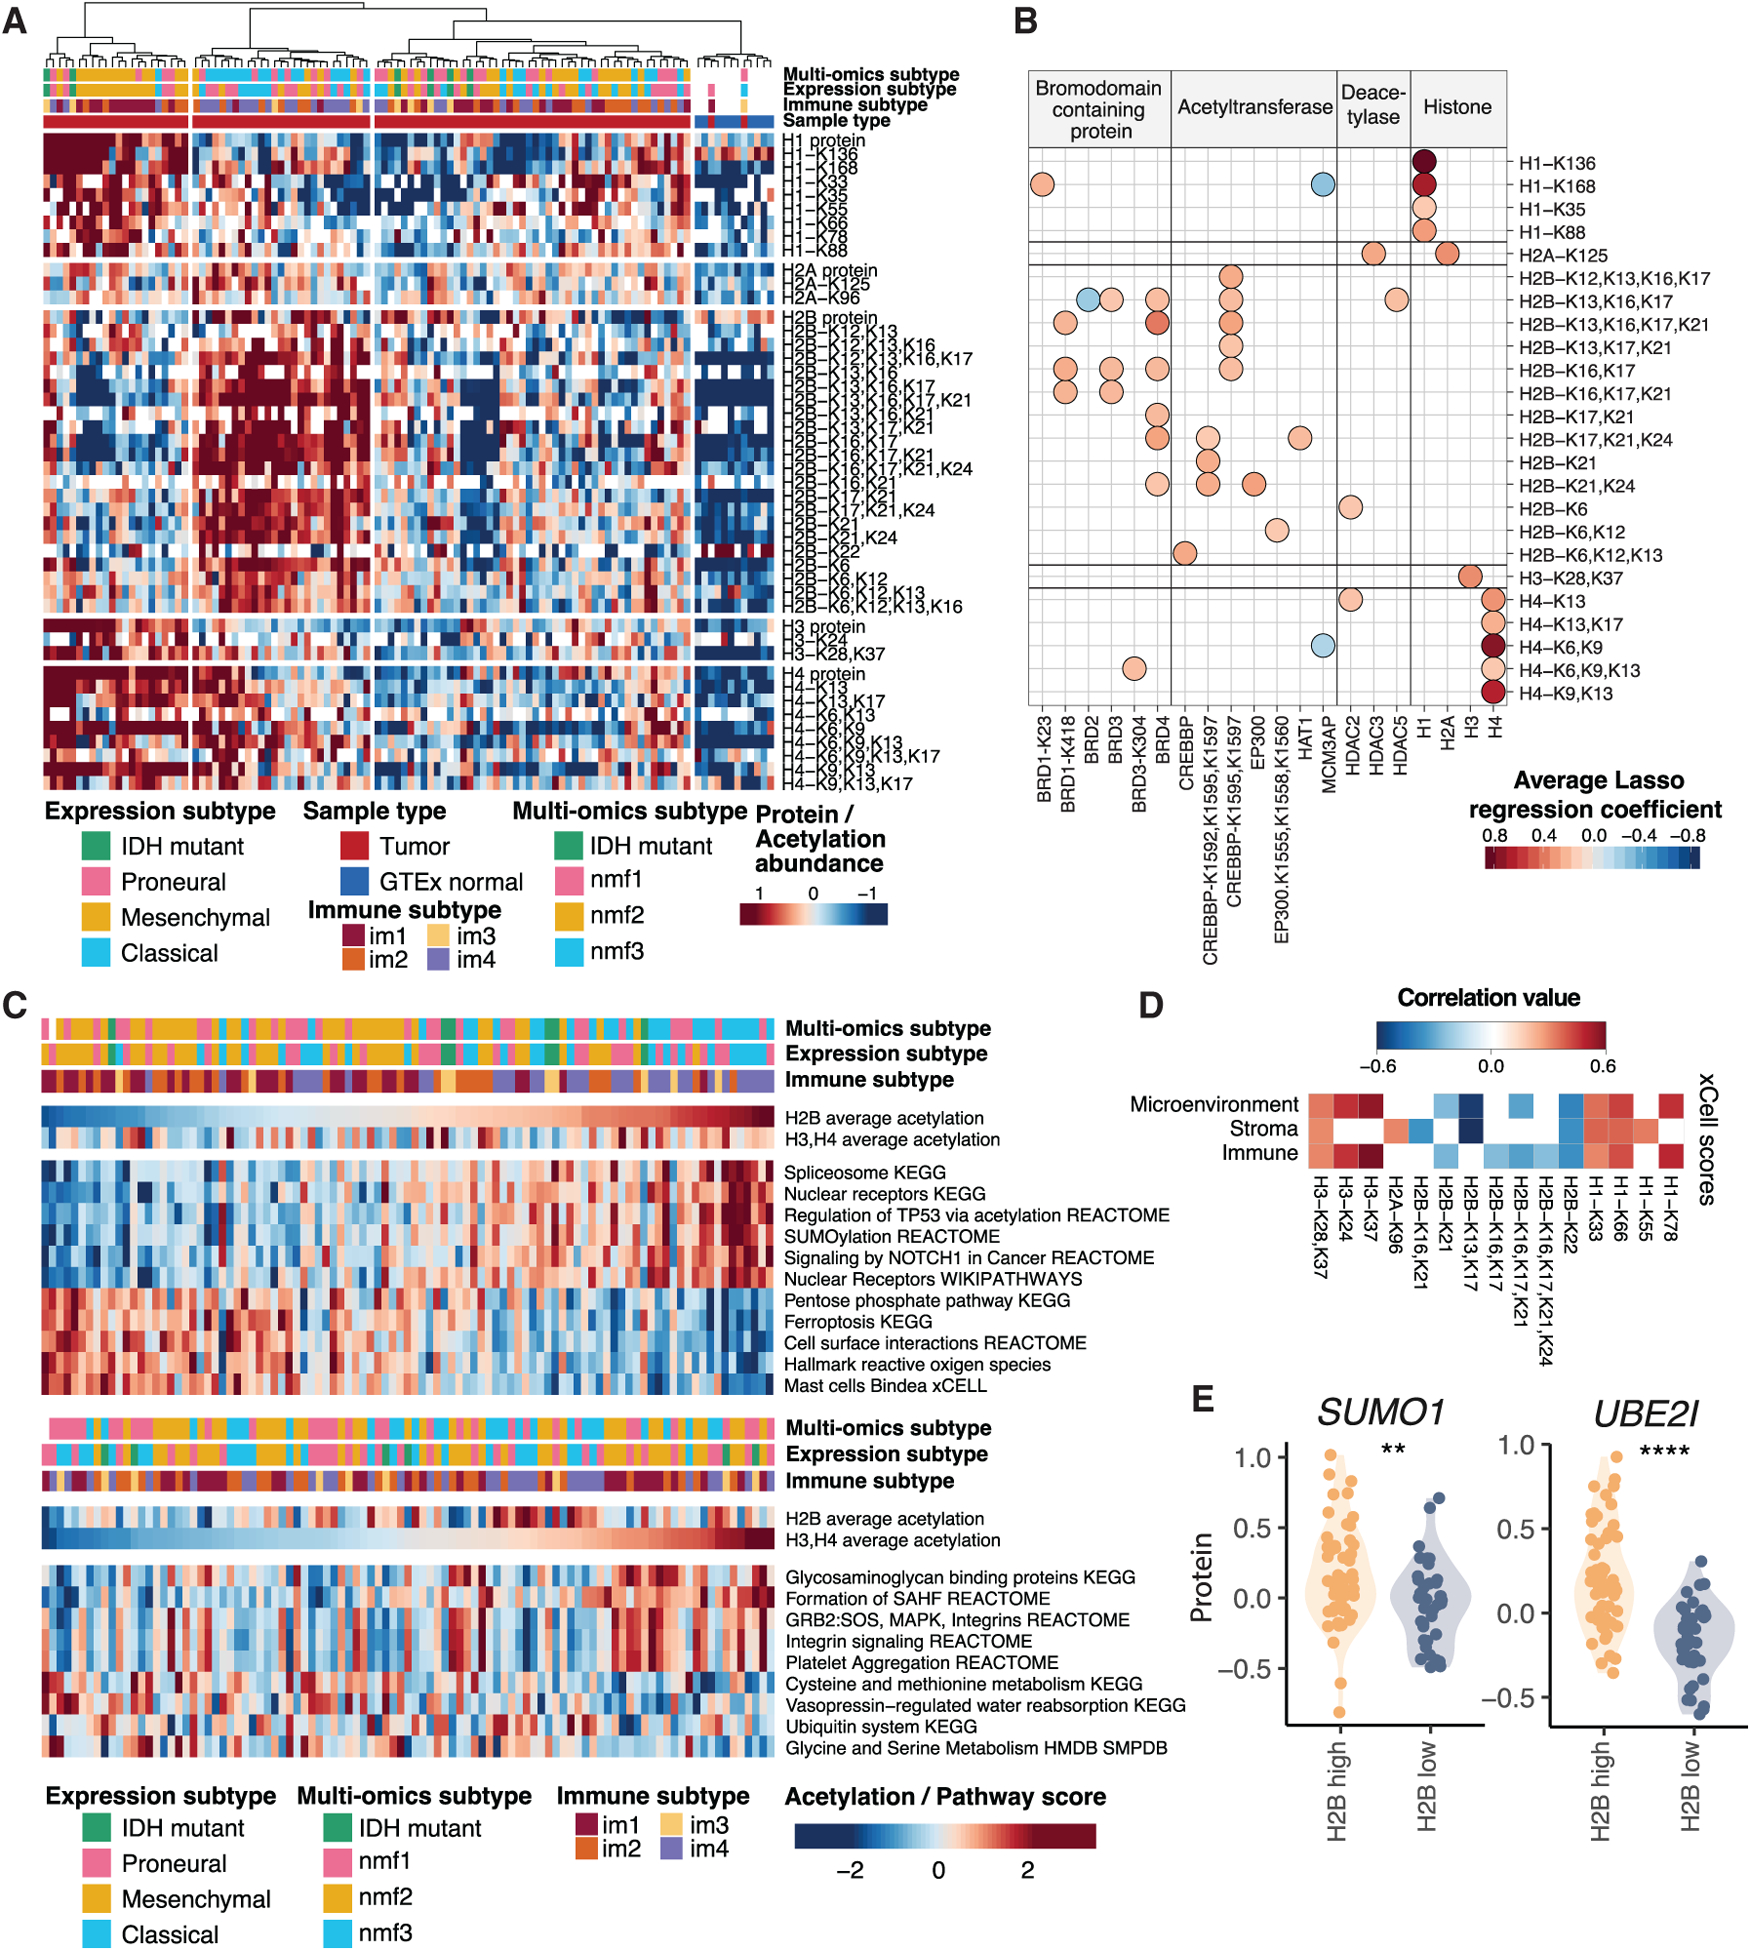
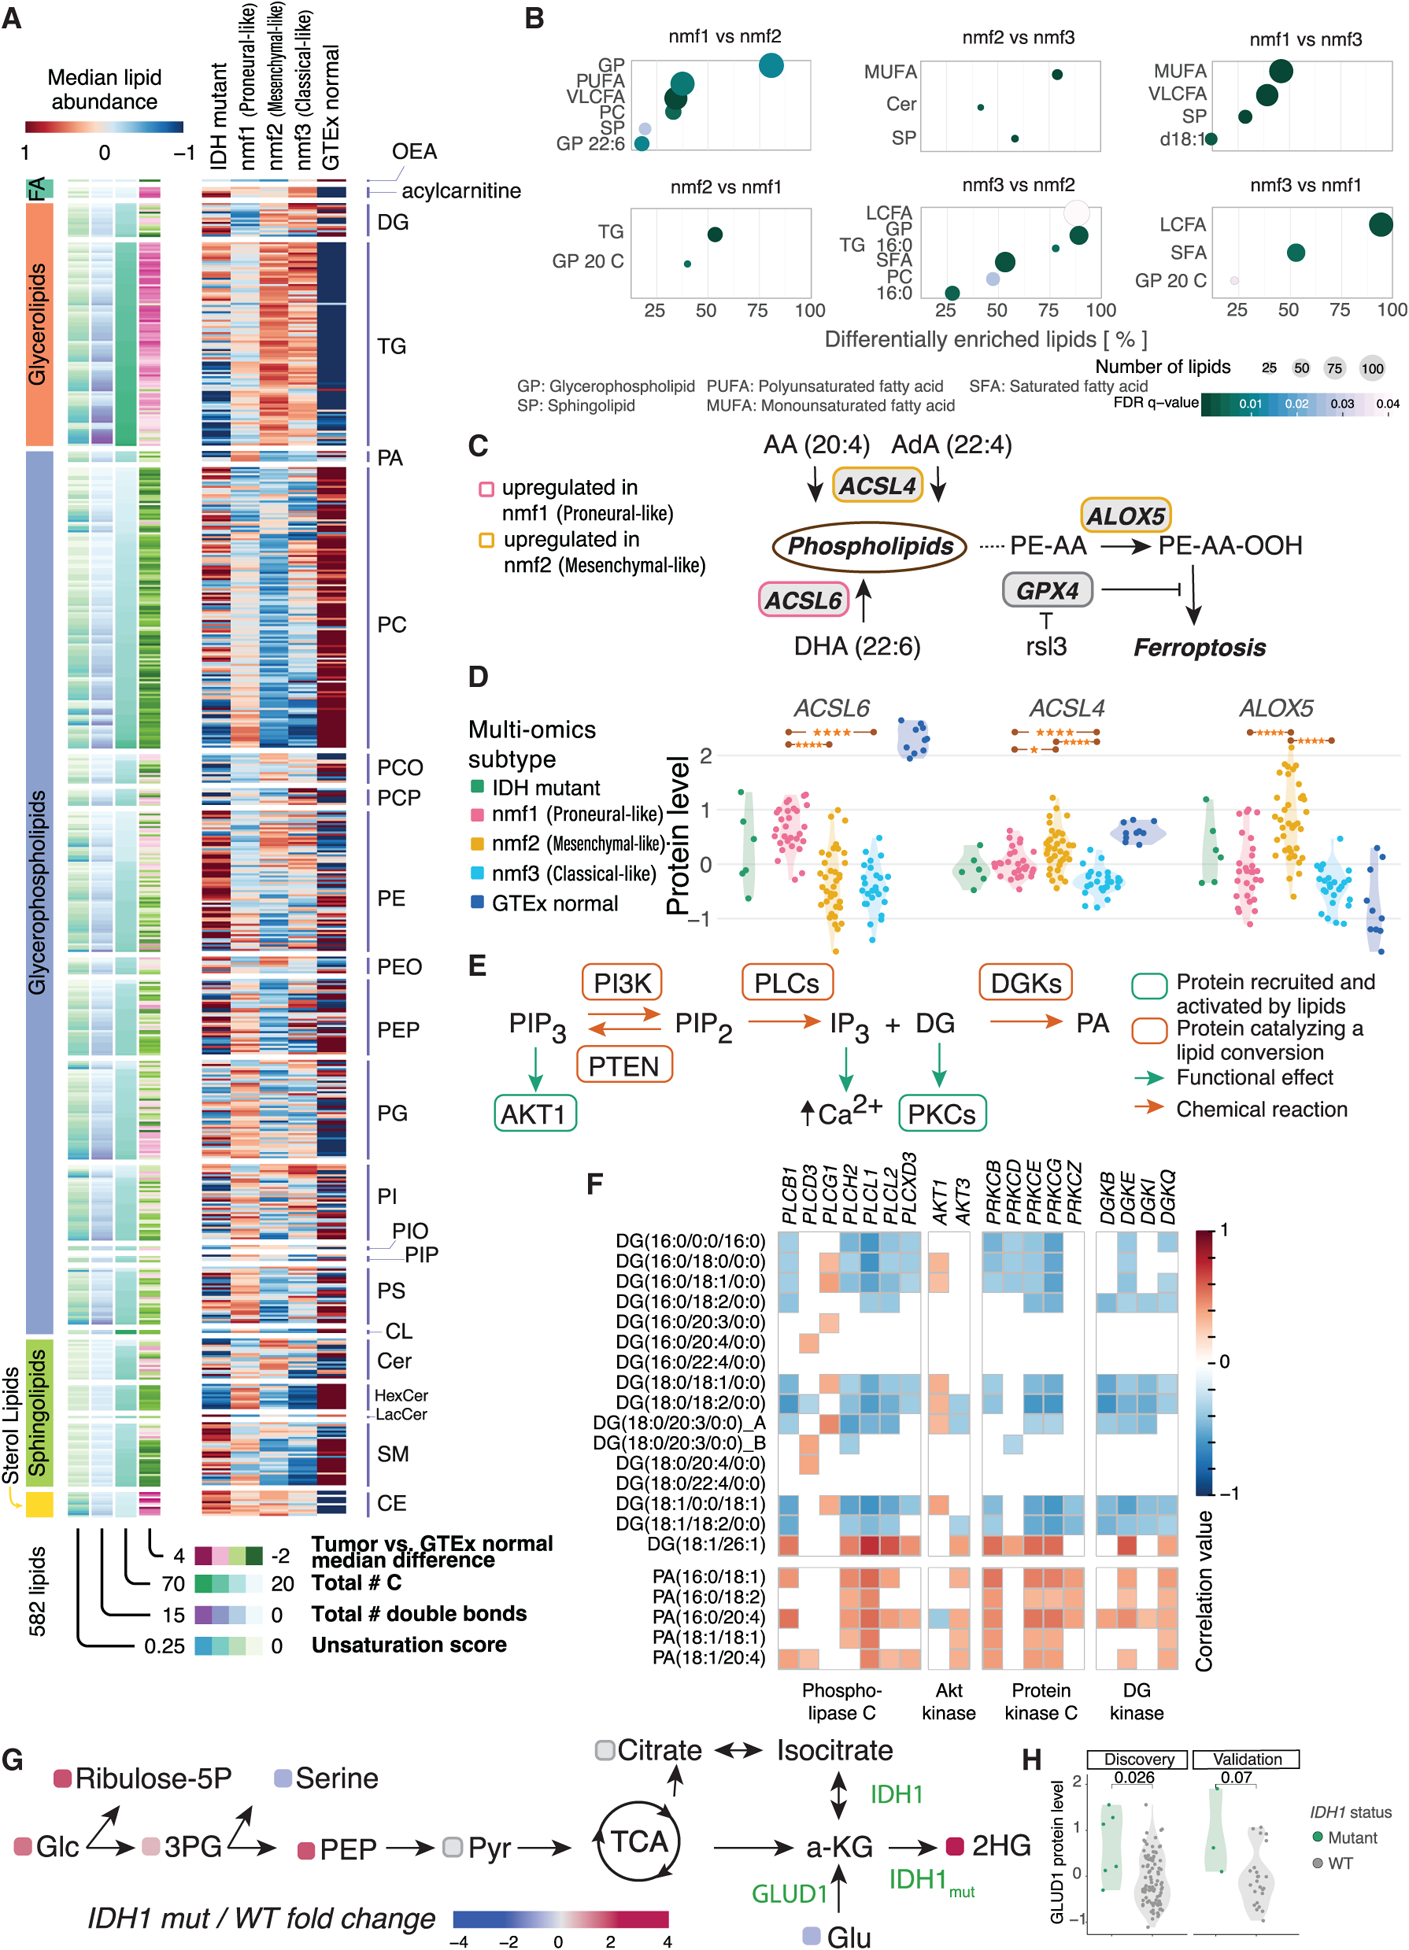
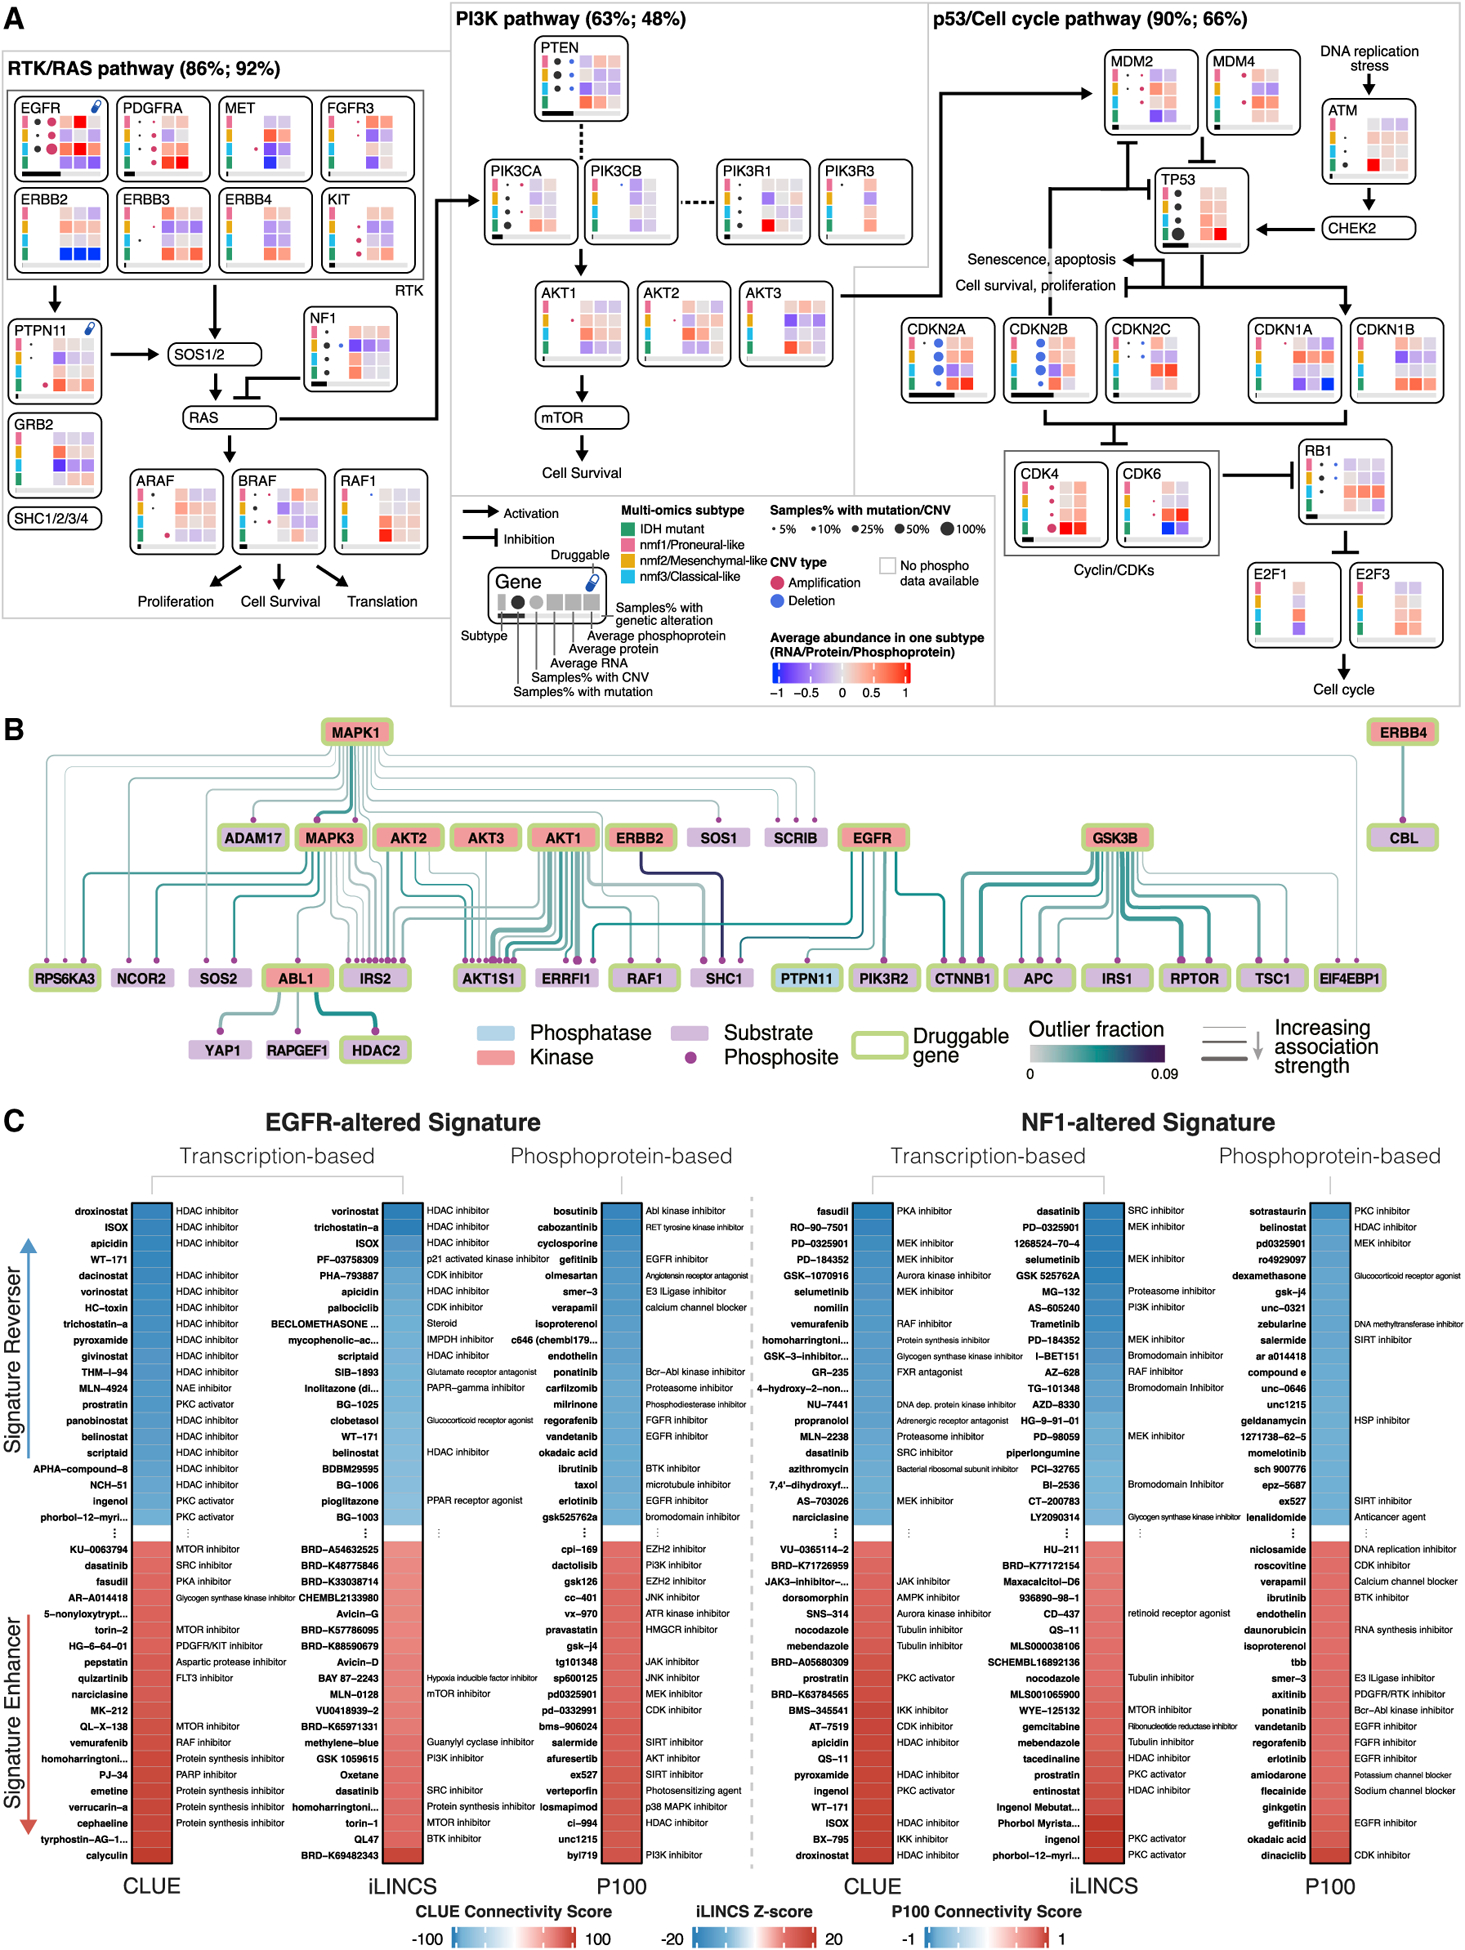
Glioblastoma (GBM) is the most aggressive nervous system cancer. Understanding its molecular pathogenesis is crucial to improving diagnosis and treatment. Integrated analysis of genomic, proteomic, post-translational modification and metabolomic data on 99 treatment-naive GBMs provides insights to GBM biology. We identify key phosphorylation events (e.g., phosphorylated PTPN11 and PLCG1) as potential switches mediating oncogenic pathway activation, as well as potential targets for EGFR-, TP53-, and RB1-altered tumors. Immune subtypes with distinct immune cell types are discovered using bulk omics methodologies, validated by snRNA-seq, and correlated with specific expression and histone acetylation patterns. Histone H2B acetylation in classical-like and immune-low GBM is driven largely by BRDs, CREBBP, and EP300. Integrated metabolomic and proteomic data identify specific lipid distributions across subtypes and distinct global metabolic changes in IDH-mutated tumors. This work highlights biological relationships that could contribute to stratification of GBM patients for more effective treatment.

Keywords: CPTAC; acetylome; glioblastoma; lipidome; metabolome; proteogenomics; proteomics; signaling; single nuclei RNA-seq.


Conflict of interest statement

Declaration of interests S.Y. is employed by Sema4. A.H.K. consults for Monteris Medical. P.W. is a statistical consultant for Sema4. M.G.C. receives research support from Orbus Therapeutics and NeoimmuneTech Inc, and royalties from UpToDate.

Figures

Figure 1.
Figure 1.. Proteogenomic summary of the cohort
(A) Summary of 10 data types generated in this study. (B) Overview of significantly altered genes found in at least 5% of samples, showing tumor mutation burden (log2 WES mutation count) and structural, fusion, and CNVs. Subtypes are based on results in panel (C). (C) Multi-omics clustering of tumor samples by NMF using CNV, expression, and protein and phosphoprotein abundances. Heatmaps show differential expression between subtypes, including DNA methylation, acetylome, metabolome, and lipidome, and characteristic features for each subtype. Pathway enrichment analysis highlights differences between subtypes. Neuron activity related pathways, immune response pathways, and cell cycle pathways were respectively enriched in the nmf1 (proneural-like), nmf2 (mesenchymal-like), and nmf3 (classical-like) subtypes. See also Figures S1 and S2, and Tables S1, S2, and S3.
Figure 2.
Figure 2.. Cis and trans effects of SMGs and effects of TP53 regulations on DNA repair genes and RB1 on cell cycle genes
(A) Cis and trans effects of significantly mutated genes on RNA (y axis) and protein level (x axis) showing that effects are often similar. (B) Cis and trans effects of significantly mutated genes (y axis) on protein phosphorylation status (x axis). (C) Comparison of RNA and protein expression in TP53-mutated versus WT samples. Bottom: alternative TP53 splice site for the X126 mutation. (D) Differentially expressed proteins and phosphoproteins in DNA repair genes for TP53-mutant (n = 67) versus TP53 WT (n = 32) samples. Right: a schematic of differences in expression and phosphorylation in the context of known pathway regulation. (E) RB1 alterations associated with protein expression of CDK2, CDK6, MCM2, MCM4, MCM6, and RB1. Right: A schematic of proposed interplay among RB1, MCM2, MCM4, and MCM6 in RB1-altered (n = 89) and WT (n = 10) samples. See also Figure S3.
Figure 3.
Figure 3.. Alterations in RTKs and associations with expression, phosphosite status, and downstream targets
(A) Structural variations (SV), fusions, mutations (MUT), and copy number variations (CNV) in EGFR, PDGFRA, FGFR3, and MET and their cis effects. (B) Proteins and phosphosites differentially expressed or phosphorylated between EGFR-altered and EGFR WT samples. (C) Proteomic association of altered EGFR (n = 53) on protein expression of key genes, compared to samples with EGFR WT (n = 46) (left). PTPN11 level is not affected by EGFR alterations, while phosphorylation of the Y62 site is increased in EGFR-altered samples (right). (D) Heatmap showing significant (FDR <0.1) cis- and trans-regulated sites of EGFR and PDGFRA kinases. Both EGFR and PDGFR regulate phosphorylation of PTPN11. The schematic (right) shows dual regulation of PTPN11 by EGFR and PDGFRA and the downstream substrates that PTPN11 may dephosphorylate. See also Figure S4.
Figure 4.
Figure 4.. Cell-type enrichment, immune marker expression, and enrichment pathways among the four immune subtypes
(A) The four immune subtypes identified by consensus clustering showing cell-type features, immune checkpoints, and potential immunotherapy targets. Differential expression is between tumors of one immune subtype versus the rest based on global protein and phosphoprotein abundance (DEPs/DEPPs: FDR <0.05 and log2FC > 0.8) and the corresponding enriched pathways (FDR <0.05 and log2FC R 3 markers included in the pathway). (B) snRNA-seq UMAP plot colored by cell types observed in 18 discovery cohort GBM samples. OPC, oligodendrocyte progenitor cells; TAM, tumor-associated microglia/macrophage; vSMC, vascular smooth muscle cell. (C) Differentially expressed genes in TAMs between im1 subtype samples versus the remaining cohort. Figure shows genes with absolute value of average log2FC > 0.25 and Wilcoxon test FDR-adjusted p values. (D) Features captured by the deep learning model. Each dot represents a tile of H&E slides in the test set, colored according to prediction score (red: predicted immune-high; blue: predicted immune-low). The 20,000 sampled tiles from 99 patients were clustered by t-SNE to their activation maps (a 1,250-long vector for each tile) from the final layer of the model. (E) H&E tile images from im4 tumors, with arrows indicating giant cells. The highlighted region contains multiple noncontinuous tiles clustered closely in t-SNE space. (F) H&E tile images from non-im4 tumors, with arrows indicating the inflammatory cells. The highlighted region contains multiple noncontinuous tiles clustered closely in t-SNE space. (G) Heatmaps showing snRNA-seq (left) and bulk protein (right) expression of genes upregulated in the nmf2 subtype in tumor cells. Expression values were scaled sample-wise across all cell types (or across tumor cells as labeled) and then averaged across multi-omics subtypes. Protein expression is shown for samples with snRNA-seq available. See also Figure S5 and Table S4.
Figure 5.
Figure 5.. Histone acetylation associations with immune subtypes and pathways
(A) Unsupervised clustering of histone protein and site-level acetylation reveals distinct clusters of tumors enriched for acetylation of histones H2B, H3, and H4. (B) Significant associations between histone acetylation sites and histone acetyltransferase, deacetylases, and bromodomain-containing proteins. (C) Pathways associated with levels of acetylation of histones H2B, H3, or H4 by multi-omics subtype. (D) Significant Spearman correlation between xCell scores and acetylation of histone sites (FDR <0.05). (E) SUMO1 and UBE2I protein expression across samples with high and low H2B acetylation. See also Figure S6.
Figure 6.
Figure 6.. Lipidome and metabolome data map to major metabolic and signaling pathways
(A) Average abundance of all lipids detected across the four tumor subtypes and GTEx normal samples. Lipids are sorted by total number of double-chain bonds and total number of carbons in side chains. (B) Lipid Mini-On enrichment analysis of lipid properties upregulated in subtype versus second subtype. (C) Contribution of enzymes that activate PUFAs (ACSL4 and ACSL6) to the phospholipid pool and the connection of PUFA-containing PE to ferroptosis. (D) Protein expression of ACSL6, ACSL4, and ALOX5 across tumor multi-omics subtypes and GTEx normal tissues. (E) Schematic diagram of lipid conversion reactions essential for cell signaling. (F) Correlation among DG, phosphatidic acid (PA), and phospholipases C (PLCs; cleaves PIP2 into DG and IP3), Akt kinases (interact with PIP3), protein kinases C (PKCs; interact with DG), and DG kinases (DGKs; phosphorylate DG to produce PA). (G) IDH1 mutants display elevated abundance of glucose, glycolytic intermediate metabolites, and 2-HG, along with reduced abundance of glutamate and serine. (H) GLUD1 protein expression is upregulated in IDH1 mutants in both discovery and validation cohorts. CE, Cholesteryl ester; CL, Cardiolipin; Cer, Ceramide; FA, Fatty acid; GP, Glycerophospholipid; Glc, Glucose; Glu, Glutamate; HexCer, Hexosylceramide; LCFA, Long chain fatty acid; LacCer, Lactosylceramides; MUFA, Monounsaturated fatty acid; OEA, Oleoylethanolamide; PCO, Phosphatidylcholine with an alkyl ether substituent; PCP, Phosphatidylcholine with a plasmalogen substituent; PEO, Phosphatidylethanolamine with an alkyl ether substituent. PEP (in panel A): Phosphatidylethanolamine with a plasmalogen substituent. PEP (G): Phosphoenolpyruvic acid. PI, Phosphatidylinositol; PIO, Phosphatidylinositol with an alkyl ether substituent; PIP, Phosphatidylinositol with a plasmalogen substituent; PLC, Phospholipase (C) Pyr, Pyruvic acid; SM, Sphingomyelin; SP, Sphingolipid; 3PG, 3-Phosphoglyceric acid. See also Figure S6.
Figure 7.
Figure 7.. Summary of pathway alterations and potential therapeutic targets
(A) Three oncogenic pathways frequently altered in GBM. Each gene is annotated with mutational and CNV frequency, RNA, protein, and phosphoprotein abundance, by multi-omics subtype. Horizontal bar below gene box indicates frequency of alteration across all tumors. Also indicated are the proportion of tumors with genetic alterations (first percentage) and protein and phosphoprotein outlier expression (second percentage) for each pathway. (B) Dysregulated phospho-signaling in RTK, PI3K, WNT, and NOTCH pathways across all tumors. Thickness of a kinase-substrate connecting line indicates degree to which variation in kinase phosphorylation explains observed variation in the substrate phosphosite abundance. Line color indicates percentage of samples with outlier phosphorylation. Kinases governing multiple substrates with substantial phosphorylation outliers may be potential therapeutic targets. (C) Drug connectivity analysis using alteration-specific transcriptional (CLUE and iLINCS) and phosphoproteomic (P100) signatures (altered tumors versus WT tumors). Twenty compounds that most strongly reverse or enhance the signature are highlighted along with their known mechanisms of action. See also Figure S7 and Tables S5 and S6.

References

    1. 1000 Genomes Project Consortium, Abecasis GR, Altshuler D, Auton A, Brooks LD, Durbin RM, Gibbs RA, Hurles ME, and McVean GA (2010). A map of human genome variation from population-scale sequencing. Nature 467, 1061–1073. - PMC - PubMed
    1. Anders S, Pyl PT, and Huber W (2015). HTSeq—a Python framework to work with high-throughput sequencing data. Bioinformatics 31, 166–169. - PMC - PubMed
    1. Aran D, Hu Z, and Butte AJ (2017). xCell: digitally portraying the tissue cellular heterogeneity landscape. Genome Biol. 18, 220. - PMC - PubMed
    1. Arlauckas SP, Garren SB, Garris CS, Kohler RH, Oh J, Pittet MJ, and Weissleder R (2018). Arg1 expression defines immunosuppressive subsets of tumor-associated macrophages. Theranostics 8, 5842–5854. - PMC - PubMed
    1. Babiceanu M, Qin F, Xie Z, Jia Y, Lopez K, Janus N, Facemire L, Kumar S, Pang Y, Qi Y, et al. (2016). Recurrent chimeric fusion RNAs in non-cancer tissues and cells. Nucleic Acids Res. 44, 2859–2872. - PMC - PubMed

Publication types

MeSH terms

Substances