. 2021:20:100004.
doi: 10.1074/mcp.RA120.002227. Epub 2020 Dec 3.

Peptidomics-Driven Strategy Reveals Peptides and Predicted Proteases Associated With Oral Cancer Prognosis

Affiliations

Peptidomics-Driven Strategy Reveals Peptides and Predicted Proteases Associated With Oral Cancer Prognosis

Leandro Xavier Neves et al. Mol Cell Proteomics. 2021.

Abstract

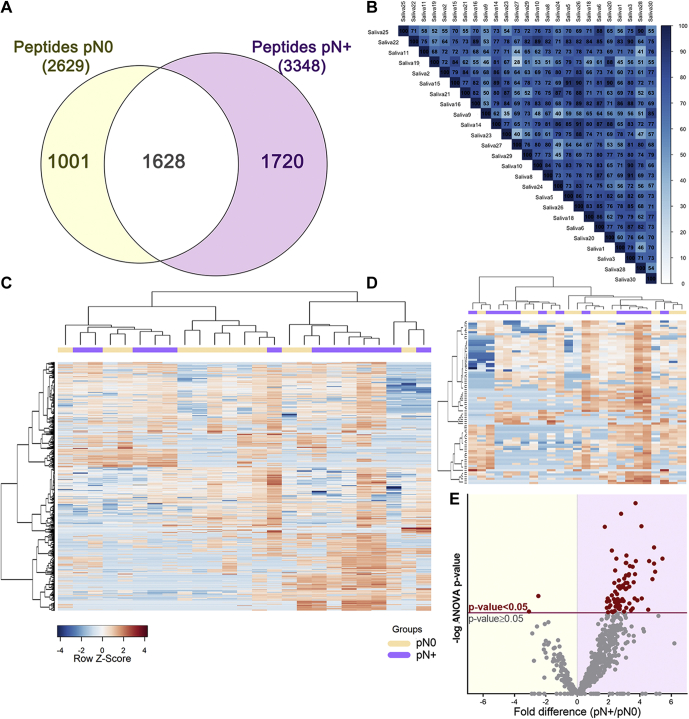
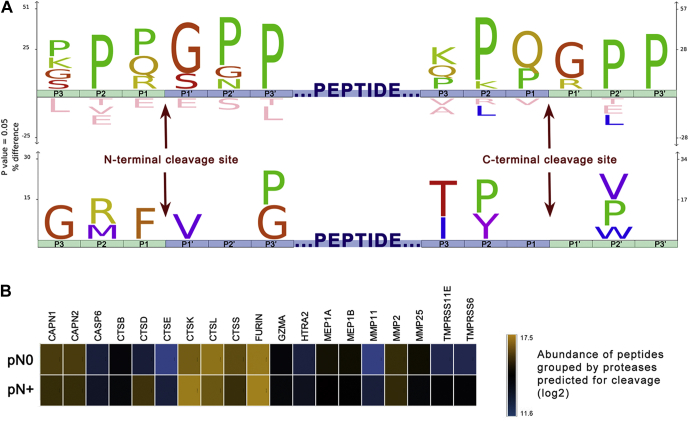
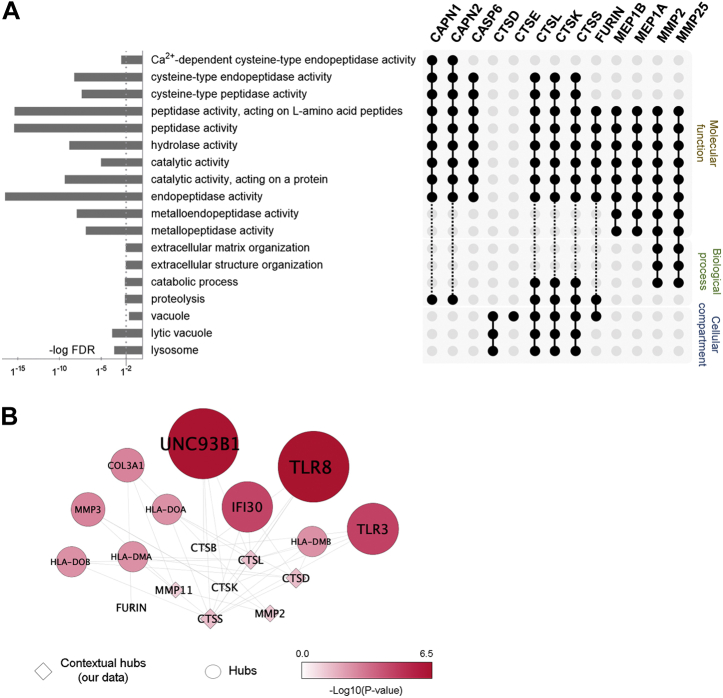
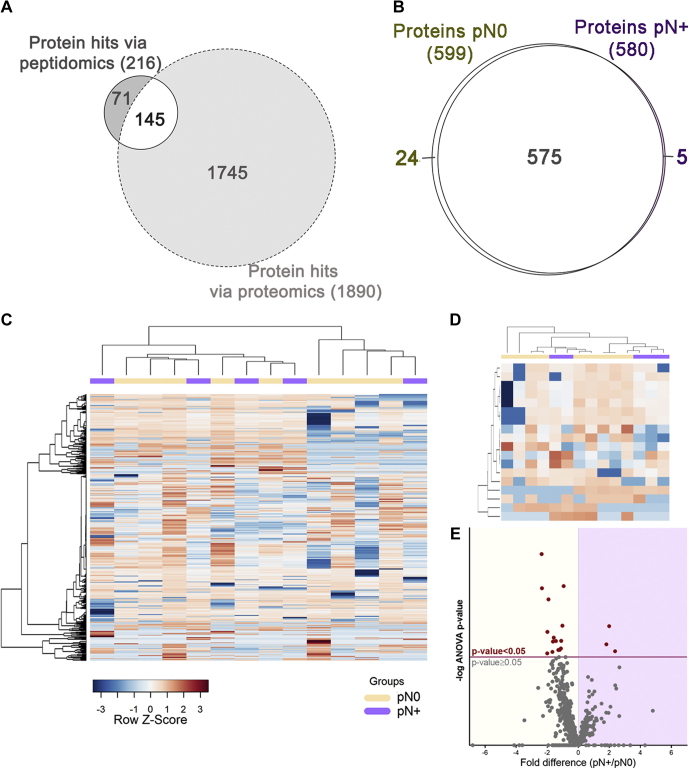
Protease activity has been associated with pathological processes that can lead to cancer development and progression. However, understanding the pathological unbalance in proteolysis is challenging because changes can occur simultaneously at protease, their inhibitor, and substrate levels. Here, we present a pipeline that combines peptidomics, proteomics, and peptidase predictions for studying proteolytic events in the saliva of 79 patients and their association with oral squamous cell carcinoma (OSCC) prognosis. Our findings revealed differences in the saliva peptidome of patients with (pN+) or without (pN0) lymph-node metastasis and delivered a panel of ten endogenous peptides correlated with poor prognostic factors plus five molecules able to classify pN0 and pN+ patients (area under the receiver operating characteristic curve > 0.85). In addition, endopeptidases and exopeptidases putatively implicated in the processing of differential peptides were investigated using cancer tissue gene expression data from public repositories, reinforcing their association with poorer survival rates and prognosis in oral cancer. The dynamics of the OSCC-related proteolysis were further explored via the proteomic profiling of saliva. This revealed that peptidase/endopeptidase inhibitors exhibited reduced levels in the saliva of pN+ patients, as confirmed by selected reaction monitoring-mass spectrometry, while minor changes were detected in the level of saliva proteases. Taken together, our results indicated that proteolytic activity is accentuated in the saliva of patients with OSCC and lymph-node metastasis and, at least in part, is modulated by reduced levels of salivary peptidase inhibitors. Therefore, this integrated pipeline provided better comprehension and discovery of molecular features with implications in the oral cancer metastasis prognosis.

Keywords: head and neck squamous cell carcinoma; peptidomics; proteolysis; saliva.


Conflict of interest statement

Conflict of interest The authors declare no competing interests.

Figures

None
Graphical abstract
Fig. 1
Fig. 1
Pipeline for characterization of saliva peptidome and proteome. A pool of saliva (n = 3) was first used to optimize the methodology for peptide recovery and analysis via LC-MS/MS. Briefly, peptide fractions were recovered by (i) saliva acidification with HCl (pH 2) followed by C18 solid-phase extraction (HCl-SPE) or (ii) 3-kDa ultrafiltration under denaturing conditions (4 M urea, 10-mM DTT) followed by C18 solid-phase extraction (UF-SPE) of the flow through. LC-MS/MS analysis of HCl-SPE and UF-SPE was performed by testing three variations of a 45-min acetonitrile gradient (M1, M2, and M3) for improved peptide separation. Saliva from patients with oral squamous carcinoma (OSCC) and with and without lymph-node metastasis pathologically confirmed, pN0 and pN+, respectively, were prepared using the HCl-SPE protocol. Tandem spectrum data acquired using an LTQ-Orbitrap Velos operating in Top20 DDA mode using CID activation were processed in PEAKS Studio X—using an unspecific digest mode—or MaxQuant, for peptidomic and proteomics analyses, respectively. Differential molecules between pN0 versus 'pN+ group comparison were submitted to correlation tests with prognostic factors, such as invasiveness, differentiation, and extracapsular extension. Differential protein and peptides were also tested as classifiers of pN0 and pN+ patients using ROC curves. Cleavage site analysis revealed potential proteases implicated in the breakdown of saliva proteins and correlated with prognosis. Complementary proteomics analysis uncovered regulatory mechanisms of saliva proteolysis via peptidase, enzymes, and inhibitors levels, finally verified via SRM-MS. DDA, data-dependent acquisition; GO, Gene Ontology; HCl-SPE, hydrochloric acid saliva treatment followed by solid-phase extraction of peptides; LC-MS/MS, liquid chromatography–tandem mass spectrometry; ROC, receiver operating characteristic; SRM-MS, selected reaction monitoring–mass spectrometry; UF-SPE, ultrafiltration of saliva followed by solid-phase extraction of peptides.
Fig. 2
Fig. 2
Optimization of the saliva peptidome extraction and LC-MS/MS analysis. Endogenous peptides recovered from saliva using either ultrafiltration (3-kDa MWCO; UF-SPE) or HCl acidification following C18 solid-phase extraction (HCl-SPE) were analyzed using three LC gradients (M1, M2, and M3) to achieve optimal chromatographic separation. A, samples prepared with the HCl-SPE extraction method had higher identification rates, particularly when the gradient M2 was used for resolving the peptidome. B, abundant range of peptides detected spanned over 5 to 6 orders of magnitude. C, the ultrafiltration-based method biased the analysis toward endogenous peptides <3 kDa while HCl-SPE extraction allowed the recovery of larger peptides. D, GRAVY values of peptides identified across the experimental conditions suggested that LC gradients played a major role in the identification of more hydrophobic peptides regardless of the extraction method used. Kruskal–Wallis with Dunn's tests indicated significant differences; ∗p-value < 0.05, ∗∗∗∗p-value < 0.0001. Box plot boundaries at 10th and 90th percentiles. GRAVY, grand average of hydropathy; HCl-SPE, hydrochloric acid saliva treatment followed by solid-phase extraction of peptides; LC-MS/MS, liquid chromatography–tandem mass spectrometry; MWCO, molecular weight cut-off; UF-SPE, ultrafiltration of saliva followed by solid-phase extraction of peptides.
Fig. 3
Fig. 3
Composition analysis of the saliva peptidome from pN0 and pN+ OSCC patients.A, qualitative analysis reveals a significant number of group-specific peptide matches and <40% overlap between pN0 and pN+ patients. B, the correlogram of the 25 LC-MS runs saliva peptidome showing Pearson's R ranging from 0.5 to 0.9. C, the heat map of the whole saliva peptidomes and (D) differentially abundant peptides (ANOVA p-value ≤ 0.05) show no clear grouping of samples based on a single classifier feature such as lymph node metastasis (N+/N0). Hierarchical clustering was performed using the Pearson's correlation and Ward's method. E, differential distribution of peptides quantified in pN0 and pN+ samples represented on a volcano plot. Peptides above the significance threshold (ANOVA p-value ≤ 0.05) are highlighted as red dots.
Fig. 4
Fig. 4
Correlation of differential peptides with OSCC prognostic factors.A, ten differentially abundant peptides, with increased levels in pN+ saliva, were correlated with prognostic features such as perineural invasion, nodal metastasis, and extracapsular extension. Significance defined as ANOVA p-value ≤ 0.05 (∗), 0.01 (∗∗); minimum correlation coefficient +0.7/−0.7; multiple R2 > 0.5. B, in addition, top ranking peptides detected across >85% of samples were able to distinguish pN0 and pN+ patients with AUC-ROC > 0.7 calculated using logistic regression and random forest analysis. Once combined, these peptides performed better as classifiers, achieving an AUC-ROC > 0.85 by binary regression. AUC-ROC, area under the receiver operating characteristic curve; OSCC, oral squamous carcinoma.
Fig. 5
Fig. 5
Cleavage site analysis of differentially abundant peptides and prediction of active proteases.A IceLogo and heat map indicating position-specific amino acid residues under-represented and over-represented in the putative cleavage site of endogenous peptides. Three N- and C-terminal residues (depicted by green blocks) were derived from human protein sequences to reconstruct the putative sites cleaved (P1-P1ʹ) for releasing the differential endogenous peptides (represented by the central blue block). To minimize compositional bias toward the proline occurrence evidenced on the upper diagram, salivary proline-rich proteins (P04280-PRB1, Q04118-PRB3, P02812-PRB2, P10163-PRB4, P02814-SMR3B) were excluded in a second analysis (bottom diagram). B, LFQ abundances of differential peptides predicted as substrates of 19 proteases using Proteasix is illustrated as the heat map. Notably, proteolytic products of cathepsins K, L, and S, furin, and calpains are among the most abundant endogenous peptides. In addition, the levels of cleavage products resulting of cathepsin D (CSTD) activity exhibited higher intensities in pN+ saliva than in that of pN0.
Fig. 6
Fig. 6
Functional characterization of predicted proteases implicated in the processing of differential peptides.A, GO enrichment analysis of the predicted proteases showed a major contribution of lysosomal and vacuole cathepsins. Together, CTSL, CTSK, CTSS, CAPN1, CAPN2, and CASP6 exhibit cysteine-type peptidase activity, and membrane metalloproteinases (MMP2 and MMP25) are mostly involved in structural organization of the extracellular matrix via proteolysis. B, network analysis highlighted that predicted cathepsins and membrane metalloproteases are linked to immunity via Toll-like receptors and antigen presentation. Interaction hub of predicted proteases (squares) and their top ten interactors (circles); significance threshold p-value was < 0.05. GO, Gene Ontology.
Fig. 7
Fig. 7
Composition of the saliva proteome from pN0 and pN+ OSCC patients.A, the Venn diagram of saliva proteins exclusive or commonly identified on peptidomics and proteomics approaches. B, qualitative analysis reveals a major overlap between N0 and N+ saliva proteomes. C, the heat map of the whole saliva proteome and (D) differentially abundant proteins (ANOVA p-value ≤ 0.05) show no clear grouping of samples based on a single classifier feature like lymph-node metastasis (N+/N0). Hierarchical clustering was performed using the Pearson's correlation and Ward's method. E, differential distribution of proteins quantified in pN0 and pN+ samples represented on a volcano plot. Proteins above the significance threshold (ANOVA p-value ≤ 0.05) are highlighted as red dots.
Fig. 8
Fig. 8
Functional analysis of differentially abundant proteins and ROC curves.A, ROC curves of top-ranking peptides detected across >85% of samples exhibited AUC-ROC > 0.8, calculated using logistic regression and random forest analysis. B, GO analysis performed by Enrichr highlights peptidase inhibitory activity and immune-related processes among differentially abundant proteins in saliva. C, quantitative profiles showed a −0.8-fold (log2) reduction on average abundance of peptidase inhibitors in pN+ saliva. Differences on LCN1, ITIH2, SPINK5, and AHSG protein levels were statistically significant (ANOVA p-value ≤ 0.05; red bar). On the other hand, average differences in protease levels were less pronounced (−0.2-fold log2 pN+/pN0) with a single peptidase - NPEPPS, puromycin-sensitive amino peptidase - differentially abundant (ANOVA p-value ≤ 0.05; red bar). Predicted proteases implicated in the processing of differential endogenous peptides are indicated by golden bars. AUC-ROC, area under the receiver operating characteristic curve; GO, Gene Ontology.
Fig. 9
Fig. 9
Exploratory SRM-MS analysis of protease inhibitor levels in saliva.A, levels of AHSG inferred by FSVVYAK peptide across an independent 40-patient cohort. AHSG was significantly reduced in N+ saliva, with minor intragroup variation (nested ANOVA, p-value = 0.0215) and significant difference on group medians (Mann–Whitney, p-value = 0.0019). B, saliva levels of SPINK5 inferred via FFFQSLDGIMFINK peptide exhibited a higher intragroup variation affecting the confirmation of group differences (Mann–Whitney, p-value > 0.05). AHSG, alpha-2-HS-glycoprotein (fetuin A); SPINK5, serine protease inhibitor Kazal-type 5; SRM-MS, selected reaction monitoring–mass spectrometry. ANOVA p-value > 0.05 (ns), ≤0.05 (∗), ≤0.01 (∗∗).

References

    1. Doucet A., Butler G.S., Rodríguez D., Prudova A., Overall C.M. Metadegradomics. Mol. Cell. Proteomics. 2008;7:1925–1951. - PubMed
    1. Chang C., Werb Z. The many faces of metalloproteases: cell growth, invasion, angiogenesis and metastasis. Trends Cell Biol. 2001;11:S37–S43. - PMC - PubMed
    1. Mason S.D., Joyce J.A. Proteolytic networks in cancer. Trends Cell Biol. 2011;21:228–237. - PMC - PubMed
    1. Sevenich L., Joyce J.A. Pericellular proteolysis in cancer. Genes Dev. 2014;28:2331–2347. - PMC - PubMed
    1. Deng Z., Li Y., Fan J., Wang G., Li Y., Zhang Y., Cai G., Shen H., Ferrari M., Hu T.Y. Circulating peptidome to indicate the tumor-resident proteolysis. Sci. Rep. 2015;5:9327. - PMC - PubMed

Publication types