

Comprehensive Characterization of Bile Acids in Human Biological Samples and Effect of 4-Week Strawberry Intake on Bile Acid Composition in Human Plasma
- PMID: 33578858
- PMCID: PMC7916557
- DOI: 10.3390/metabo11020099
Comprehensive Characterization of Bile Acids in Human Biological Samples and Effect of 4-Week Strawberry Intake on Bile Acid Composition in Human Plasma
Abstract
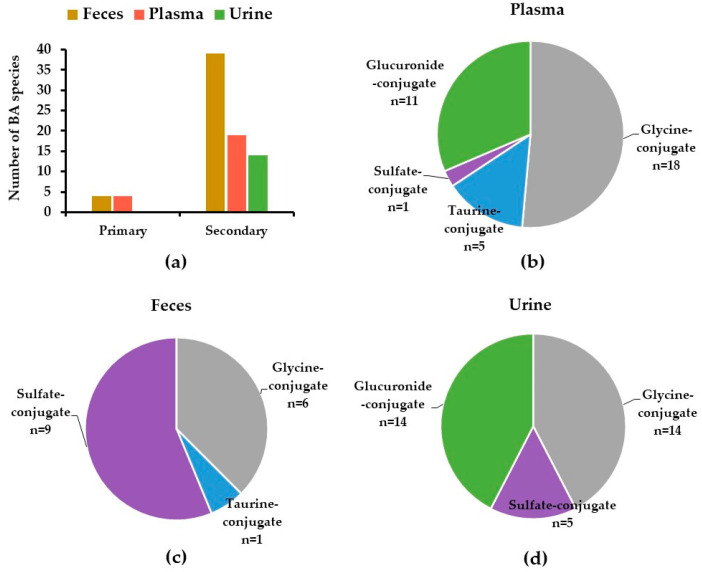
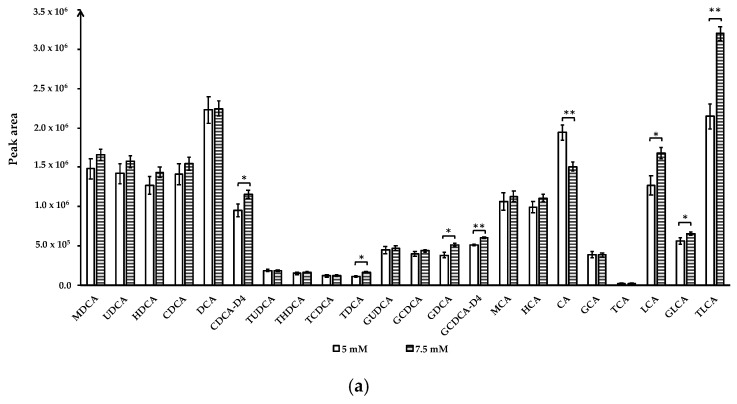
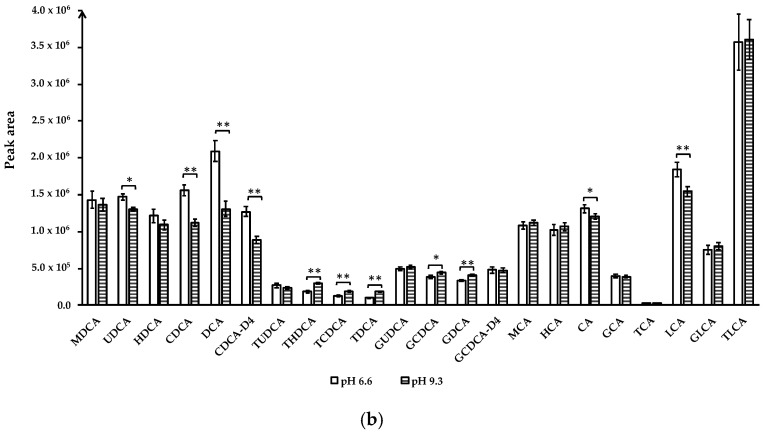
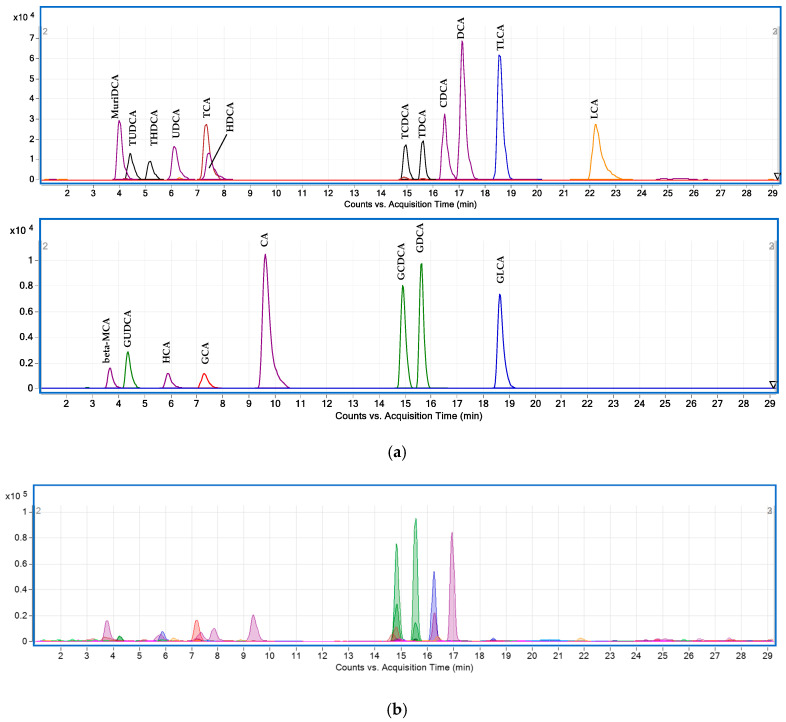
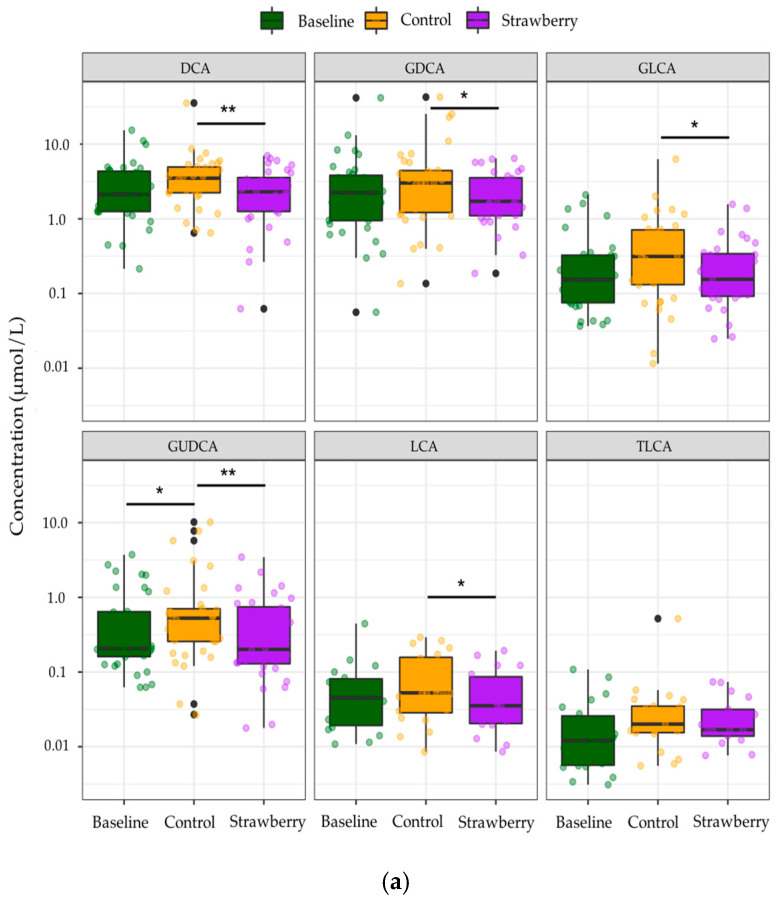
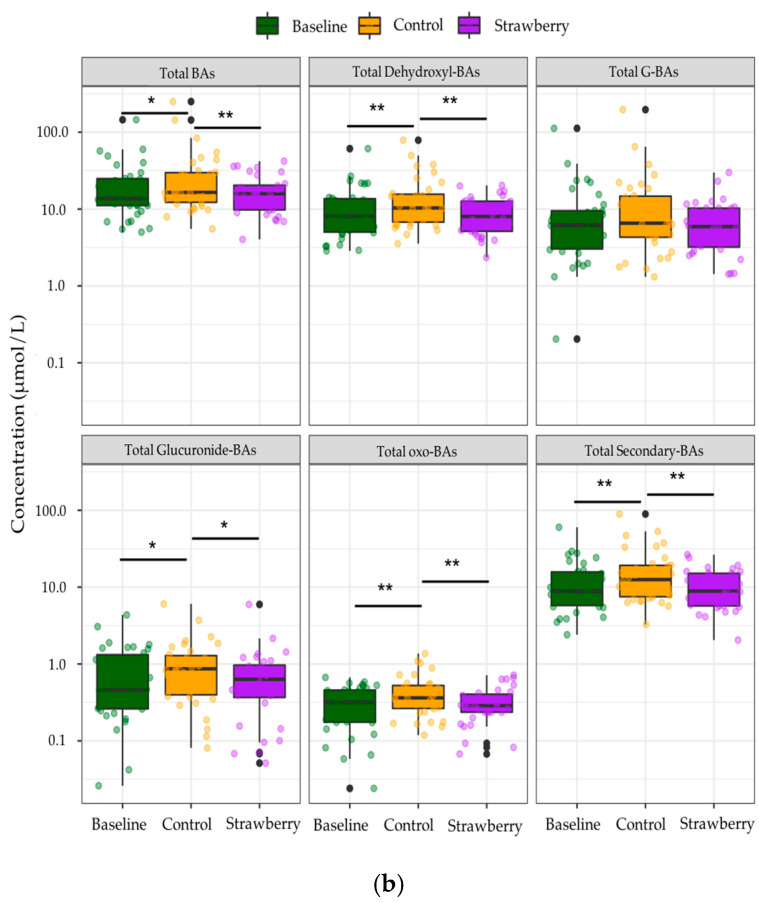
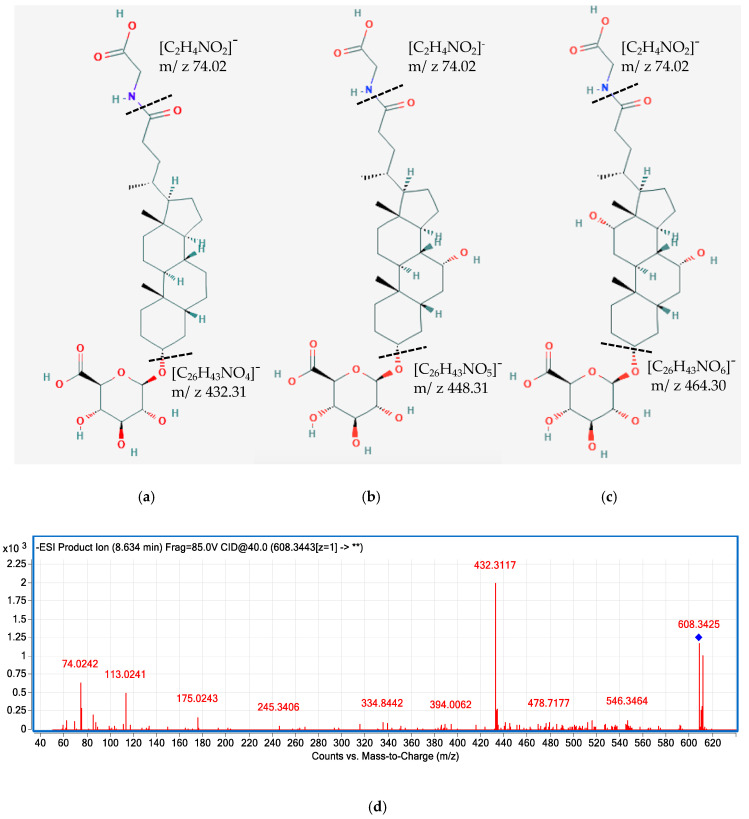
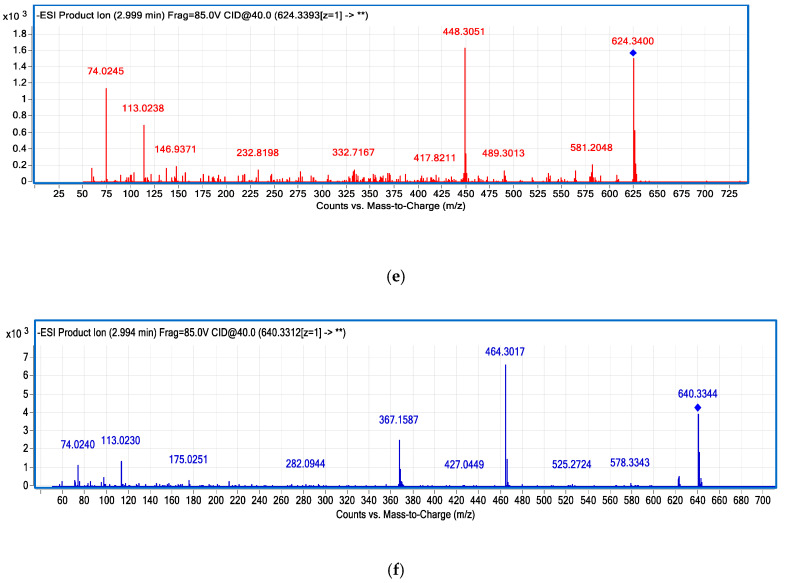
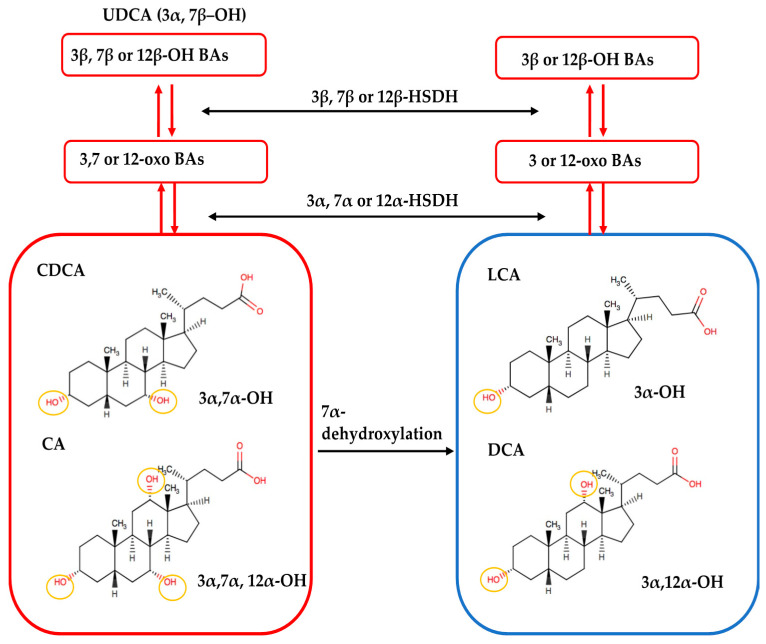
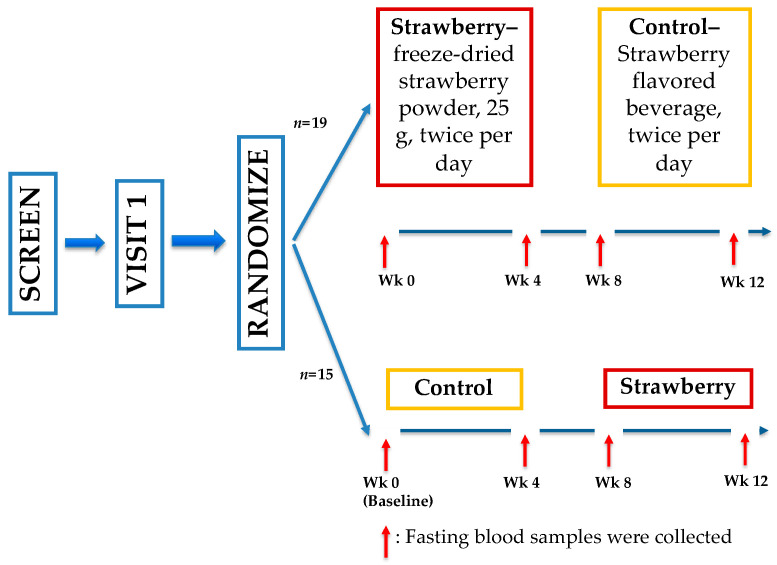
Primary bile acids (BAs) and their gut microbial metabolites have a role in regulating human health. Comprehensive characterization of BAs species in human biological samples will aid in understanding the interaction between diet, gut microbiota, and bile acid metabolism. Therefore, we developed a qualitative method using ultra-high performance liquid chromatography (UHPLC) coupled with a quadrupole time-of-flight (Q-TOF) to identify BAs in human plasma, feces, and urine samples. A quantitative method was developed using UHPLC coupled with triple quadrupole (QQQ) and applied to a previous clinical trial conducted by our group to understand the bile acid metabolism in overweight/obese middle-aged adults (n = 34) after four weeks strawberry vs. control intervention. The qualitative study tentatively identified a total of 81 BAs in human biological samples. Several BA glucuronide-conjugates were characterized for the first time in human plasma and/or urine samples. The four-week strawberry intervention significantly reduced plasma concentrations of individual secondary BAs, deoxycholic acid, lithocholic acid and their glycine conjugates, as well as glycoursodeoxycholic acid compared to control (p < 0.05); total glucuronide-, total oxidized-, total dehydroxyl-, total secondary, and total plasma BAs were also lowered compared to control (p < 0.05). The reduced secondary BAs concentrations suggest that regular strawberry intake modulates the microbial metabolism of BAs.
Keywords: UHPLC-Q-TOF; UHPLC-QQQ; bile acid; feces; human; microbial metabolites; plasma; polyphenols; strawberry; urine.
Conflict of interest statement
The authors declare no conflict of interest.
Figures
Similar articles
-
Fast profiling of primary, secondary, conjugated, and sulfated bile acids in human urine and murine feces samples.Anal Bioanal Chem. 2023 Aug;415(20):4961-4971. doi: 10.1007/s00216-023-04802-8. Epub 2023 Jun 20. Anal Bioanal Chem. 2023. PMID: 37338567
-
Pegbelfermin selectively reduces secondary bile acid concentrations in patients with non-alcoholic steatohepatitis.JHEP Rep. 2021 Nov 12;4(1):100392. doi: 10.1016/j.jhepr.2021.100392. eCollection 2022 Jan. JHEP Rep. 2021. PMID: 34977519 Free PMC article.
-
The profile of bile acids and their sulfate metabolites in human urine and serum.J Chromatogr B Analyt Technol Biomed Life Sci. 2013 Dec 30;942-943:53-62. doi: 10.1016/j.jchromb.2013.10.019. Epub 2013 Oct 22. J Chromatogr B Analyt Technol Biomed Life Sci. 2013. PMID: 24212143
-
Bile Acid and Gut Microbiota in Irritable Bowel Syndrome.J Neurogastroenterol Motil. 2022 Oct 30;28(4):549-561. doi: 10.5056/jnm22129. J Neurogastroenterol Motil. 2022. PMID: 36250362 Free PMC article. Review.
-
Gut microbiota derived bile acid metabolites maintain the homeostasis of gut and systemic immunity.Front Immunol. 2023 May 15;14:1127743. doi: 10.3389/fimmu.2023.1127743. eCollection 2023. Front Immunol. 2023. PMID: 37256134 Free PMC article. Review.
Cited by
-
Revisiting multi-omics-based predictors of the plasma triglyceride response to an omega-3 fatty acid supplementation.Front Nutr. 2024 Feb 13;11:1327863. doi: 10.3389/fnut.2024.1327863. eCollection 2024. Front Nutr. 2024. PMID: 38414488 Free PMC article.
-
Lithocholic acid phenocopies anti-ageing effects of calorie restriction.Nature. 2025 Jul;643(8070):192-200. doi: 10.1038/s41586-024-08329-5. Epub 2024 Dec 18. Nature. 2025. PMID: 39695227 Free PMC article.
-
Bile acid metabolism and signaling: Emerging pharmacological targets of dietary polyphenols.Pharmacol Ther. 2023 Aug;248:108457. doi: 10.1016/j.pharmthera.2023.108457. Epub 2023 Jun 1. Pharmacol Ther. 2023. PMID: 37268113 Free PMC article. Review.
-
Nucleated red blood cell distribution in critically ill patients with acute pancreatitis: a retrospective cohort study.BMC Gastroenterol. 2024 Oct 7;24(1):353. doi: 10.1186/s12876-024-03444-z. BMC Gastroenterol. 2024. PMID: 39375618 Free PMC article.
-
Impact of Blueberry Consumption on the Human Fecal Bileacidome: A Pilot Study of Bile Acid Modulation by Freeze-Dried Blueberry.Nutrients. 2022 Sep 17;14(18):3857. doi: 10.3390/nu14183857. Nutrients. 2022. PMID: 36145234 Free PMC article.
References
Grants and funding
LinkOut - more resources
Full Text Sources
Other Literature Sources
