. 2021 Feb 12;22(1):68.
doi: 10.1186/s12859-021-03969-0.

CHICKN: extraction of peptide chromatographic elution profiles from large scale mass spectrometry data by means of Wasserstein compressive hierarchical cluster analysis

Affiliations

CHICKN: extraction of peptide chromatographic elution profiles from large scale mass spectrometry data by means of Wasserstein compressive hierarchical cluster analysis

Olga Permiakova et al. BMC Bioinformatics. .

Abstract

Background: The clustering of data produced by liquid chromatography coupled to mass spectrometry analyses (LC-MS data) has recently gained interest to extract meaningful chemical or biological patterns. However, recent instrumental pipelines deliver data which size, dimensionality and expected number of clusters are too large to be processed by classical machine learning algorithms, so that most of the state-of-the-art relies on single pass linkage-based algorithms.

Results: We propose a clustering algorithm that solves the powerful but computationally demanding kernel k-means objective function in a scalable way. As a result, it can process LC-MS data in an acceptable time on a multicore machine. To do so, we combine three essential features: a compressive data representation, Nyström approximation and a hierarchical strategy. In addition, we propose new kernels based on optimal transport, which interprets as intuitive similarity measures between chromatographic elution profiles.

Conclusions: Our method, referred to as CHICKN, is evaluated on proteomics data produced in our lab, as well as on benchmark data coming from the literature. From a computational viewpoint, it is particularly efficient on raw LC-MS data. From a data analysis viewpoint, it provides clusters which differ from those resulting from state-of-the-art methods, while achieving similar performances. This highlights the complementarity of differently principle algorithms to extract the best from complex LC-MS data.

Keywords: Large-scale cluster analysis; Liquid chromatography; Mass spectrometry; Optimal transport; Proteomics; Wasserstein kernel.


Conflict of interest statement

The authors declare that they have no competing interests.

Figures
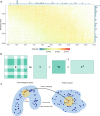
Fig. 1
Fig. 1
Data matrix, Nyström approximation and pre-image illustrations. a Ecoli-DIA data matrix. Each matrix column corresponds to a chromatographic profile for a fixed m/z value. Maximum Intensity for columns and for rows is depicted in bar plots. b Nyström kernel approximation. The matrix C represents the similarity between each data point and the random sample. The matrix W corresponds to the pairwise similarity evaluation between selected data points. c Pre-image problem. Consensus chromatogram construction amounts to solve a pre-image problem, i.e. to map the feature space (right) back to the space of chromatograms (left). Blue points depict the elution profiles (left) and their images in the feature space (right). The red points are the cluster centroid (right) and the corresponding consensus chromatogram (left). The yellow circles represent the cluster centroid and consensus chromatogram neighborhoods. Due to the mapping non-linearity, the mean chromatogram may lie outside the cluster, while the correct consensus chromatogram should belong to it
Fig. 2
Fig. 2
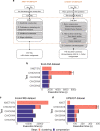
Xnet and CHICKN comparison. a The method workflows. To allow for fair comparisons, we have focused on the core algorithms, depicted within the dotted rectangle. bd The execution time comparison for Ecoli and for the UPS2GT datasets. The CHICKN execution time is decomposed into the data compression time (blue) and the clustering time (pink). Note that XNet had to be run on 5% of the Ecoli-DIA dataset and 10% of the Ecoli-FMS dataset only, to avoid “out of memory” issues. The experiments on Ecoli-DIA were performed on a laptop, while other datasets were processed with a multi-core machine
Fig. 3
Fig. 3
Distance metrics for chromatographic data analysis. Comparison of Wasserstein-1, Euclidean and RT difference distances on real chromatographic profiles from the Ecoli-FMS dataset
Fig. 4
Fig. 4
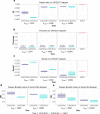
Statistical result analysis. a Rand index, b Precision, c Recall and de DB index depending on the k and ktotal parameters; CHICKN2 and CHICKN4 tests are depicted in purple and light blue respectively; For the UPS2GT dataset, additional comparisons with Xnet (in red) are provided
Fig. 5
Fig. 5
Xnet and CHICKN clusters for UPS2GT dataset. Each of the four lines represent a series of chromatograms in the context of their Xnet and CHICKN Cluster. On the plot of the leftmost column, a series of chromatograms with similar shapes are represented in different colors (2 or 3) according to the distinct Xnet clusters they belong to. In the second column, each elution profile is represented with the same color, according to its m/z position, hereby illustrating that Xnet clusters similar signals in different clusters because of a too large m/z difference. The plot of the third column represents the CHICKN cluster which encompasses all the Xnets cluster profiles of the leftmost column (in green), as well as other signals (in gray) falling in the same CHICKN cluster, hereby illustrating CHICKN builds meaningful patterns irrespective of the m/z information that is essential to isotopic envelope construction. In the rightmost column, the m/z positions of the signals of the third columns, depicited with the same color code
Fig. 6
Fig. 6
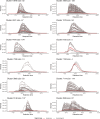
Examples of well-formed clusters for the Ecoli-FMS dataset. 12 clusters proposed by CHICKN (represented as time series), where each chromatogram is represented in gray, and where the consensus chromatogram is represented in red. The numbers above each example indicate the cluster ID and the number of chromatograms it encompasses

References

    1. Teleman J, Dowsey AW, Gonzalez-Galarza FF, Perkins S, Pratt B, Röst HL, et al. Numerical compression schemes for proteomics mass spectrometry data. Mol Cell Proteomics. 2014;13(6):1537–42. doi: 10.1074/mcp.O114.037879. - DOI - PMC - PubMed
    1. Klaus B, Strimmer K. Signal identification for rare and weak features: Higher criticism or false discovery rates? Biostatistics. 2013;14(1):129–43. doi: 10.1093/biostatistics/kxs030. - DOI - PubMed
    1. Tabb DL, MacCoss MJ, Wu CC, Anderson SD, Yates JR. Similarity among tandem mass spectra from proteomic experiments: Detection, significance, and utility. Anal Chem. 2003;75(10):2470–7. doi: 10.1021/ac026424o. - DOI - PubMed
    1. Tabb DL, Thompson MR, Khalsa-Moyers G, VerBerkmoes NC, McDonald WH. MS2Grouper: Group assessment and synthetic replacement of duplicate proteomic tandem mass spectra. J Am Soc Mass Spectrom. 2005;16(8):1250–61. doi: 10.1016/j.jasms.2005.04.010. - DOI - PubMed
    1. Beer I, Barnea E, Ziv T, Admon A. Improving large-scale proteomics by clustering of mass spectrometry data. Proteomics. 2004;4(4):950–60. doi: 10.1002/pmic.200300652. - DOI - PubMed