. 2021 Jun:42:101883.
doi: 10.1016/j.redox.2021.101883. Epub 2021 Jan 29.

Retinal oxidative stress activates the NRF2/ARE pathway: An early endogenous protective response to ocular hypertension

Affiliations

Retinal oxidative stress activates the NRF2/ARE pathway: An early endogenous protective response to ocular hypertension

Sarah Naguib et al. Redox Biol. 2021 Jun.

Abstract

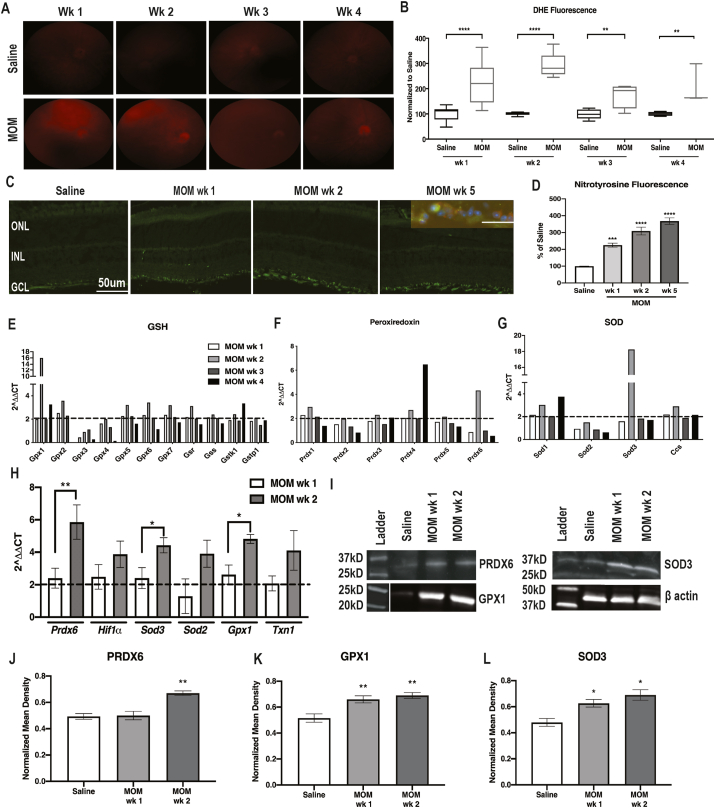
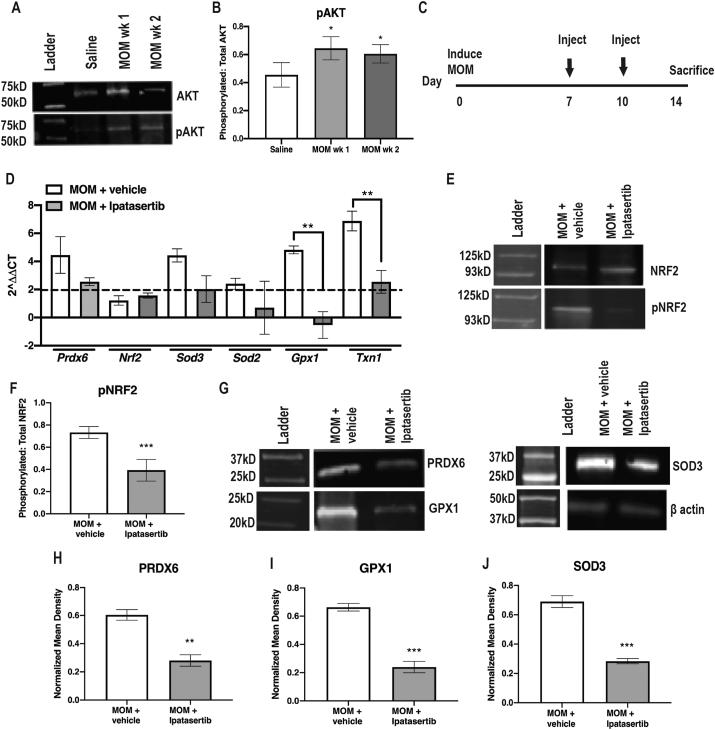
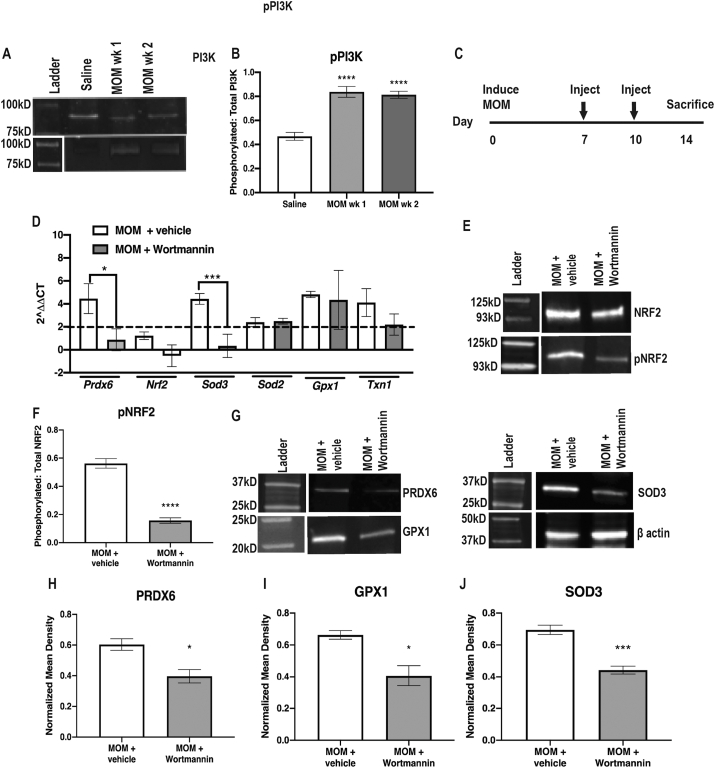
Oxidative stress contributes to degeneration of retinal ganglion cells and their axons in glaucoma, a leading cause of irreversible blindness worldwide, through sensitivity to intraocular pressure (IOP). Here, we investigated early elevations in reactive oxygen species (ROS) and a role for the NRF2-KEAP1-ARE endogenous antioxidant response pathway using microbead occlusion to elevate IOP in mice. ROS levels peaked in the retina at 1- and 2-wks following IOP elevation and remained elevated out to 5-wks. Phosphorylation of NRF2 and antioxidant gene transcription and protein levels increased concomitantly at 2-wks after IOP elevation, along with phosphorylation of PI3K and AKT. Inhibiting PI3K or AKT signaling prevented NRF2 phosphorylation and reduced transcription of antioxidant-regulated genes. Ocular hypertensive mice lacking Nrf2 had elevated ROS and a diminished increase in antioxidant gene expression. They also exhibited earlier axon degeneration and loss of visual function. In conclusion, the NRF2-KEAP1-ARE pathway is endogenously activated early in ocular hypertension due to phosphorylation of NRF2 by the PI3K/AKT pathway and serves to slow the onset of axon degeneration and vision loss in glaucoma. These data suggest that exogenous activation of this pathway might further slow glaucomatous neurodegeneration.

Keywords: Antioxidant response element; Glaucoma; Nrf2; Optic nerve; Oxidative stress; Retinal ganglion cell.


Conflict of interest statement

None.

Figures

Image 1
Graphical abstract
Fig. 1
Fig. 1
Visual function and optic nerve structure at 2- and 5-weeks post-IOP elevation. A) IOP levels over time, arrow indicates re-injection of microbeads, *p < 0.05. B) Representative VEP N1 waveforms, showing decreased amplitude in 5wk MOM-injected mice. C) Quantification of VEP N1 amplitude, ***p < 0.001. D) Representative micrographs of optic nerves, insets show higher magnification. Scale bar applies to all insets. Arrows indicate degenerative axons. E) Quantification of total axons in the optic nerves, showing a decrease only at 5 wk post-IOP elevation, p < 0.01. F) Quantification of number of degenerative axons, showing an increase at 5 wks, *p < 0.05. G) Representative waveforms of photopic negative response (PhNR) amplitude in saline and 2-week post-IOP elevation mice. H) and I) Quantification of the PhNR amplitude and latency, showing decreases in amplitudes at both timepoints and an increase in latency at 5-wks, *p < 0.05, ****p < 0.0001.
Fig. 2
Fig. 2
ROS and antioxidant proteins increased at 1-wk and 2-wks post-IOP elevation. A) Representative fundus images of DHE fluorescence in all groups. B) Quantification of DHE fluorescence at 1–4 wks post-IOP elevation in comparison to saline-injected controls, showing increases in the microbead injected mice at all time points, **p < 0.001, ****p < 0.0001. C) Fluorescence micrographs of retinas labeled with DAPI (blue) and nitrotyrosine (green). Inset shows double-labeling with anti-nitrotyrosine (green) and anti-NeuN (red). D) Quantification of nitrotyrosine immunofluorescence showing increases at all timepoints after IOP elevation, ***p < 0.001, ****p < 0.0001. E-G) Quantification of fold changes in PCR microarray for: E) GSH-related genes; F) Peroxiredoxin-related genes; and G) SOD-related genes. Dotted line indicates threshold for increase compared to saline. H) Confirmatory qPCR for fold change over saline in antioxidant gene transcription, *p < 0.05, **p < 0.01. I) Representative western blots for β-actin, PRDX6, SOD3 and GPX1. J-L) Quantification of PRDX6, SOD3 and GPX1, respectively, after normalization to β-actin, *p < 0.05, **p < 0.001. (For interpretation of the references to color in this figure legend, the reader is referred to the Web version of this article.)
Fig. 3
Fig. 3
Nrf2 activation following ocular hypertension. A) Quantification of Nrf2 mRNA. B) Representative western blots of NRF2. C) Quantification of NRF2 Western blot after normalization to β-actin. D) Representative western blots for total and phosphorylated NRF2. E) Quantification of pNRF2 after normalization to total NRF2, ****p < 0.00001. F) Representative KEAP-1 western blots with or without immunoprecipitation of NRF2. G, H) Quantification of total KEAP-1. I) Quantification of KEAP-1 that immunoprecipitated with NRF2, *p < 0.05, **p < 0.001, ****p < 0.00001.
Fig. 4
Fig. 4
AKT-dependent NRF2 phosphorylation. A) Representative western blots of AKT and pAKT B) Quantification of pAKT to total AKT, *p < 0.05. C) Experiment timeline. D) Representative Western blot of phosphorylated NRF2 to total NRF2. E) Quantification of pNRF2 to total NRF2, ***p < 0.0001. F) Quantification of antioxidant gene transcription shown as fold change over saline, **p < 0.001. G) Representative western blots for β-actin, PRDX6, SOD3 and GPX1. H-J) Quantification of PRDX6, GPX1 and SOD3, respectively, after normalization to β-actin, **p < 0.001, ***p < 0.0001.
Fig. 5
Fig. 5
PI3K-dependent NRF2 phosphorylation. A) Representative western blots of PI3K and pPI3K B) Quantification of pPI3K to total PI3K, ****p < 0.00001. C) Experiment timeline. D) Representative western blots of pNRF2 to total NRF2. E) Quantification of pNRF2 to total NRF2, ****p < 0.00001. F) Quantification of antioxidant gene transcription shown as fold change over saline, *p < 0.05, ***p < 0.0001. G) Representative western blots for β-actin, PRDX6, SOD3 and GPX1. H-J) Quantification of PRDX6, GPX1 and SOD3, respectively, after normalization to β-actin, *p < 0.05, ***p < 0.0001.
Fig. 6
Fig. 6
Decreased antioxidants and increased ROS, axon degeneration, and visual function deficits in ocular hypertensive Nrf2 KO mice. A) Representative fundus images of DHE fluorescence in saline and microbead-injected wildtype and Nrf2 KO mice. B) Quantification of DHE fluorescence at 2-wks post-IOP elevation in both strains of mice. C) Quantification of antioxidant gene transcription shown as fold change over respective saline groups, *p < 0.05, **p < 0.001, ***p < 0.0001. D) Representative western blots for β-actin, PRDX6, SOD3 and GPX1. E-G) Quantification of PRDX6, GPX1 and SOD3, respectively, after normalization to β-actin, **p < 0.001. H) Representative micrographs of wildtype and Nrf2 KO optic nerves at 2-wks post-IOP elevation. Scale bar applies to all micrographs. Arrows indicate degenerative axons. I) Quantification of total axons in the optic nerves, showing a decrease only in ocular hypertensive Nrf2 KO mice, **p < 0.001. J) Quantification of number of degenerative axons, showing an increase in ocular hypertensive Nrf2 KO mice, ***p < 0.0001. K) Quantification of the N1 amplitude of the VEP. L) Quantification of the PhNR amplitude. Note: all wild-type data shown in this Figure was copied from Fig. 2 for purposes of comparison.
Fig. 7
Fig. 7
Assessment of possible compensatory pathways. A) Representative western blots of HIF-1α, NQO-1, HO-1 and β-actin. B - D) Quantification of HIF-1α, NQO-1 and HO-1 western blots, respectively, after normalization to β-actin. HIF-1α was increased in both Nrf2 KO groups in comparison to wildtypes suggesting a compensatory response to the lack of NRF2. Both NQO-1 and HO-1 were decreased in both Nrf2 KO groups in comparison to wildtypes.

References

    1. Berkowitz B.A., Podolsky R.H., Lenning J., Khetarpal N., Tran C., Wu Sodium iodate produces a strain-dependent retinal oxidative stress response measured in vivo using QUEST MRI. Invest. Ophthalmol. Vis. Sci. 2017;58(7):3286–3293. doi: 10.1167/iovs.17-21850. - DOI - PMC - PubMed
    1. Bernardo-Colon A., Vest V., Clark A., Cooper M.L., Calkins D.J., Harrison F.E. Antioxidants prevent inflammation and preserve the optic projection and visual function in experimental neurotrauma. Cell Death Dis. 2018;9(11) doi: 10.1038/s41419-018-1061-4. - DOI - PMC - PubMed
    1. Blancher C., Harris A.L. The molecular basis of the hypoxia response pathway: tumour hypoxia as a therapy target. Canc. Metastasis Rev. 1998 doi: 10.1023/A:1006002419244. - DOI - PubMed
    1. Bond W.S., Hines-Beard J., Goldenmerry Yp L., Davis M., Farooque A., Sappington R.M. Virus-mediated EpoR76E therapy slows optic nerve axonopathy in experimental glaucoma. Mol. Ther. 2016 doi: 10.1038/mt.2015.198. - DOI - PMC - PubMed
    1. Bryan H.K., Olayanju A., Goldring C.E., Park B.K. Biochemical Pharmacology. 2013. The Nrf2 cell defence pathway: keap1-dependent and -independent mechanisms of regulation. - DOI - PubMed

Publication types

MeSH terms

Substances