. 2021 Feb 12;7(7):eabe5085.
doi: 10.1126/sciadv.abe5085. Print 2021 Feb.

Mitovesicles are a novel population of extracellular vesicles of mitochondrial origin altered in Down syndrome

Affiliations

Mitovesicles are a novel population of extracellular vesicles of mitochondrial origin altered in Down syndrome

Pasquale D'Acunzo et al. Sci Adv. .

Abstract

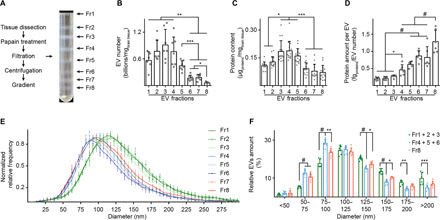
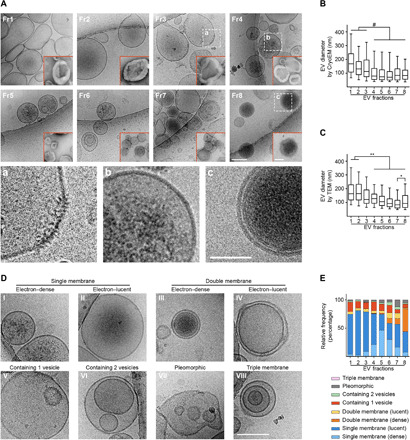
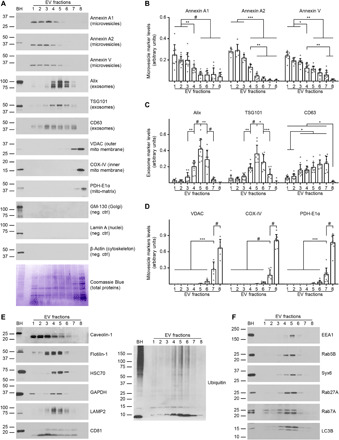
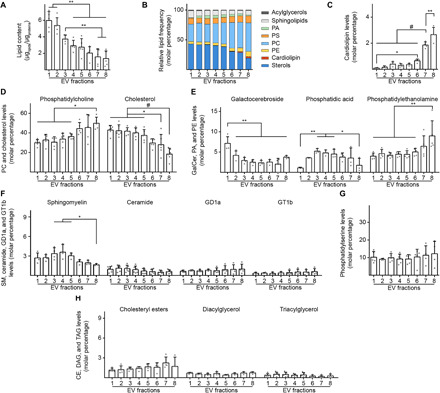
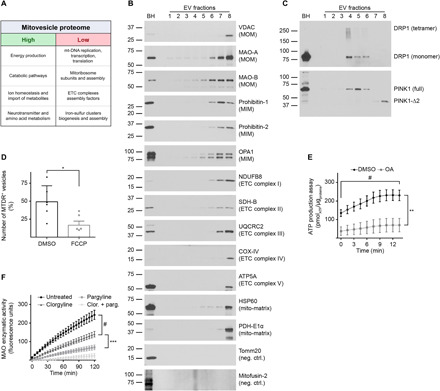
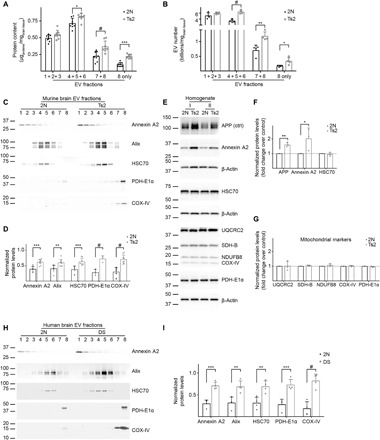
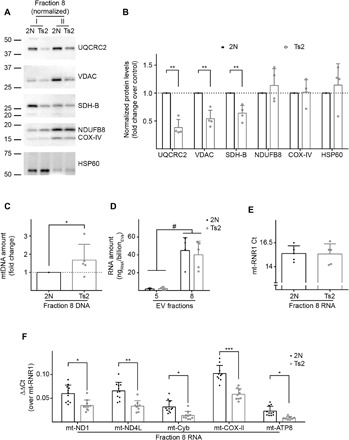
Mitochondrial dysfunction is an established hallmark of aging and neurodegenerative disorders such as Down syndrome (DS) and Alzheimer's disease (AD). Using a high-resolution density gradient separation of extracellular vesicles (EVs) isolated from murine and human DS and diploid control brains, we identify and characterize a previously unknown population of double-membraned EVs containing multiple mitochondrial proteins distinct from previously described EV subtypes, including microvesicles and exosomes. We term these newly identified mitochondria-derived EVs "mitovesicles." We demonstrate that brain-derived mitovesicles contain a specific subset of mitochondrial constituents and that their levels and cargo are altered during pathophysiological processes where mitochondrial dysfunction occurs, including in DS. The development of a method for the selective isolation of mitovesicles paves the way for the characterization in vivo of biological processes connecting EV biology and mitochondria dynamics and for innovative therapeutic and diagnostic strategies.


Figures

Fig. 1
Fig. 1. Subpopulations of brain EVs with different morphometric features are separated through a high-resolution density gradient.
(A) Schematic protocol of the brain EV isolation and a representative picture of the OptiPrep density gradient fractionation. (B) NTA, (C) protein content, and (D) quantification of protein content per vesicle in EV fractions isolated from the brain of wild-type mice, normalized to the brain weight. (E) Diameter analysis of brain EVs by NTA. The bell curves are normalized to the mode of the distribution. (F) Percentage of vesicles with a diameter that falls within a 25-nm bin, as estimated in (E). The numbers of LDFs (Fr1 to Fr3, green) and of IDFs (Fr4 to Fr6, blue) were combined as they showed similar results. Fr8 is in red. Statistical test: (B) to (D), one-way ANOVA with Tukey’s multiple comparisons test; (F), two-way ANOVA with Tukey’s multiple comparisons test. Number of independent isolations: (B), 7; (C), 15; (D) to (F), 6. Data shown in (B) to (F): Means ± SD. *P < 0.05, **P < 0.01, ***P < 10−3, #P < 10−4.
Fig. 2
Fig. 2. Cryogenic electron microscopy reveals enrichment of specific EV subtypes in each fraction.
(A) Representative photomicrographs of brain EVs imaged by either cryoEM or TEM (insets with red borders). Unlike TEM, under cryoEM morphology was preserved. Dashed boxes: area magnified in a, b, and c, respectively. (B and C) Quantification of vesicle diameter in each EV fraction imaged under cryoEM or TEM. (D and E) Representative photomicrographs and relative percentage per fraction of morphologically different EV subtypes imaged under cryoEM. Statistical test in (B) and (C): Kruskal-Wallis with Dunn’s multiple comparisons test. Number of replicates in (B) and (C): 30 random photomicrographs per fraction from three independent isolations; (E): 30 random cryoEM photomicrographs per fraction from two independent isolations. Data shown in (B) and (C): box and whiskers plot (whiskers: 1st and 99th percentiles). Scale bars, 100 nm (A and D; main figure), 50 nm [(A) insets (a, b, and c magnifications and TEM photomicrographs)]. *P < 0.05, **P < 0.01, #P < 10−4.
Fig. 3
Fig. 3. LDFs, IDFs, and Fr8 are enriched in microvesicles, exosomes, and mitovesicles, respectively.
(A) Representative Western blot analysis and Coomassie Blue staining (loading control) of EVs isolated from the brain of wild-type mice and fractionated by an OptiPrep density gradient. The same volume of each fraction was loaded. (B) Densitometric quantifications of the microvesicle, (C) exosome, and (D) mitovesicle markers shown are normalized to the brain weight. (E) Representative Western blot analyses of EVs isolated from the brain of wild-type mice and fractionated by an OptiPrep density gradient. The same volume of each fraction was loaded. (F) Representative Western blot analyses of the endocytic proteins found in brain EVs. Brain homogenate (BH) was loaded as a reference. Statistical test in (B) to (D): one-way ANOVA with Tukey’s multiple comparisons test. Number of independent isolations: 10. Data shown in (B) to (D): Means ± SD. *P < 0.05, **P < 0.01, ***P < 10−3, #P < 10−4.
Fig. 4
Fig. 4. Lipid analysis of brain EV fractions confirms the nature of LDF, IDF, and Fr8 EVs.
(A) Quantification of the total lipid content per fraction. The lipids analyzed were phosphatidylserine (PS), phosphatidylcholine (PC), phosphatidylethanolamine (PE), phosphatidic acid (PA), cardiolipin (CL), sterols [cholesterol and cholesteryl esters (CE)], acylglycerols [mono- (MAG), di- (DAG), and triacylglycerols (TAG)], and the sphingolipids ceramide, sphingomyelin (SM), galactocerebroside (GalCer), GD1a, and GT1b. The graph shows the total amount of these lipids normalized to the amount of proteins in each fraction as estimated by BCA. (B) Schematic lipid composition of the EVs found in each fraction expressed as a molar percentage. The lipids analyzed were described in (A) and grouped according to their families. (C) Cardiolipin molar percentage of brain EVs. (D) PC and cholesterol molar percentage of brain EVs. (E) GalCer, PA, and PE molar percentage of brain EVs. (F) Sphingomyelin, ceramide, GD1a, and GT1b content (expressed as a molar percentage over the total) of brain EVs. (G) Phosphatidylserine content (expressed as a molar percentage over the total) of brain EVs. No statistical differences were found. (H) Cholesteryl esters, DAG, and TAG content (expressed as a molar percentage over the total) of brain EVs. No statistical differences were found. Number of independent isolations: (A), 5; (B), 5; (C), 4; (D), 5; (E), 4 to 6; (F), 4; (G), 5; and (H), 4. Statistical test in (A) to (H): one-way ANOVA with Tukey’s multiple comparisons test. Data shown in (A) to (H): Means ± SD. *P < 0.05, **P < 0.01, #P < 10−4.
Fig. 5
Fig. 5. Mitovesicles are metabolically active EVs with a specific subset of mitochondrial proteins.
(A) EVs were isolated from brains of 12-month-old wild-type mice and fractionated through an OptiPrep step gradient. Fr8 EV lysates were analyzed by LC-MS, and the mitochondrial proteins found were clustered according to their known functions. Mitochondrial pathways that were highly underrepresented are indicated as “high” and “low,” respectively. (B) Representative Western blot analysis of brain EVs with antibodies to mitochondrial proteins. (C) Representative Western blot analyses of brain EVs using antibodies to DRP1 and PINK1. (D) Relative number of MTDR-positive (MTDR+) vesicles found in Fr8 EVs as quantified by NTA and expressed as percentage over the total number of EVs. As a control, samples were treated with the uncoupler FCCP that dissipates mitochondrial potential. (E) Analysis of ATP levels in brain Fr8 using a luciferase-based assay. As a control, samples were treated with oligomycin + antimycin-A (OA). Each experiment was run in triplicate. Chemiluminescence was quantified every 1.5 min. (F) MAO activity was measured in Fr8 brain EVs using a commercial MAO enzymatic activity assay. As controls, samples were treated with clorgyline (MAO-A inhibitor), pargyline (MAO-B inhibitor), or both. Fluorescence was read every 5 min. For additional data see table S2. Brain homogenate (BH) was loaded as a reference. Statistical test in (D): Student’s t test; (E) and (F): two-way ANOVA with Tukey’s multiple comparisons test. Number of independent isolations: (A), 3; (B) and (C), 10; (D), 6; (E) and (F), 4. Data shown in (D) to (F): Means ± SD. *P < 0.05, **P < 0.01, ***P < 10−3, and #P < 10−4.
Fig. 6
Fig. 6. Brain mitovesicle levels are altered by neuropathology.
(A) Protein levels and (B) number of EVs normalized to the brain weight from 12-month-old 2N and Ts2 mice fractionated by an OptiPrep gradient. LDFs, IDFs, and Fr7/Fr8 were combined. Fr8 alone is also shown. (C) Representative Western blot analyses and (D) densitometric quantification of microvesicle, exosome, and mitovesicle markers in murine brain EVs. Quantifications were performed combining the signal from all the fractions normalized to the brain weight. (E to G) Representative Western blots and densitometric analyses of microvesicle, exosome, and mitovesicle markers in brain homogenates of 12-month-old Ts2 and 2N mice. β-actin was used as a loading control. APP, triplicated in Ts2 mice, was used as a positive control. Two experiments shown in the blot (I and II). Graphs are plotted as a fold change over the 2N controls. (H) Representative Western blot analyses and (I) densitometric quantification of microvesicle, exosome, and mitovesicle markers in human postmortem brain EVs. Quantifications were performed combining the signal from all the fractions normalized to the brain weight. For additional specifications. see table S8. Statistical test in (A) and (B): two-way ANOVA with Tukey’s multiple comparisons test; (D), (F), (G), and (I): Student’s t test. Number of independent isolations: (A) and (D), 8; (B) and (I), 4; (F) and (G), 3. Data shown in (A), (B), (D), (F), (G), and (I): Means ± SD. *P < 0.05, **P < 0.01, ***P < 10−3, #P < 10−4.
Fig. 7
Fig. 7. Brain mitovesicle cargo is altered in DS.
(A and B) Western blot analyses of EVs isolated from the brain of Ts2 and 2N control mice and fractionated through an OptiPrep gradient. Equal numbers of Fr8 EVs as estimated by NTA were loaded for each isolation and tested for mitochondrial markers. Two isolations are shown in the blot (I and II), the densitometric analysis is plotted as a fold change over the 2N controls. (C) Quantification of mtDNA (normalized to the number of vesicles and plotted as a fold change of trisomic versus control mice) by qPCR in murine brain Fr8 EVs. (D) Quantification of the total RNA (normalized to the number of vesicles) extracted from murine brain Fr5 and Fr8 EVs. (E) qPCR cycles of mt-RNR1 for equal amounts of Fr8 cDNA in Ts2 and 2N brain-derived EVs. (F) qPCR analysis of five mitochondria-encoded genes in Fr8 EV complementary DNAs, normalized to mt-RNR1. Statistical test in (D): two-way ANOVA with Tukey’s multiple comparisons test; (B), (C), and (E): Student’s t test; and (F): mixed effects models. Number of independent isolations: (B), 4; (C) to (F), 5. Data shown in (B) to (F): Means ± SD. *P < 0.05, **P < 0.01, ***P < 10−3, #P < 10−4.

References

    1. Gauthier S. A., Pérez-González R., Sharma A., Huang F.-K., Alldred M. J., Pawlik M., Kaur G., Ginsberg S. D., Neubert T. A., Levy E., Enhanced exosome secretion in Down syndrome brain - A protective mechanism to alleviate neuronal endosomal abnormalities. Acta Neuropathol. Commun. 5, 65 (2017). - PMC - PubMed
    1. Jeppesen D. K., Fenix A. M., Franklin J. L., Higginbotham J. N., Zhang Q., Zimmerman L. J., Liebler D. C., Ping J., Liu Q., Evans R., Fissell W. H., Patton J. G., Rome L. H., Burnette D. T., Coffey R. J., Reassessment of Exosome Composition. Cell 177, 428–445.e18 (2019). - PMC - PubMed
    1. Puhm F., Afonyushkin T., Resch U., Obermayer G., Rohde M., Penz T., Schuster M., Wagner G., Rendeiro A. F., Melki I., Kaun C., Wojta J., Bock C., Jilma B., Mackman N., Boilard E., Binder C. J., Mitochondria are a subset of extracellular vesicles released by activated monocytes and induce type I IFN and TNF responses in endothelial cells. Circ. Res. 125, 43–52 (2019). - PubMed
    1. Jang S. C., Crescitelli R., Cvjetkovic A., Belgrano V., Olofsson Bagge R., Sundfeldt K., Ochiya T., Kalluri R., Lötvall J., Mitochondrial protein enriched extracellular vesicles discovered in human melanoma tissues can be detected in patient plasma. J. Extracell. Vesicles 8, 1635420 (2019). - PMC - PubMed
    1. Guescini M., Genedani S., Stocchi V., Agnati L. F., Astrocytes and Glioblastoma cells release exosomes carrying mtDNA. J. Neural Transm. (Vienna) 117, 1 (2010). - PubMed

Publication types