. 2021 Feb 12;7(7):eabc6093.
doi: 10.1126/sciadv.abc6093. Print 2021 Feb.

Usp11 controls cortical neurogenesis and neuronal migration through Sox11 stabilization

Affiliations

Usp11 controls cortical neurogenesis and neuronal migration through Sox11 stabilization

Shang-Yin Chiang et al. Sci Adv. .

Abstract

The role of protein stabilization in cortical development remains poorly understood. A recessive mutation in the USP11 gene is found in a rare neurodevelopmental disorder with intellectual disability, but its pathogenicity and molecular mechanism are unknown. Here, we show that mouse Usp11 is expressed highly in embryonic cerebral cortex, and Usp11 deficiency impairs layer 6 neuron production, delays late-born neuronal migration, and disturbs cognition and anxiety behaviors. Mechanistically, these functions are mediated by a previously unidentified Usp11 substrate, Sox11. Usp11 ablation compromises Sox11 protein accumulation in the developing cortex, despite the induction of Sox11 mRNA. The disease-associated Usp11 mutant fails to stabilize Sox11 and is unable to support cortical neurogenesis and neuronal migration. Our findings define a critical function of Usp11 in cortical development and highlight the importance of orchestrating protein stabilization mechanisms into transcription regulatory programs for a robust induction of cell fate determinants during early brain development.


Figures

Fig. 1
Fig. 1. Usp11 is expressed highly in developing mouse cortex and is important for the generation of layer 6 neurons.
(A) Whole-mount in situ hybridization analysis of E13.5 mouse embryos using sense or antisense probe of Usp11. Scale bar, 500 μm. cb, cerebellum; drg, dorsal root ganglia; he, heart; hy, hypothalamus; li, liver; mb, midbrain; mo, medulla oblongata; ncx, neocortex; ne, nasal epithelium; ob, olfactory bulb; sc, spinal cord; th, thalamus; to, tongue. (B) Immunofluorescence analysis for Usp11 expression in the coronal sections of mouse cortices at indicated developmental stages. Scale bar, 100 μm. PP; preplate; IZ, intermediate zone, VZ, ventricular zone; SVZ, subventricular zone; CP, cortical plate. The quantitative data of Usp11 staining intensity (normalized to the intensity in VZ/SVZ at each time point) are shown on the right. (C) Usp11 KO mouse. Top: Schematic presentation of the genomic structure of Usp11 KO mouse. Bottom: Western blot (WB) analysis of Usp11 expression in the cortices of P7 wild-type (WT) and Usp11 KO mice. Data of four mice of each genotype are shown. (D and E) DAPI staining of cortical sections (D) and quantification of cortex thickness (E) of P7 WT or Usp11 KO mice. Boxes indicate the regions used for quantification. Scale bar, 500 μm. (F) Immunostaining for layer-specific markers and DAPI staining on P7 WT or Usp11 KO cortical sections. Scale bar, 100 μm. (G and H) Quantitative data for the thickness of indicated cortical layers (G) and number of neurons expressing indicated markers (H) in P7 wild-type or Usp11 KO cortices. Data in (B), (E), (G), and (H) are means ± SD; *P < 0.05, **P < 0.01, and ***P < 0.001 by t test, n = 4; ns, not significant.
Fig. 2
Fig. 2. USP11 regulates RGC cell cycle and proliferation.
(A and B) Immunostaining for EdU and Ki67 (A) and quantitative data (B) for examining NPC cell cycle exit in WT and Usp11 KO cortices labeled with EdU at each day from E11.5 to E14.5 and harvested 1 day later. Scale bar, 100 μm. (C) Top: Schematic diagram of the timing of EdU and BrdU injections and sacrifice to determine the cell cycle length. Bottom panels: Immunostaining for EdU and BrdU and DAPI staining on coronal sections of WT or Usp11 KO cortices (left) and quantitative data for cell cycle length (right). Scale bar, 100 μm. Method for calculating cell cycle length was described in Materials and Methods. (D and F) Immunostaining for EdU and Pax6 or Tbr2 on coronal sections of E13.5 WT or Usp11 KO cortices. EdU was injected at E12.5. Scale bar, 100 μm. (E and G) Quantification of results from (D) and (F), respectively, showing the percentage of EdU-labeled cells expressing indicated markers. Data in (B), (C), (E), and (G) are means ± SD; **P < 0.01 and ***P < 0.001, by t test, n = 4.
Fig. 3
Fig. 3. Usp11 acts cell-autonomously to promote RGC differentiation.
(A and H) Immunostaining for EdU and Tbr1 on coronal sections of the cortices from E15.5 Usp11 KO (A) or Usp11 E-cKO (H) mice and their control littermates. EdU was injected at E12.5. The insets on the right are enlarged images of the area outlined in dotted lines, and arrows mark EdU+ cells expressing Tbr1. Scale bar, 100 μm. (B and I) Quantification of results from (A) and (H), respectively, showing the percentage of EdU-labeled cells expressing Tbr1. (C and J) Quantification of results from (A) and (H), respectively, showing the percentage of EdU-labeled cells at indicated locations. (E) Immunostaining for EdU and Pax6 on coronal sections of E13.5 control or Usp11 E-cKO cortices. EdU was injected at E12.5. Scale bar, 100 μm. (F) Quantification of results from (E) showing the percentage of EdU-labeled cells expressing Pax6. (D and G) Immunostaining for EdU and Tbr1 on coronal sections of E15.5 Usp11 KO (D) or Usp11 E-cKO (G) mice and their control littermates. Scale bar, 100 μm. Quantification of the total Tbr1+ cells is shown on the bottom. Data in (B), (C), (D), (F), (G), (I), and (J) are means ± SD; *P < 0.05, **P < 0.01, and ***P < 0.001, by t test (B, D, F, G, and I) or one-way ANOVA with Tukey’s post hoc test (C and J), n = 4.
Fig. 4
Fig. 4. Usp11 acts cell-autonomously to promote late-born neuronal migration.
(A and D) Immunostaining for EdU and Satb2 on coronal sections of E18.5 WT and Usp11 KO (A) or cWT and Usp11 N-cKO (D) cortices. EdU was injected at E15.5. Scale bar, 100 μm. Locations of EdU+ cells are depicted to the right. (B, C, E, and F) Quantification of results from (A) or (D) showing the percentage of EdU+ (B and E) and EdU+Satb2+ cells (C and F) at each position. Data are means ± SD; *P < 0.05, **P < 0.01, and ***P < 0.001 by one-way ANOVA with Tukey’s post hoc test, n = 4.
Fig. 5
Fig. 5. Usp11 deubiquitinates Sox11.
(A) The volcano plot of the proteins identified from WT and Usp11 KO cortices by label-free quantitative LC-MS/MS. The proteins are plotted according to their log2 fold changes (x axis) and log10 P values (y axis). Proteins down-regulated in Usp11 KO are shown as black dots. Among them, proteins with known functions in neurogenesis or nervous system development are marked in red, the known targets of Sox11 are in blue, and the protein with both features is in orange. (B) Venn diagram of the number of proteins down-regulated in Usp11 KO cortices uncovered from proteome analysis (four biological replicates) overlapping with that showing a decreased ubiquitination in Usp11 overexpressed neurons identified from ubiquitylome analysis (one biological replicate). (C and D) Analysis of Sox11 ubiquitination levels in 293T cells transfected with indicated constructs (C) or N2a cells stably expressing indicated shRNAs and transfected with indicated constructs (D). The cellular ubiquitinated proteins were pulled down by Ni-NTA beads under denaturing conditions and then analyzed by Western blot. (E) In vitro deubiquitination assay using purified and ubiquitinated Sox11 and separately purified Usp11. (F and G) Immunoprecipitation analysis of the interaction between endogenous Usp11 and endogenous Sox11 in N2a cells (F) or lysate of mouse cortex (G). IgG, immunoglobulin G.
Fig. 6
Fig. 6. USP11 stabilizes Sox11 to result in a robust Sox11 induction during cortical development.
(A and B) Western blot analysis of Sox11 expression in N2a cells expressing indicated shRNAs (A) or in 293T cells transfected with indicated constructs (B). (C and D) Western blot analysis of Sox11 expression in N2a cells stably expressing indicated shRNAs and treated with MG132 for 16 hours (C) or cycloheximide for indicated time points (D). Of note, for an accurate comparison of protein turnover, a higher amount (2.5-fold) of lysates from Usp11 knockdown cells was loaded (D). The levels of Sox11 are normalized to that in 0 hours and indicated on the bottom. (E and F) RT–quantitative PCR (qPCR) (E) and Western blot (F) analyses of the expression of indicated genes/proteins at indicated time points during neuron induction using NPCs isolated from E12.5 cerebral cortices. The relative amounts of Sox11 are indicated on the bottom (F). (G) RT-qPCR analysis of the expression of Sox11 mRNA in the cortices of Usp11 KO or wild-type littermates at indicated developmental stages. (H and I) Western blot analysis of Sox11 expression in the cortices of Usp11 KO or wild-type littermates at indicated developmental stages. The three repeats of Western blots and quantitative data are shown in (H) and (I), respectively. In (E), (G), and (H), data are means ± SD, n = 3.
Fig. 7
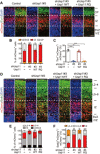
Fig. 7. Sox11 stabilization contributes to the functions of Usp11 in cortical development.
(A) Immunostaining for Tbr1 and DAPI staining of cortical sections of E15.5 embryos electroporated in utero with indicated constructs and mCherry expressing construct at E12.5. The transfected cells are marked by mCherry. Scale bar, 100 μm. (B and C) Quantification of results from (A) showing the percentage of transfected cells expressing Tbr1 (B) and the location of transfected cells (C). Data are means ± SD; **P < 0.01 and ***P < 0.001 by one-way ANOVA with Tukey’s post hoc test, n = 4. (D) Immunostaining for Satb2 and DAPI staining of cortical sections of E18.5 embryos electroporated in utero with indicated constructs and mCherry expressing construct at E15.5. The transfected cells are marked by mCherry. Scale bar, 100 μm. (E and F) Quantification of results from (D) showing the locations of mCherry+Satb2+ cells (E) and mCherry+ cells (F). Data are means ± SD; *P < 0.05, **P < 0.01, and ***P < 0.001 by one-way ANOVA with Tukey’s post hoc test, n = 4.
Fig. 8
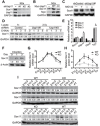
Fig. 8. Disease-associated Usp11 mutant is defective in regulating Sox11.
(A) Western blot analysis of SOX11 expression in 293T cells expressing Usp11 WT or R241Q mutant. (B) Analysis of Sox11 ubiquitination levels in 293T cells transfected with indicated constructs. Sox11 was immunoprecipitated from cell lysates and analyzed by Western blot. (C) Immunoprecipitation analysis of the interaction of wild-type or mutant Usp11 with endogenous SOX11 in 293T cells. To prevent SOX11 degradation, the transfected cells were treated with MG132 for 16 hours before harvest. (D and E) Immunostaining of Sox11 using cortical sections of E15.5 embryos electroporated in utero with indicated shRNA and cDNA constructs and mCherry expressing construct at E12.5. The transfected cells are visualized by mCherry and marked by arrows. Scale bar, 20 μm. The Sox11 immunofluorescence intensities in mCherry+ cells were quantified and shown in (E). Data are means ± SD; **P < 0.01 and ***P < 0.001 by t test, n = 45.
Fig. 9
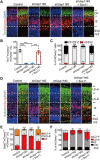
Fig. 9. Disease-associated Usp11 mutant is defective in supporting cortical neurogenesis and neuronal migration.
(A) Immunostaining for Tbr1 and DAPI staining using cortical sections of E15.5 embryos subjected to IUE of indicated constructs and mCherry expressing construct at E12.5. The transfected cells are marked by mCherry. Scale bar, 100 μm. (B and C) Quantification of results from (A) showing the location of transfected cells (B) and the percentage of transfected cells expressing Tbr1 (C). Data are means ± SD; **P < 0.01 and ***P < 0.001 by one-way ANOVA with Tukey’s post hoc test, n = 4. (D) Immunostaining for Satb2 and DAPI staining using cortical sections of E18.5 embryos electroporated in utero with indicated constructs and mCherry expressing construct at E15.5. The transfected cells are marked by mCherry. Scale bar, 100 μm. (E and F) Quantification of results from (D) showing the location of mCherry+ cells (E) or mCherry+Satb2+ cells (F). Data are means ± SD, *P < 0.05, **P < 0.01, and ***P < 0.001 by one-way ANOVA with Tukey’s post hoc test, n = 4.

References

    1. Florio M., Huttner W. B., Neural progenitors, neurogenesis and the evolution of the neocortex. Development 141, 2182–2194 (2014). - PubMed
    1. Desikan R. S., Barkovich A. J., Malformations of cortical development. Ann. Neurol. 80, 797–810 (2016). - PMC - PubMed
    1. Guerrini R., Dobyns W. B., Malformations of cortical development: Clinical features and genetic causes. Lancet Neurol. 13, 710–726 (2014). - PMC - PubMed
    1. Nord A. S., Pattabiraman K., Visel A., Rubenstein J. L. R., Genomic perspectives of transcriptional regulation in forebrain development. Neuron 85, 27–47 (2015). - PMC - PubMed
    1. Yoon K. J., Vissers C., Ming G. L., Song H., Epigenetics and epitranscriptomics in temporal patterning of cortical neural progenitor competence. J. Cell Biol. 217, 1901–1914 (2018). - PMC - PubMed

Publication types

Substances