. 2021 Feb 12;7(7):eabd7954.
doi: 10.1126/sciadv.abd7954. Print 2021 Feb.

Prostaglandin E2 promotes intestinal inflammation via inhibiting microbiota-dependent regulatory T cells

Affiliations

Prostaglandin E2 promotes intestinal inflammation via inhibiting microbiota-dependent regulatory T cells

Siobhan Crittenden et al. Sci Adv. .

Abstract

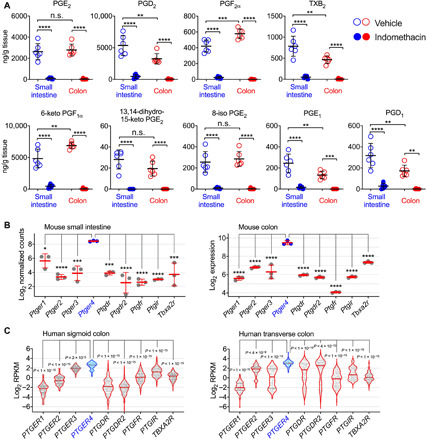
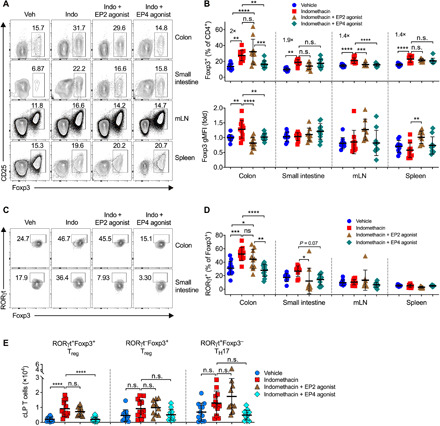
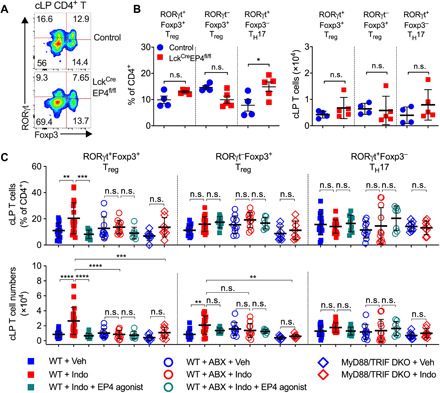
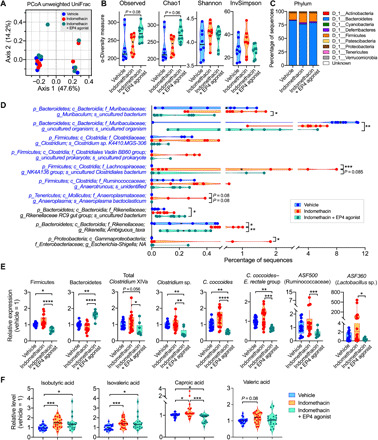
The gut microbiota fundamentally regulates intestinal homeostasis and disease partially through mechanisms that involve modulation of regulatory T cells (Tregs), yet how the microbiota-Treg cross-talk is physiologically controlled is incompletely defined. Here, we report that prostaglandin E2 (PGE2), a well-known mediator of inflammation, inhibits mucosal Tregs in a manner depending on the gut microbiota. PGE2 through its receptor EP4 diminishes Treg-favorable commensal microbiota. Transfer of the gut microbiota that was modified by PGE2-EP4 signaling modulates mucosal Treg responses and exacerbates intestinal inflammation. Mechanistically, PGE2-modified microbiota regulates intestinal mononuclear phagocytes and type I interferon signaling. Depletion of mononuclear phagocytes or deficiency of type I interferon receptor diminishes PGE2-dependent Treg inhibition. Together, our findings provide emergent evidence that PGE2-mediated disruption of microbiota-Treg communication fosters intestinal inflammation.


Figures

Fig. 1
Fig. 1. Expression of PGs and their receptors in the intestine.
(A) Levels of PGs and their metabolites in small intestines and colons from mice administered with indomethacin or vehicle control in drinking water for 5 days (n = 6 each group) as measured by lipidomic analysis. (B) Gene expression of PG receptors in mouse small and large intestines. Microarray gene expression data of normal C57BL/6 mouse colons (n = 3) were retrieved from the Gene Expression Omnibus (GEO) dataset GSE31106. RNA sequencing (RNA-seq) data of normal C57BL/6 mouse small intestines (n = 3) were retrieved from the GEO dataset GSE97371. (C) Gene expression of PG receptors in human sigmoid (n = 149) and transverse (n = 104) colon biopsy samples of healthy individuals. RNA-seq data were downloaded from the Genotype-Tissue Expression project database and analyzed using Python 3.7.0. RPKM, reads per kilobase of transcript. Each scatter dot plot in bar graphs represents data from one mouse (A and B) or individual (C). Data shown as means ± SD (A and B) or presented as violin bars with scatter plots (C) are analyzed by analysis of variance (ANOVA) with post hoc Holm-Sidak’s multiple comparisons test. *P < 0.05, **P < 0.01, ***P < 0.001, and ****P < 0.0001. n.s., not significant.
Fig. 2
Fig. 2. PGE2-EP4 signaling inhibits intestinal Tregs in the steady state.
(A) Representative flow cytometry plots of Foxp3+ Tregs gated on live CD45+CD3+CD4+ T cells in colon and small intestinal LP, mLN, and spleen from C57BL/6 mice that were treated with vehicle (Veh) or indomethacin (Indo) in drinking water and injected intraperitoneally with an EP2 agonist, Butaprost, or an EP4 agonist, L-902,688 (n = 8 to 12). (B) Percentages of Foxp3+ Tregs (top) and geometric MFI (gMFI) of Foxp3 (bottom). (C) Representative flow cytometry dot plots of RORγt expression among Foxp3+ Tregs in colon and small intestinal LP. (D) Percentages of RORγt expression by Foxp3+ Tregs. (E) Absolute numbers of RORγt+Foxp3+ Tregs, RORγtFoxp3+ Tregs, RORγt+Foxp3 TH17 cells in colon LP (cLP). Each scatter dot plot in bar graphs represents data from one mouse. Data shown as means ± SD are pooled from four independent experiments and analyzed by ANOVA with post hoc Holm-Sidak’s multiple comparisons test (B, D, and E). *P < 0.05, **P < 0.01, ***P < 0.001, and ****P < 0.0001. n.s., not significant.
Fig. 3
Fig. 3. The gut microbiota is involved in PGE2-EP4 signaling regulation of intestinal Tregs.
(A and B) Representative flow cytometry plots (A) and percentages and numbers (B) of RORγt+Foxp3+ Tregs, RORγtFoxp3+ Tregs, RORγt+Foxp3 TH17 cells in colon LP of LckCreEP4fl/fl (n = 5) and control (n = 4) mice determined by flow cytometry. (C) Percentages and numbers of RORγt+Foxp3+ Tregs, RORγtFoxp3+ Tregs, and RORγt+Foxp3 TH17 cells in colon LP of WT and MyD88/TRIF double knockout (DKO) mice that were treated with vehicle, indomethacin, or indomethacin plus EP4 agonist, L-902,688 (n = 7 to 18). Antibiotics (ABX) were administered to WT mice in drinking water for 2 weeks started 1 week before receiving indomethacin or vehicle. Each scatter dot plot in bar graphs represents data from one mouse. Data shown as means ± SD are pooled from two (B) or five (C) experiments and analyzed by ANOVA with post hoc Holm-Sidak’s multiple comparisons test. *P < 0.05, **P < 0.01, ***P < 0.001, and ****P < 0.0001. n.s., not significant.
Fig. 4
Fig. 4. PGE2-EP4 signaling alters the gut microbiota.
(A to D) DNA extracts of the cecal contents from C57BL/6 mice receiving vehicle control or indomethacin plus EP4 agonist for 5 days (n = 8 per group) were analyzed by 16S rRNA gene sequencing. (A) PCoA of cecal microbiota structure as measured by unweighted UniFrac distances among the three groups. (B) α-Diversity of the gut microbiome as measured by observed OTUs, Chao1 index, Shannon diversity, and InvSimpson index. (C) Phylum-level microbiota composition expressed as relative abundances. (D) Bacterial species changed in relative abundance among different groups. (E) 16S rRNA gene expression of indicated commensal microbiota in cecal contents obtained from C57BL/6 mice treated with vehicle (n = 17), indomethacin (n = 18), or indomethacin plus EP4 agonist L-902,688 (n = 9) for 5 days. Relative abundance of each group of bacteria to total cecal bacteria was determined by real-time quantitative polymerase chain reaction (qPCR) and normalized to the vehicle group. (F) Relative SCFA levels in cecal contents from mice treated with vehicle (n = 22), indomethacin (n = 22), or indomethacin plus EP4 agonist L-902,688 (n = 18). Amounts of SCFAs were detected using gas chromatography and normalized to the vehicle group. Each scatter dot plot represents data from one mouse (A, B, and D to F). Data plotted in box and whiskers bar graphs are pooled from five experiments and analyzed by nonparametric Kruskal-Wallis test with post hoc Dunn’s multiple comparisons test (E and F). *P < 0.05, **P < 0.01, ***P < 0.001, and ****P < 0.0001.
Fig. 5
Fig. 5. Altered gut microbiota by PGE2-EP4 signaling suppresses intestinal Treg responses and promotes intestinal inflammation.
(A) Experimental schematic diagram of cecal microbiota transplantation (CMT). Recipient C57BL/6 mice were pretreated with antibiotics for 2 weeks and rest for 1 day before receiving fresh cecal microbiota collected from C57BL/6 mice that had been treated with vehicle (Veh-CMT), indomethacin (Indo-CMT), or indomethacin plus EP4 agonist, L-902,688 (Indo/EP4 ago-CMT) for 5 days. After antibiotics treatment, some recipient mice were given back normal drinking water for 9 days before euthanized for analysis of colon immune cells [for (B)], while some other recipient mice were given back normal drinking water for 7 days, followed by administration with DSS in drinking water to induce colonic inflammation [for (C) to (G)]. (B) Numbers of colon LP Foxp3+ Tregs (left) and Foxp3 gMFI (right) in the recipient mice on day 9 after CMT (n = 5 to 6 each group). (C) Changes in body weight of recipient mice showing percentages of that at the beginning of DSS treatment (i.e., day 7). (D) DAI of the recipient mice (right) (n = 6 each group). (E) Representative images of the cecum and colon tissues (left) and colon lengths (right) of the recipient mice on day 13. Photo credit: Marie Goepp, University of Edinburgh. (F) Representative histological (hematoxylin and eosin–stained) images of distal (top row) and proximal (bottom row) colons of the recipient mice (all at same magnification, 100×). Scale bar, 200 μm. (G) Numbers of infiltrated CD3+ T cells in colon LP of the recipient mice. Each scatter dot plot in bar graphs represents data from one mouse. Data shown as means ± SD are analyzed by ANOVA with post hoc Holm-Sidak’s multiple comparisons test (B to E and G). *P < 0.05, **P < 0.01, ***P < 0.001, and ****P < 0.0001.
Fig. 6
Fig. 6. PGE2 inhibits intestinal MNPs via the gut microbiota, required for control of Tregs.
(A) Percentages (top) and numbers (bottom) of colon LP CD11c+MHC II+CD11b+ and CD11c+MHC II+CD11b MNPs from C57BL/6 WT and MyD88/TRIF double knockout mice treated with vehicle, indomethacin, or indomethacin plus EP4 agonist L-902,688 (n = 7 to 18). Antibiotics were administered to WT mice in drinking water for 2 weeks started 1 week before receiving indomethacin or vehicle. (B) Percentages (top) and numbers (bottom) of colon LP CD11c+MHC II+CD11b+ and CD11c+MHC II+CD11b MNPs in mice that were treated with antibiotics for 2 weeks, followed by transfer of cecal microbiota harvested from mice that had been administered with vehicle (Veh-CMT), indomethacin (Indo-CMT), or indomethacin plus EP4 agonist (Indo/EP4 ago-CMT) (n = 5 to 6). (C and D) Representative flow cytometry plots (C) and percentages (D) of colon LP CD11c+MHC II+CD11b+ and CD11c+MHC II+CD11b MNPs at colon LP of CD11b-DTR mice administered with diphtheria toxin (DT) or phosphate-buffered saline (PBS) (n = 6 each group). CD11b geometric gMFI of CD11c+MHC II+CD11b+ MNPs are also shown (D, right). (E) Numbers of colon LP CD45+CD3+CD4+Foxp3+ Tregs in CD11b-DTR mice treated with DT or PBS together with vehicle control, indomethacin, or indomethacin plus EP4 agonist (n = 6 to 12). (F) Representative flow cytometry plots of colonic Foxp3+ Tregs gated on live CD45+CD3+CD4+ T cells and RORγt+ or Helios+ Tregs in CD11cCreEP4fl/fl (n = 6) or control EP4fl/fl mice (n = 5). (G) Percentage and numbers of Foxp3+ Tregs. (H) Percentage and numbers of RORγt+Helios, RORγtHeliosor Helios+ Tregs. Each scatter dot plot in bar graphs represents data from one mouse. Data shown as means ± SD are pooled from five (A), three (D and E), or one (B, G, and H) independent experiments and analyzed by ANOVA with post hoc Holm-Sidak’s multiple comparisons test (A, B, and E) or two-tailed unpaired Student’s t test (D, G, and H). *P < 0.05, **P < 0.01, ***P < 0.001, and ****P < 0.0001. n.s., not significant.
Fig. 7
Fig. 7. Type I IFNs produced by MNPs mediate PGE2 suppression of intestinal Tregs.
(A) Gene expression of Ifnb, Irf7, and Isg15 in BMDCs cultured with CMPs that were isolated from mice treated with vehicle, indomethacin, or indomethacin plus EP4 agonist. Data shown as means ± SEM of duplicates are representative of two independent experiments. a.u., arbitrary units. (B) Gene expression of Ifnb, Irf7, and Isg15 in sorted colonic MNPs from vehicle- or indomethacin-treated mice. Each sample was pooled from three to four mice. Data shown as mean gene expression of technical duplicates or triplicates are representative of two independent experiments. (C) Numbers of colonic phosphorylated STAT1–positive (pSTAT1+) MNPs and Tregs in mice treated with vehicle or indomethacin (n = 8 each). (D) Percentages and numbers of colon LP pSTAT1+Foxp3+ Tregs. (E) Percentages of colon LP CD11c+MHC II+CD11b+ and CD11c+MHC II+CD11b MNPs in WT and Ifnar−/− mice treated with vehicle, indomethacin, or indomethacin plus EP4 agonist (n = 7 to 12). (F) Percentages of colon LP RORγt+Foxp3+ Tregs, RORγtFoxp3+ Tregs, and RORγt+Foxp3 TH17 cells. Each scatter dot plot represents data from one mouse. Data shown as means ± SD are pooled from two (C and D) or four (E and F) independent experiments. Two-tailed unpaired Student’s t test (C and D) or ANOVA with Holm-Sidak’s multiple comparisons test (A, E, and F). *P < 0.05, **P < 0.01, and ****P < 0.0001. n.s., not significant. (G) Diagram illustrating how PGE2 suppresses intestinal Treg responses through shaping the gut microbiota composition and modulation of MNP functions.

Similar articles

Cited by

References

    1. Uhlig H. H., Powrie F., Translating immunology into therapeutic concepts for inflammatory bowel disease. Annu. Rev. Immunol. 36, 755–781 (2018). - PubMed
    1. Basson A., Trotter A., Rodriguez-Palacios A., Cominelli F., Mucosal interactions between genetics, diet, and microbiome in inflammatory bowel disease. Front. Immunol. 7, (2016). - PMC - PubMed
    1. Lynch S. V., Pedersen O., The human intestinal microbiome in health and disease. N. Engl. J. Med. 375, 2369–2379 (2016). - PubMed
    1. Honda K., Littman D. R., The microbiota in adaptive immune homeostasis and disease. Nature 535, 75–84 (2016). - PubMed
    1. Atarashi K., Tanoue T., Oshima K., Suda W., Nagano Y., Nishikawa H., Fukuda S., Saito T., Narushima S., Hase K., Kim S., Fritz J. V., Wilmes P., Ueha S., Matsushima K., Ohno H., Olle B., Sakaguchi S., Taniguchi T., Morita H., Hattori M., Honda K., Treg induction by a rationally selected mixture of Clostridia strains from the human microbiota. Nature 500, 232–236 (2013). - PubMed

Publication types

Substances