

Quantitative systems pharmacology model predictions for efficacy of atezolizumab and nab-paclitaxel in triple-negative breast cancer
- PMID: 33579739
- PMCID: PMC7883871
- DOI: 10.1136/jitc-2020-002100
Quantitative systems pharmacology model predictions for efficacy of atezolizumab and nab-paclitaxel in triple-negative breast cancer
Erratum in
-
Correction: Quantitative systems pharmacology model predictions for efficacy of atezolizumab and nab-paclitaxel in triple-negative breast cancer.J Immunother Cancer. 2021 Oct;9(10):e002100corr1. doi: 10.1136/jitc-2020-002100corr1. J Immunother Cancer. 2021. PMID: 34645681 Free PMC article. No abstract available.
Abstract
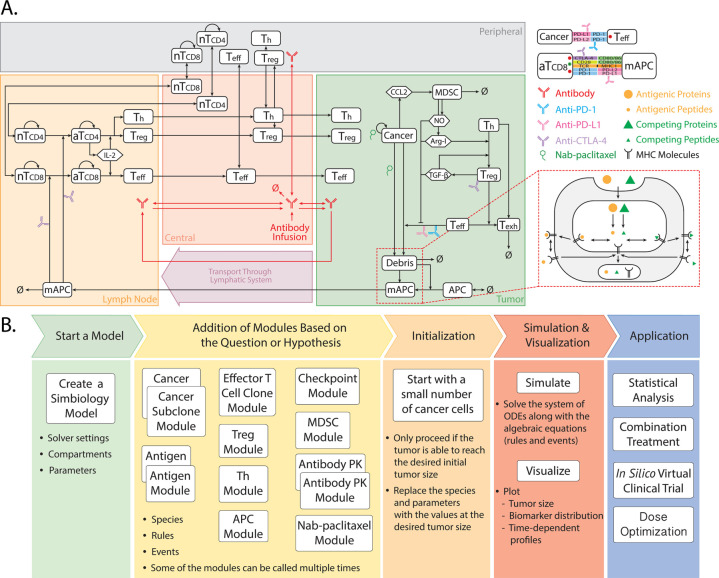
Background: Immune checkpoint blockade therapy has clearly shown clinical activity in patients with triple-negative breast cancer, but less than half of the patients benefit from the treatments. While a number of ongoing clinical trials are investigating different combinations of checkpoint inhibitors and chemotherapeutic agents, predictive biomarkers that identify patients most likely to benefit remains one of the major challenges. Here we present a modular quantitative systems pharmacology (QSP) platform for immuno-oncology that incorporates detailed mechanisms of immune-cancer cell interactions to make efficacy predictions and identify predictive biomarkers for treatments using atezolizumab and nab-paclitaxel.
Methods: A QSP model was developed based on published data of triple-negative breast cancer. With the model, we generated a virtual patient cohort to conduct in silico virtual clinical trials and make retrospective analyses of the pivotal IMpassion130 trial that led to the accelerated approval of atezolizumab and nab-paclitaxel for patients with programmed death-ligand 1 (PD-L1) positive triple-negative breast cancer. Available data from clinical trials were used for model calibration and validation.
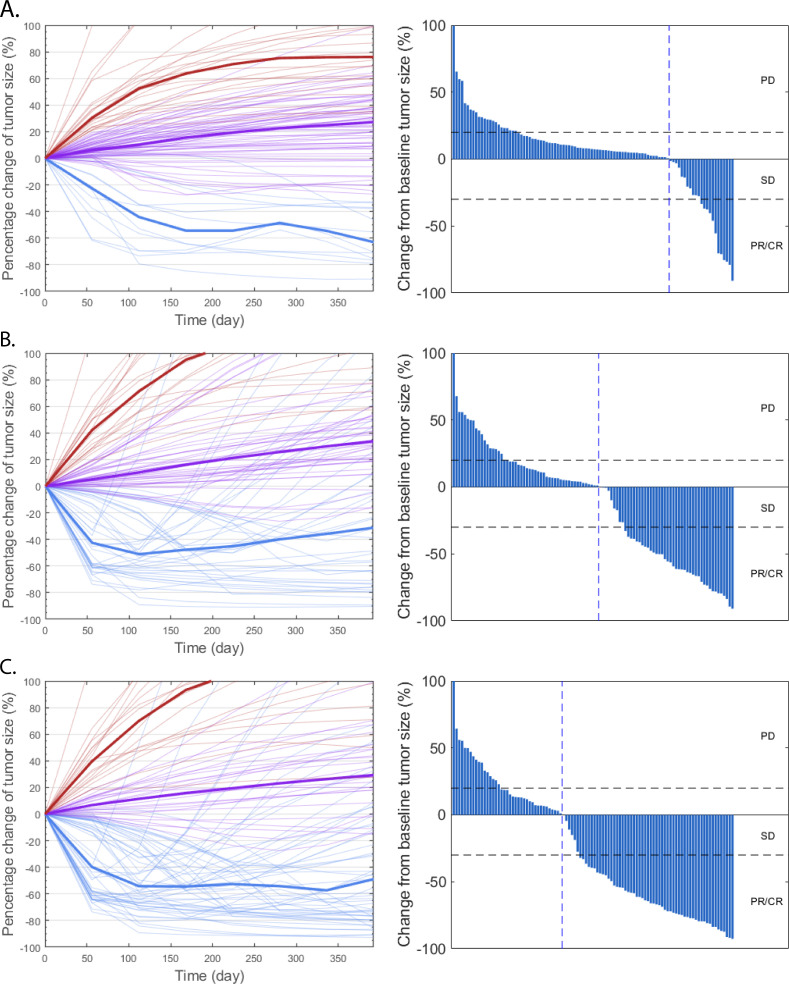
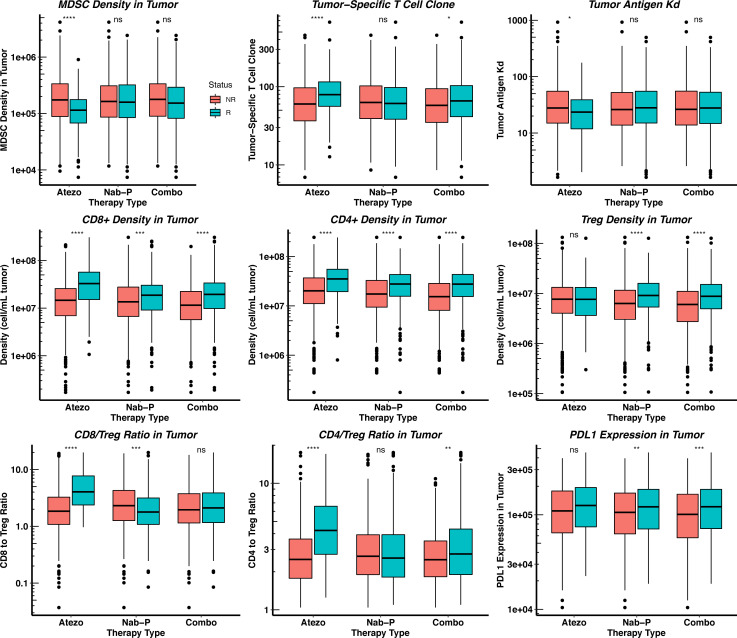
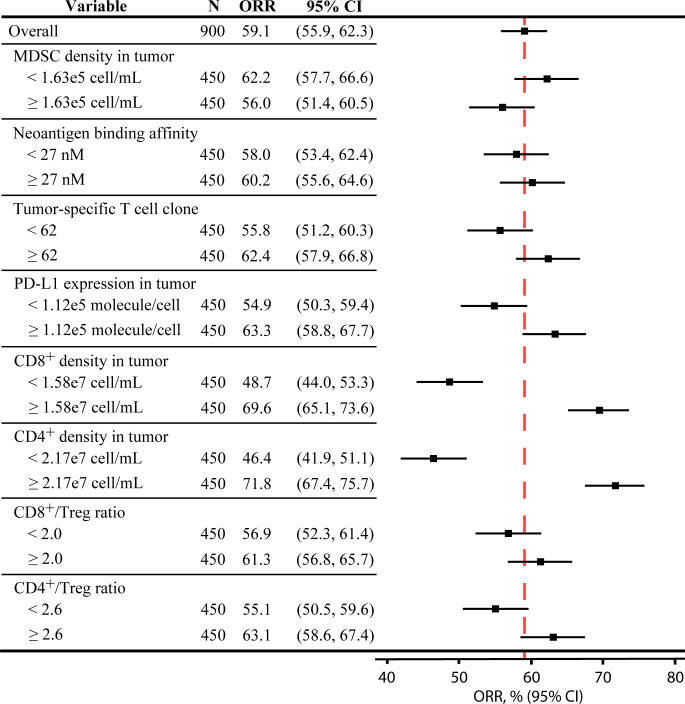
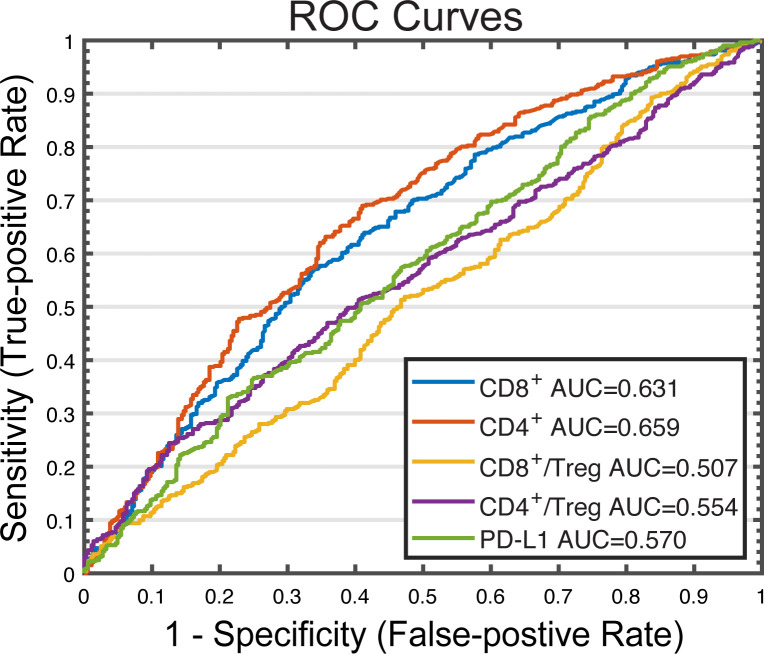
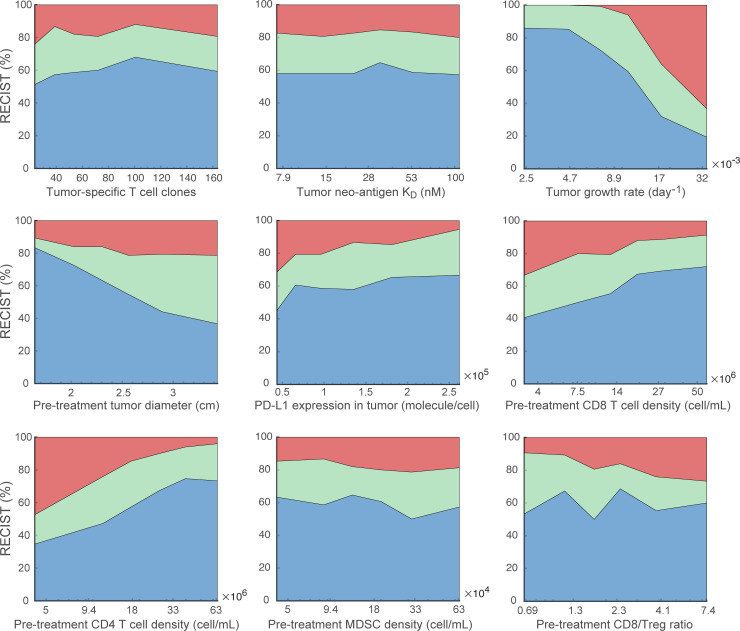
Results: With the calibrated virtual patient cohort based on clinical data from the placebo comparator arm of the IMpassion130 trial, we made efficacy predictions and identified potential predictive biomarkers for the experimental arm of the trial using the proposed QSP model. The model predictions are consistent with clinically reported efficacy endpoints and correlated immune biomarkers. We further performed a series of virtual clinical trials to compare different doses and schedules of the two drugs for simulated therapeutic optimization.
Conclusions: This study provides a QSP platform, which can be used to generate virtual patient cohorts and conduct virtual clinical trials. Our findings demonstrate its potential for making efficacy predictions for immunotherapies and chemotherapies, identifying predictive biomarkers, and guiding future clinical trial designs.
Trial registration: ClinicalTrials.gov NCT02425891.
Keywords: breast neoplasms; computational biology; immunotherapy; systems biology; tumor microenvironment.
© Author(s) (or their employer(s)) 2021. Re-use permitted under CC BY-NC. No commercial re-use. See rights and permissions. Published by BMJ.
Conflict of interest statement
Competing interests: None declared.
Figures

References
-
- Gradishar WJ, Anderson BO, Balassanian R, et al. . NCCN guidelines insights: breast cancer, version 1.2017. J Natl Compr Canc Netw 2017;15. - PubMed
-
- Schmid P, Rugo HS, Adams S, et al. . Atezolizumab plus nab-paclitaxel as first-line treatment for unresectable, locally advanced or metastatic triple-negative breast cancer (IMpassion130): updated efficacy results from a randomised, double-blind, placebo-controlled, phase 3 trial. Lancet Oncol 2020;21:44–59. 10.1016/S1470-2045(19)30689-8 - DOI - PubMed
Publication types
MeSH terms
Substances
Associated data
Grants and funding
LinkOut - more resources
Full Text Sources
Other Literature Sources
Medical
Research Materials