. 2022 Mar;71(3):497-508.
doi: 10.1136/gutjnl-2020-322935. Epub 2021 Feb 12.

Oncogenetic landscape of lymphomagenesis in coeliac disease

Collaborators, Affiliations

Oncogenetic landscape of lymphomagenesis in coeliac disease

Sascha Cording et al. Gut. 2022 Mar.

Abstract

Objective: Enteropathy-associated T-cell lymphoma (EATL) is a rare but severe complication of coeliac disease (CeD), often preceded by low-grade clonal intraepithelial lymphoproliferation, referred to as type II refractory CeD (RCDII). Knowledge on underlying oncogenic mechanisms remains scarce. Here, we analysed and compared the mutational landscape of RCDII and EATL in order to identify genetic drivers of CeD-associated lymphomagenesis.

Design: Pure populations of RCDII-cells derived from intestinal biopsies (n=9) or sorted from blood (n=2) were analysed by whole exome sequencing, comparative genomic hybridisation and RNA sequencing. Biopsies from RCDII (n=50), EATL (n=19), type I refractory CeD (n=7) and uncomplicated CeD (n=18) were analysed by targeted next-generation sequencing. Moreover, functional in vitro studies and drug testing were performed in RCDII-derived cell lines.

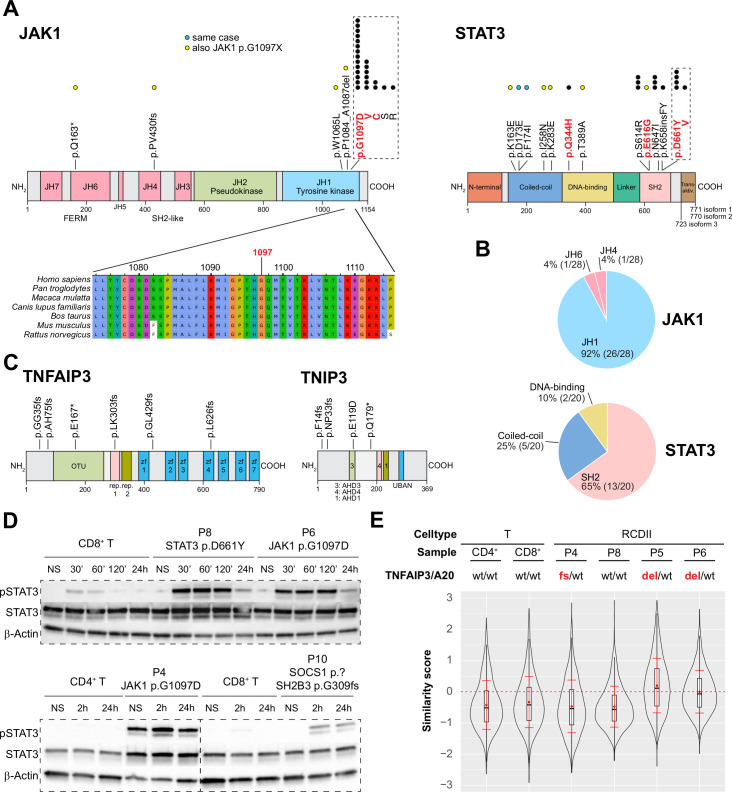
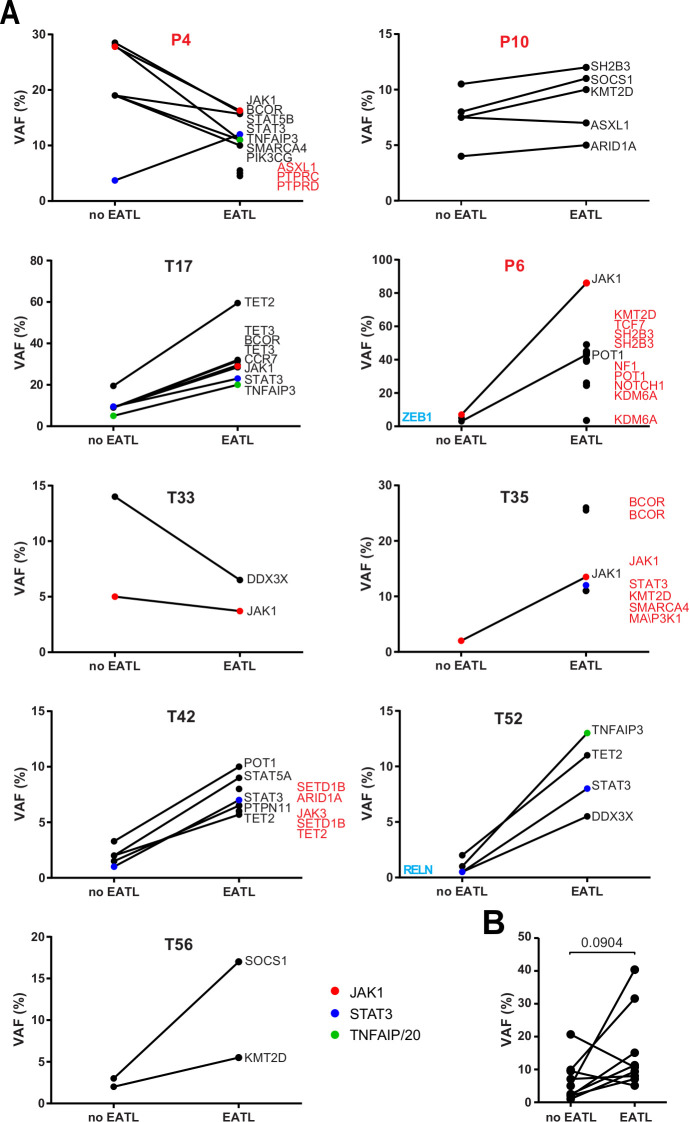
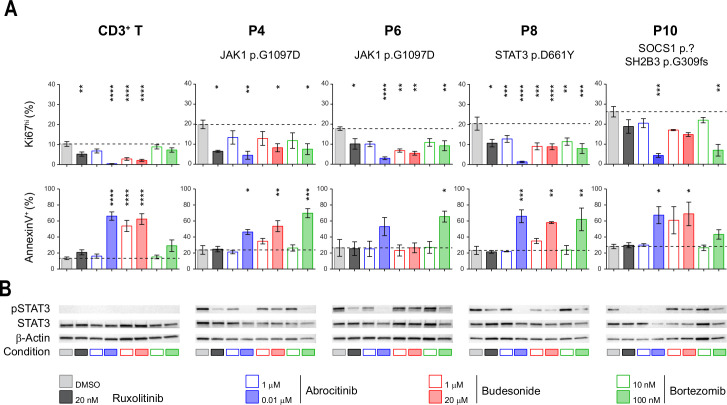
Results: 80% of RCDII and 90% of EATL displayed somatic gain-of-functions mutations in the JAK1-STAT3 pathway, including a remarkable p.G1097 hotspot mutation in the JAK1 kinase domain in approximately 50% of cases. Other recurrent somatic events were deleterious mutations in nuclear factor kappa-light-chain-enhancer of activated B-cells (NF-κB) regulators TNFAIP3 and TNIP3 and potentially oncogenic mutations in TET2, KMT2D and DDX3X. JAK1 inhibitors, and the proteasome inhibitor bortezomib could block survival and proliferation of malignant RCDII-cell lines.

Conclusion: Mutations activating the JAK1-STAT3 pathway appear to be the main drivers of CeD-associated lymphomagenesis. In concert with mutations in negative regulators of NF-κB, they may favour the clonal emergence of malignant lymphocytes in the cytokine-rich coeliac intestine. The identified mutations are attractive therapeutic targets to treat RCDII and block progression towards EATL.

Keywords: COELIAC DISEASE; GASTROINTESTINAL LYMPHOMA; GENE MUTATION.


Conflict of interest statement

Competing interests: None declared.

Figures

Figure 1
Figure 1
Genomic characterisation of the mutational landscape of type II refractory coeliac disease (RCDII) cells. Results from whole exome sequencing (WES) and comparative genomic hybridisation (CGH) in primary RCDII-IEL lines (n=9) and RCDII-cells sorted from peripheral blood (n=1). (A) Circos plot depicts distribution of curated somatic variants and copy number variants (CNV) across chromosomes. Outer ring shows ideograms of human chromosomes 1–22, X and Y from p-region to q-region, divided by centromeres in red and with cytogenetic bands depicted by light and dark shades. Gene names and CNV adjacent to ideograms highlight selected candidate genes or regions with lines pointing to their approximate location on the genome. Bar graphs on second ring and box plot on third ring summarise variants per gene and CNV per location, respectively. Numbered concentric circles show WES results from individual patients as black dots and CNV as boxes colour coded as indicated in the legend. (B) Bar graphs show proportion of transitions and transversions (upper graph) and mutation types per patient (lower graph). (C) Circos plot excerpt shows magnified regions from chromosomes 1, 4, 6 and 17 with indicated gene loci for individual patients. Dots indicate hybridisation status of CGH probes (blue=positive, red=negative) or small mutations (black) and coloured boxes summarise CNV coded as in (A). (D) Heatmap summarises selected somatic gene variants in combination with CNV results per patient (column) and gene (row) grouped by pathway or function with mutations colour coded as indicated in the legend. Bar graphs indicate percentage of occurrence per gene. IEL, intraepithelial lymphocyte.
Figure 2
Figure 2
Characterisation of type II refractory coeliac disease (RCDII)-associated somatic mutations in intestinal biopsies. (A) Heatmap summarises mutations determined by targeted next-generation sequencing (TNGS) and targeted amplicon sequencing (TAS) for individual patients (column) and genes (row), grouped by pathway or function. Mutations are colour coded according to the type of mutation and upper header bar shows sample ID and colour codes for gender, development of enteropathy-associated T-cell lymphoma (EATL) and TCRγ status as indicated in the legend. Vertical bar graph illustrates mutation frequency per gene and horizontal bar graph shows number of mutations per patient. (B) Stacked bar graph summarises relative abundance of mutation types per gene according to the colour code indicated in (A) for selected genes. (C) Correlation plot visualises co-occurrence for top 10 mutated genes in RCDII. The Pearson correlation value is coded by colour as in scale on right. Significance levels were assessed via Fisher’s exact test (***p<0.001, **p<0.01, *p<0.05).
Figure 3
Figure 3
Functional analysis of JAK1-STAT3 and NF-κB pathway activating mutations in type II refractory coeliac disease (RCDII) cell lines. (A) Schematic illustration of topographic localisation of JAK1-STAT3 mutations found in RCDII and conservation plot for indicated species centred on the JAK1 p.G1097 hotspot. Dots represent mutations per position with yellow dots depicting those co-occurring with JAK1 p.G1097 hotspot mutations and blue dots for mutations found in the same patient. Mutations highlighted in red indicate known gain-of-function (GOF) variants. (B) Pie charts show relative distribution of mutations per protein domain for JAK1 and STAT3. (C) Topographic localisation of TNFAIP3/A20 and TNIP3 mutations found in RCDII. (D) Western blots for pSTAT3, STAT3 and β-actin for RCDII-cell lines from four patients and control CD3+ T-cell lines on stimulation with 20 ng/mL IL-15 for indicated time points. (E) Violin plot shows translocation scores for NF-κB/p50 in unstimulated RCDII-cell lines (n=4) and in unstimulated control CD3+ CD4+ and CD3+ CD8+ T-cell lines. Representative results from at least two independent experiments. del, deleted; fs, frameshift; IL-15, interleukin-15; NS, not stimulated; p.?, start-loss.
Figure 4
Figure 4
Mutational profiles of enteropathy-associated T-cell lymphoma (EATL) complicating type II refractory coeliac disease (RCDII) or developing de novo in coeliac disease. Heatmap summarises mutations determined by targeted next-generation sequencing (TNGS) and targeted amplicon sequencing (TAS) for individual patients (column) with de novo EATL (left block) or RCDII-EATL (right block). Genes (row) are grouped by pathway or function. Mutations are colour coded according to the type and upper header bar shows sample ID and colour codes for gender as indicated in the legend below. Horizontal bar graph illustrates frequency of mutations per gene with adjacent absolute numbers for all EATL, de novo EATL and RCDII-EATL. Vertical bars illustrate absolute counts of mutations per patient. P values are shown for categorical differences between de novo EATL and RCDII-EATL as assessed via Fisher’s exact test.
Figure 5
Figure 5
Comparison of somatic mutations during transformation of type II disease coeliac disease (RCDII) into enteropathy-associated T-cell lymphoma (EATL). (A) Before and after plots show mean variant allele frequency (VAF) of individual mutations detected in whole biopsies of RCDII cases without (no EATL) or with EATL (EATL) for individual patients. Highlighted genes were detected in only one group (blue=no EATL, red=EATL). (B) Before and after plot summarises mean VAF of RCDII samples without (no EATL) or with EATL (EATL) in each patient; p value was calculated via paired two-tailed t-test.
Figure 6
Figure 6
Differential efficacy of candidate therapeutic drugs in type II refractory coeliac disease (RCDII) cell lines. (A) Bar plots show mean percentages±SD of flow cytometry-based assessment of annexin V+ (left column) and Ki67hi cells (right column) from four patients (n=3–5) and control CD3+ T-cells (n=14) after 72 hours of the indicated treatment; asterisks denote statistical significant change relative to untreated (dimethyl sulfoxide (DMSO)) condition; p values (****p<0.00001, ***p<0.001, **p<0.01, *p<0.05). (B) Representative western blots for pSTAT3, STAT3 and β-actin for RCDII-cell lines from four patients and T-cells as controls on 24 hours of treatment with indicated drugs or vehicle (DMSO).

References

    1. Ludvigsson JF, Murray JA. Epidemiology of celiac disease. Gastroenterol Clin North Am 2019;48:1–18. 10.1016/j.gtc.2018.09.004 - DOI - PubMed
    1. Cellier C, Patey N, Mauvieux L, et al. . Abnormal intestinal intraepithelial lymphocytes in refractory sprue. Gastroenterology 1998;114:471–81. 10.1016/S0016-5085(98)70530-X - DOI - PubMed
    1. Cellier C, Delabesse E, Helmer C, et al. . Refractory sprue, coeliac disease, and enteropathy-associated T-cell lymphoma. French coeliac disease Study Group. Lancet 2000;356:203–8. 10.1016/s0140-6736(00)02481-8 - DOI - PubMed
    1. Spencer J, Cerf-Bensussan N, Jarry A, et al. . Enteropathy-Associated T cell lymphoma (malignant histiocytosis of the intestine) is recognized by a monoclonal antibody (HML-1) that defines a membrane molecule on human mucosal lymphocytes. Am J Pathol 1988;132:1–5. - PMC - PubMed
    1. Malamut G, Afchain P, Verkarre V, et al. . Presentation and long-term follow-up of refractory celiac disease: comparison of type I with type II. Gastroenterology 2009;136:81–90. 10.1053/j.gastro.2008.09.069 - DOI - PubMed

Publication types