. 2021 Feb 16;118(7):e2017714118.
doi: 10.1073/pnas.2017714118.

Widespread polycistronic gene expression in green algae

Affiliations

Widespread polycistronic gene expression in green algae

Sean D Gallaher et al. Proc Natl Acad Sci U S A. .

Abstract

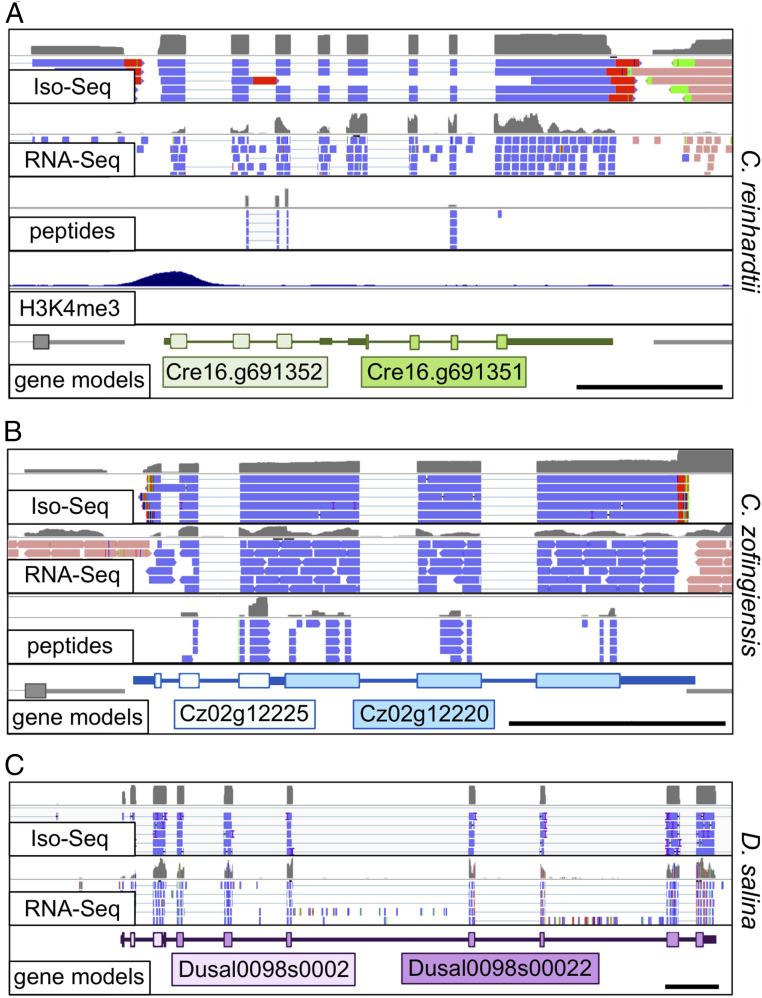
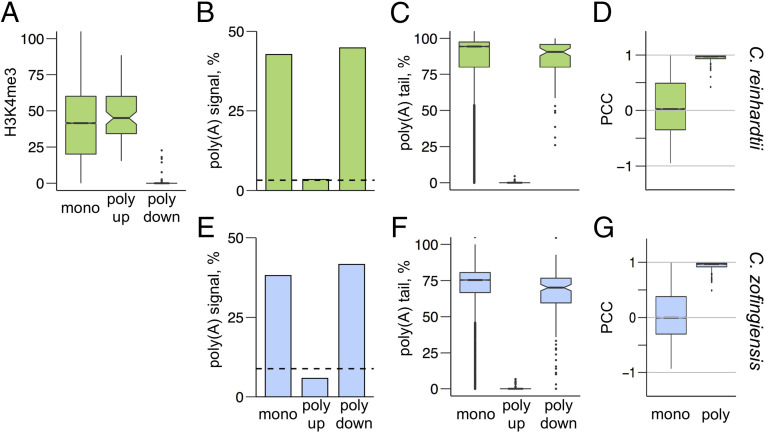
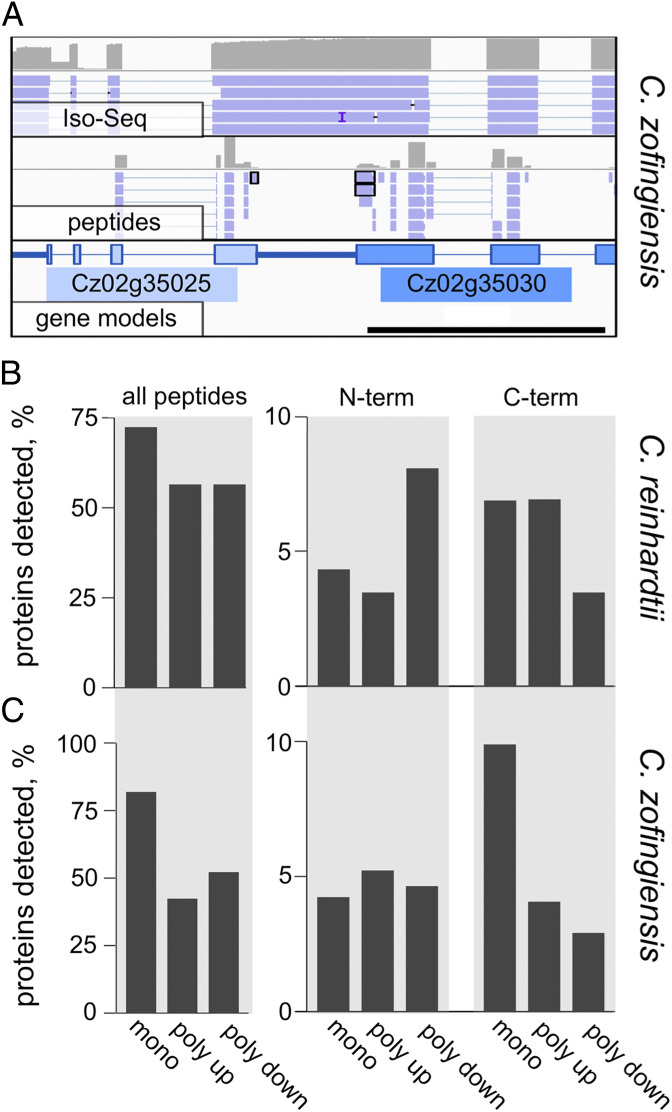
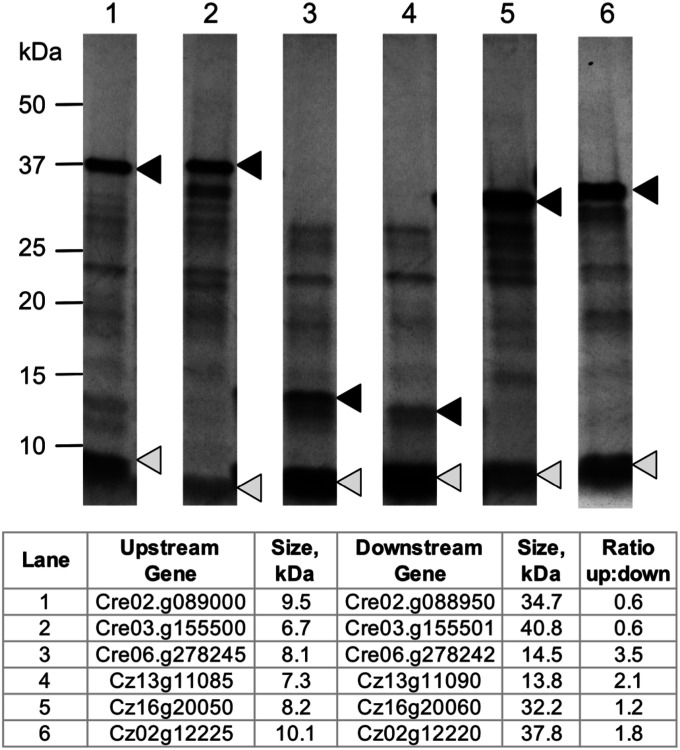
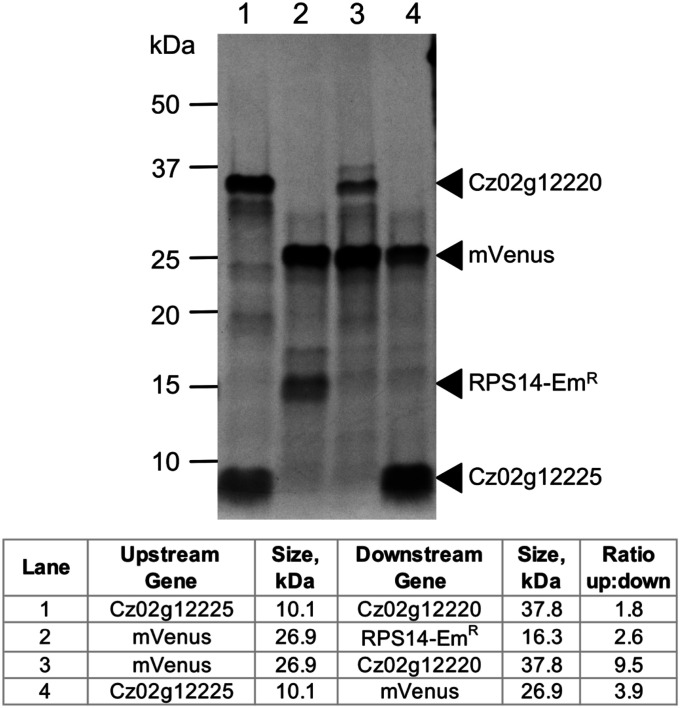
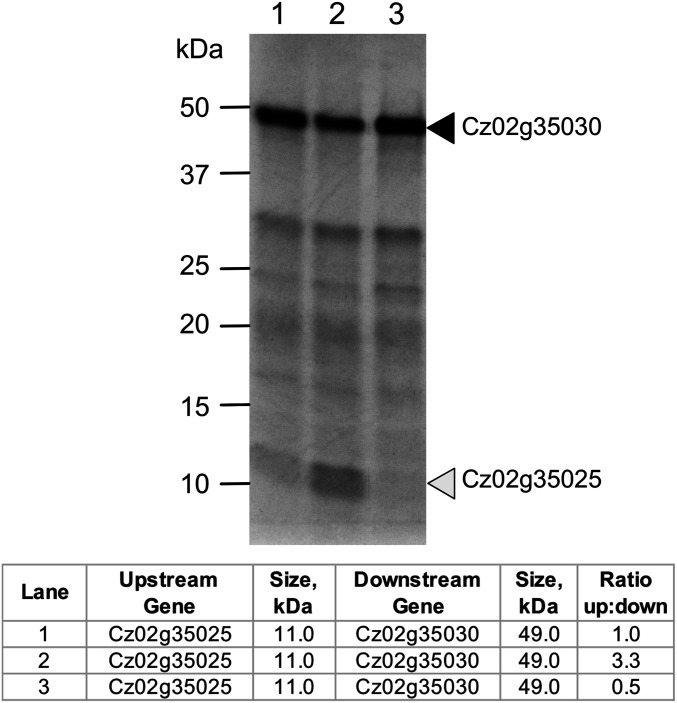
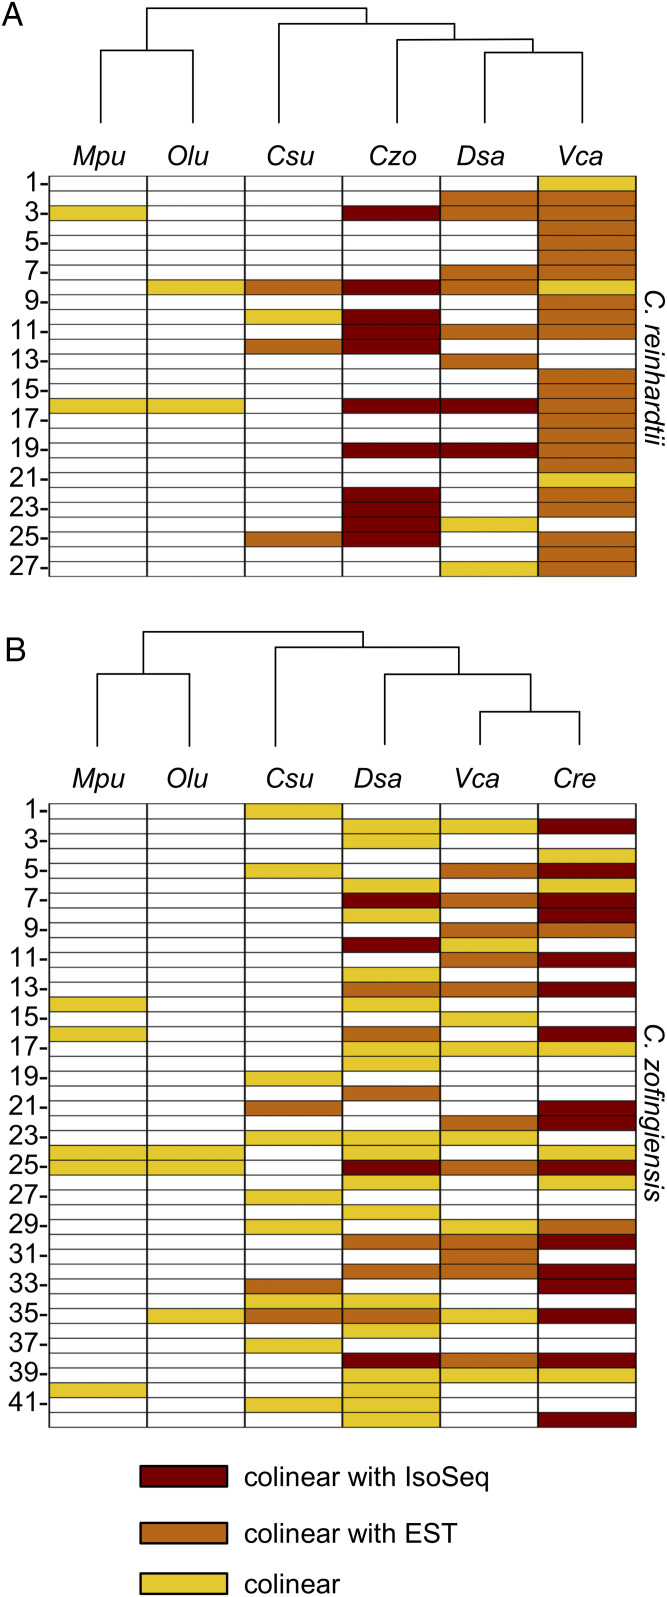
Polycistronic gene expression, common in prokaryotes, was thought to be extremely rare in eukaryotes. The development of long-read sequencing of full-length transcript isomers (Iso-Seq) has facilitated a reexamination of that dogma. Using Iso-Seq, we discovered hundreds of examples of polycistronic expression of nuclear genes in two divergent species of green algae: Chlamydomonas reinhardtii and Chromochloris zofingiensis Here, we employ a range of independent approaches to validate that multiple proteins are translated from a common transcript for hundreds of loci. A chromatin immunoprecipitation analysis using trimethylation of lysine 4 on histone H3 marks confirmed that transcription begins exclusively at the upstream gene. Quantification of polyadenylated [poly(A)] tails and poly(A) signal sequences confirmed that transcription ends exclusively after the downstream gene. Coexpression analysis found nearly perfect correlation for open reading frames (ORFs) within polycistronic loci, consistent with expression in a shared transcript. For many polycistronic loci, terminal peptides from both ORFs were identified from proteomics datasets, consistent with independent translation. Synthetic polycistronic gene pairs were transcribed and translated in vitro to recapitulate the production of two distinct proteins from a common transcript. The relative abundance of these two proteins can be modified by altering the Kozak-like sequence of the upstream gene. Replacement of the ORFs with selectable markers or reporters allows production of such heterologous proteins, speaking to utility in synthetic biology approaches. Conservation of a significant number of polycistronic gene pairs between C. reinhardtii, C. zofingiensis, and five other species suggests that this mechanism may be evolutionarily ancient and biologically important in the green algal lineage.

Keywords: bicistronic; dicistronic; leaky ribosome scanning; transcriptome; uORFs.


Conflict of interest statement

Competing interest statement: S.D.G. and S.S.M. have filed a disclosure entitled “Expressing Multiple Genes from a Single Transcript in Algae and Plants.”

Figures

Fig. 1.
Fig. 1.
Browser view of polycistronic loci in three algal species. Presented here is a display of sequencing data from single-molecule, long-read sequencing of mRNA (Iso-Seq), short-read sequencing of mRNA (RNA-Seq), mass spectrometry analysis of the proteome (peptides), and ChIP-Seq analysis with an H3K4me3 pull down (H3K4me3). Data from each of these analyses were aligned to the appropriate genome assembly for three distantly related algal species: (A) C. reinhardtii, (B) C. zofingiensis, and (C) D. salina. For Iso-Seq, RNA-Seq, and peptides, the strand is indicated by color: plus strand is light blue, and minus strand is pink. Mismatches relative to the genome assembly, including poly(A) tails, are color coded: A = red, C = orange, G = blue, and T = green. Total coverage for each track is shown above reads in gray. For gene models, a thick line indicates the ORF, an intermediate line indicates UTRs, and a thin line indicates introns. (Scale bars: 1 kb.)
Fig. 2.
Fig. 2.
Evidence of polycistronic expression. (A) ChIP-Seq was performed on C. reinhardtii DNA with an antibody to H3K4me3 to identify transcription start sites. A score of H3K4me3 marks relative to input was calculated for each nucleotide in the genome. The mean score for the 500 nt at the 5′ end of each gene model was calculated, and the distribution of these scores is plotted as a box plot for all monocistronic (“mono,” n = 17,594), polycistronic upstream (“poly up,” n = 87), and polycistronic downstream (“poly down,” n = 87) genes. (B) The presence of a UGUAA polyadenylylation signal sequence within the final 100 nt of each computationally annotated gene model was determined for C. reinhardtii for monocistronic (n = 17,594), polycistronic upstream (n = 87), and polycistronic downstream (n = 87) genes. The expected frequency of that sequence within a random 100-nt sequence with the same GC content is plotted as a dashed line. (C) Poly(A) tails were identified by the presence of eight or more sequential A’s in the Iso-Seq reads. The coverage of poly(A)-containing reads was compared with the total coverage of Iso-Seq reads within the 3′-terminal 1,000 nt of each gene model. The distribution of this poly(A)-containing coverage for genes with ≥10 Iso-Seq reads is plotted in box plots for monocistronic (n = 11,658), polycistronic upstream (n = 79), and polycistronic downstream (n = 83) genes for C. reinhardtii. (D) Colinear gene pairs (adjacent genes on the same strand of the same chromosome with ≤20,000 nt between ORFs) were identified, and a Pearson's correlation coefficient (PCC) was calculated for each gene pair across a range of RNA-Seq samples. The distributions of PCC values for C. reinhardtii for monocistronic (n = 10,884) and polycistronic (“poly,” n = 84) gene pairs are plotted as a box plot. (E) An analysis of poly(A) signal sequences was performed on C. zofingiensis for monocistronic (n = 13,585), polycistronic upstream (n = 173), and polycistronic downstream (n = 173) genes as in B. (F) An analysis of poly(A) tailing was performed on C. zofingiensis for monocistronic (n = 11,476), polycistronic upstream (n = 142), and polycistronic downstream (n = 150) genes as in C. (G) An analysis of coexpression was performed on C. zofingiensis for monocistronic (n = 12,284) and polycistronic (n = 215) gene pairs as in D. For box plots, whiskers indicate 1.5 times the interquartile range, and notches indicate the confidence interval of the median. Outliers are plotted as individual points.
Fig. 3.
Fig. 3.
Proteomic analysis validates expression of polycistronic ORFs. Peptides from the proteomes of C. reinhardtii and C. zofingiensis were identified by mass spectrometry of trypsin-digested cell lysates. (A) In order to visualize the peptides identified by this method, the sequences of identified peptides were “reverse translated” into nucleotide sequences in silico and mapped to the appropriate genome. A polycistronic gene pair from C. zofingiensis is presented with peptide and Iso-Seq data plotted against the gene models as in Fig. 1. A C-terminal peptide from the upstream gene and two N-terminal peptides from the downstream gene are highlighted. (B) The percentages of C. reinhardtii genes whose gene product was detected by at least one unambiguously assigned peptide for monocistronic (mono, n = 17,594), polycistronic upstream (poly up, n = 87), and polycistronic downstream (poly down, n = 87) genes are presented in Left under “all peptides.” The subsets of gene products that were detected by an N-terminal or C-terminal peptide are presented under columns labeled “N-term” (Center) and “C-term” (Right), respectively. (C) The percentages of detected proteins from C. zofingiensis are plotted exactly as described for B for monocistronic (n = 13,585), polycistronic up (n = 173), and polycistronic down (n = 173) genes.
Fig. 4.
Fig. 4.
In vitro transcription and translation of polycistronic loci. RNAs corresponding to polycistronic transcripts were synthesized from corresponding DNA templates (Methods) and translated in vitro in wheat germ extracts containing radiolabeled methionine (Met). The products were separated by denaturing polyacrylamide gel electrophoresis and visualized by fluorography. Upstream gene products are indicated by white triangles, and downstream gene products are indicated by black triangles. The polycistronic gene pairs and their expected sizes are presented as a table. Gene identifications from C. reinhardtii begin with “Cre,” and gene identifications from C. zofingiensis begin with “Cz.” The intensities of each band were normalized relative to the number of Met, and the ratios of the upstream to the downstream gene product for each pair are presented in the accompanying table.
Fig. 5.
Fig. 5.
Polycistronic expression of exogenous reporter and drug-selectable proteins. Proteins were in vitro translated from polycistronic transcripts exactly as in Fig. 4. Proteins in lane 1 were translated from the endogenous sequence of a bicistronic locus in C. zofingiensis as a control (same as Fig. 4, lane 6). In lanes 3 and 4, either the upstream ORF or the downstream ORF of that locus was replaced with a yellow fluorescent protein derivative, mVenus. In lane 2, both the upstream ORF and the downstream ORF of a bicistronic locus from C. reinhardtii (Cre10.g466000/Cre10.g465950) were replaced with mVenus and RPS14-EmR, which confers resistance to the drug emetine. The intensities of each band were normalized relative to the number of methionine, and the ratios of the upstream to the downstream gene product for each pair are presented in the accompanying table.
Fig. 6.
Fig. 6.
Manipulating the upstream Kozak-like sequence alters expression. Three different versions of a polycistronic locus from C. zofingiensis were synthesized and subjected to in vitro coupled transcription and translation as in Fig. 4. Each construct contained the same ORFs and inter-ORF sequence for gene 1 (Cz02g35025, 11.0 kDa) and gene 2 (Cz02g35030, 49.0 kDa). Only the nucleotides proximal to the first start codon were altered between the constructs. The construct in lane 1 contained the endogenous Kozak-like sequence, while the constructs in lanes 2 and 3 contained a stronger or weaker Kozak-like sequence, respectively. The intensities of each band were normalized relative to the number of methionine, and the ratios of the upstream to the downstream gene product for each reaction are presented in the accompanying table. Different exposures of this gel are presented in SI Appendix, Fig. S5.
Fig. 7.
Fig. 7.
Conservation of polycistronic loci in other chlorophytes. Pairs of protein sequences encoded on polycistronic transcripts in C. reinhardtii and C. zofingiensis were used as query sequences to search for potential conserved polycistronic loci in other chlorophyte species. Pairs of proteins from 27 of 87 (31%) polycistronic loci in C. reinhardtii had significant sequence similarity (bit score ≥30) to pairs of proteins encoded by colinear ORFs (i.e., adjacent ORFs on the same reading strand) in at least one other chlorophyte species. For C. zofingiensis, this was true for 42 of 173 (24%) polycistronic loci (Dataset S4 has details). These results are summarized for (A) C. reinhardtii and (B) C. zofingiensis, where each row represents a polycistronic locus and each column represents a different chlorophyte species. Yellow bars denote that a colinear pair of ORFs was found in that species with significant similarity to a pair of polycistronic ORFs from C. reinhardtii or C. zofingiensis. For some colinear pairs of ORFs, there was additional Iso-Seq or EST data showing polycistronic transcription of the two ORFs. These are indicated in red and orange, respectively. Columns are ordered by the phylogenetic tree above each panel (SI Appendix, Fig. S6 has details). Species are labeled according to the following code: Cre, C. reinhardtii; Csu, C. subellipsoidea; Czo, C. zofingiensis; Dsa, D. salina; Mpu, M. pusilla; Olu, O. lucimarinus; Vca, V. carteri.

References

    1. Lasda E. L., Blumenthal T., Trans-splicing. Wiley Interdiscip. Rev. RNA 2, 417–434 (2011). - PubMed
    1. García-Ríos M., et al. , Cloning of a polycistronic cDNA from tomato encoding γ-glutamyl kinase and γ-glutamyl phosphate reductase. Proc. Natl. Acad. Sci. U.S.A. 94, 8249–8254 (1997). - PMC - PubMed
    1. Gray T. A., Saitoh S., Nicholls R. D., An imprinted, mammalian bicistronic transcript encodes two independent proteins. Proc. Natl. Acad. Sci. U.S.A. 96, 5616–5621 (1999). - PMC - PubMed
    1. Crosby M. A.et al. .; FlyBase Consortium , Gene model annotations for Drosophila melanogaster: The rule-benders. G3 (Bethesda) 5, 1737–1749 (2015). - PMC - PubMed
    1. Pauli D., Tonka C. H., Ayme-Southgate A., An unusual split Drosophila heat shock gene expressed during embryogenesis, pupation and in testis. J. Mol. Biol. 200, 47–53 (1988). - PubMed

Publication types

MeSH terms