. 2021;10(1):53-74.
doi: 10.3233/JHD-200433.

Approaches to Sequence the HTT CAG Repeat Expansion and Quantify Repeat Length Variation

Affiliations

Approaches to Sequence the HTT CAG Repeat Expansion and Quantify Repeat Length Variation

Marc Ciosi et al. J Huntingtons Dis. 2021.

Abstract

Background: Huntington's disease (HD) is an autosomal dominant neurodegenerative disorder caused by the expansion of the HTT CAG repeat. Affected individuals inherit ≥36 repeats and longer alleles cause earlier onset, greater disease severity and faster disease progression. The HTT CAG repeat is genetically unstable in the soma in a process that preferentially generates somatic expansions, the proportion of which is associated with disease onset, severity and progression. Somatic mosaicism of the HTT CAG repeat has traditionally been assessed by semi-quantitative PCR-electrophoresis approaches that have limitations (e.g., no information about sequence variants). Genotyping-by-sequencing could allow for some of these limitations to be overcome.

Objective: To investigate the utility of PCR sequencing to genotype large (>50 CAGs) HD alleles and to quantify the associated somatic mosaicism.

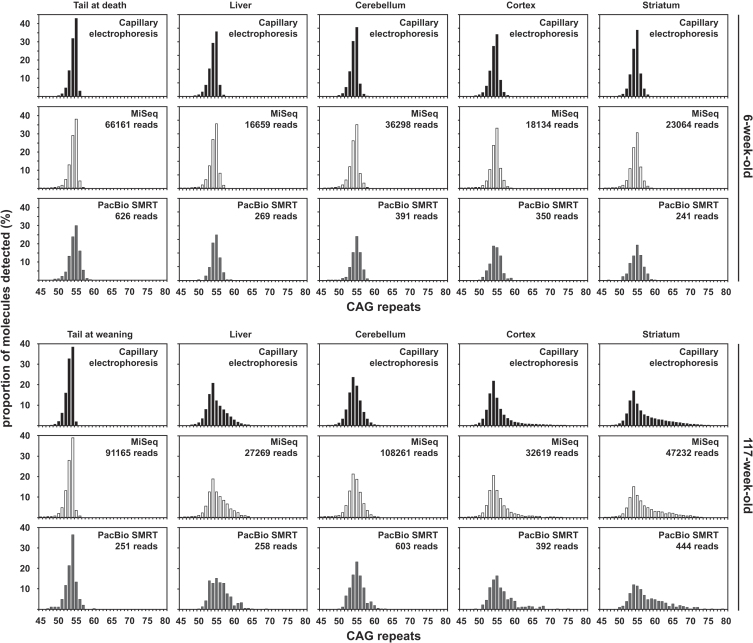
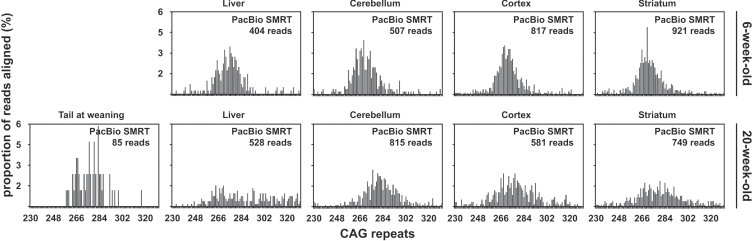
Methods: We have applied MiSeq and PacBio sequencing to PCR products of the HTT CAG repeat in transgenic R6/2 mice carrying ∼55, ∼110, ∼255 and ∼470 CAGs. For each of these alleles, we compared the repeat length distributions generated for different tissues at two ages.

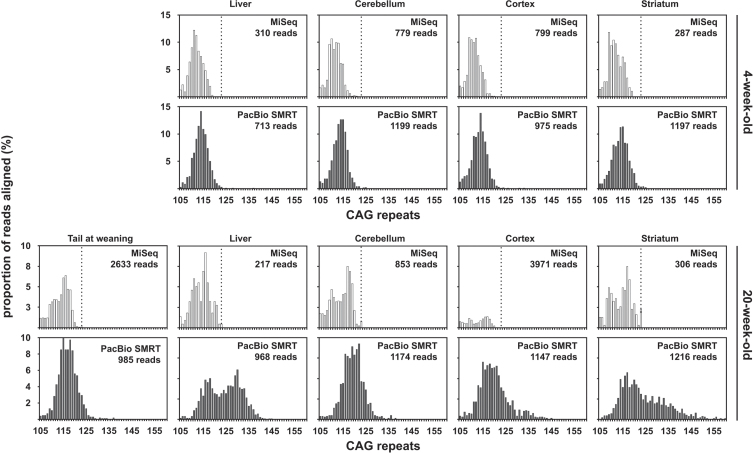
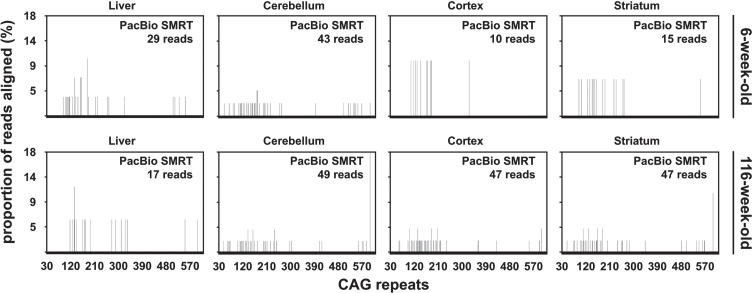
Results: We were able to sequence the CAG repeat full length in all samples. However, the repeat length distributions for samples with ∼470 CAGs were biased towards shorter repeat lengths.

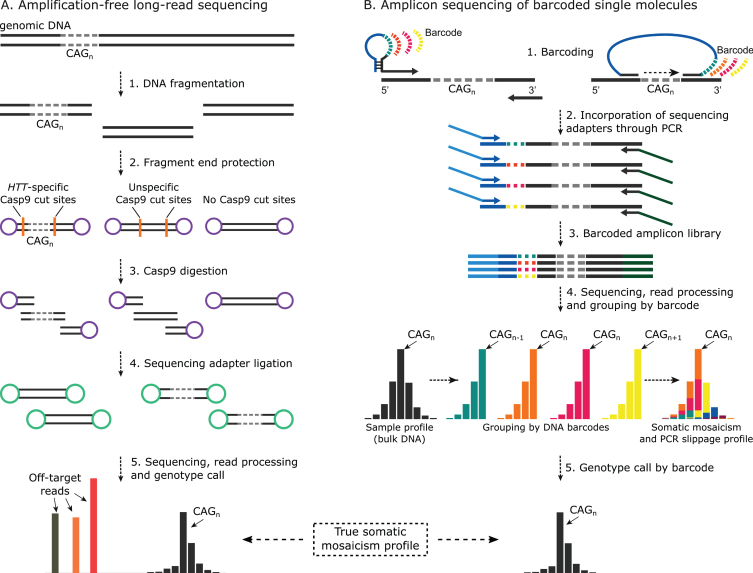
Conclusion: PCR sequencing can be used to sequence all the HD alleles considered, but this approach cannot be used to estimate modal allele size or quantify somatic expansions for alleles ⪢250 CAGs. We review the limitations of PCR sequencing and alternative approaches that may allow the quantification of somatic contractions and very large somatic expansions.

Keywords: Huntington disease; Somatic mosaicism; huntingtin; parallel sequencing; repeat expansion.


Conflict of interest statement

V.C.W. is a scientific advisory board member of Triplet Therapeutics, a company developing new therapeutic approaches to address triplet repeat disorders such as HD and myotonic dystrophy and of LoQus23 Therapeutics, and has provided paid consulting services to Alnylam. Her financial interests in Triplet Therapeutics were reviewed and are managed by Massachusetts General Hospital and Partners HealthCare in accordance with their conflict of interest policies. S.K. is employed by CHDI Management, Inc., as an advisor to the CHDI Foundation. D.G.M. has been a scientific consultant and/or received honoraria or stock options from Biogen Idec, AMO Pharma, Charles River, Vertex Pharmaceuticals, Triplet Therapeutics, LoQus23, and Small Molecule RNA and has had research contracts with AMO Pharma and Vertex Pharmaceuticals.

Figures

Fig. 1
Fig. 1
Qualitative assessment of somatic mosaicism comparing CAG frequency distributions obtained by capillary electrophoresis, MiSeq or PacBio SMRT sequencing of bulk-PCR products obtained for different tissues of one 6-week-old and one 117-week-old R6/2 mouse with ∼55 CAGs. Capillary electrophoresis data in black, MiSeq sequencing data in white and PacBio SMRT sequencing data in grey.
Fig. 2
Fig. 2
Representative sequence alignments of the 400 nt MiSeq reads (A and B), PacBio CCS reads (C and D) and PacBio subreads (E and F) uniquely aligned (i.e., reads not discarded post alignment) to a synthetic reference sequence with 115 CAGs. Alignments shown correspond to 30 sequencing reads obtained from the tail at weaning of the 20-week-old mouse with ∼110 CAGs. The part of the alignment shown corresponds to the four nucleotides in the immediate 5’–flank of the HTT CAG repeat, followed by the first 20 CAGs (A, C and E), as well as the last 7 CAGs followed by (CAACAG)1(CCGCCA)1(CCG)7(CCT)2 and the four nucleotides in the immediate 3’-flank of that sequence (B, D and F). Note that the last nucleotide sequenced for the sample with the 400 nt MiSeq reads end was the first C of the seventh CCG (B). The white box on the right-hand side of panel B represents the part of the PCR products containing 115 CAGs that could not be sequenced using 400 nt MiSeq reads.
Fig. 3
Fig. 3
SP-PCR can detect very large HTT CAG somatic expansions (≥90 CAGs) that cannot be detected using bulk-PCR approaches. A) Representative small pool PCR autoradiograph from 150 pg template DNA obtained for the striatum of the 117-week-old R6/2 mouse with ∼55 CAGs. The number of CAG repeats, equivalent to each molecular weight marker (left) and the boundaries of the categories represented in panel A (right), is indicated. The boundaries of the categories represented in panel A (right) are also indicated by white dashed lines. B) Percentage of large (≥70 CAGs) HTT CAG somatic expansions detected by SP-PCR (black to white gradient), or bulk-PCR capillary electrophoresis (black), bulk-PCR MiSeq (white), bulk-PCR PacBio SMRT (grey) in the striatum of the 117-week-old R6/2 mouse with progenitor allele ∼55 CAGs. C: HTT CAG somatic expansions >90 CAGs from panel B. Error bars indicate the 95% confidence intervals (they could not be estimated for the bulk-PCR capillary electrophoresis because the fluorescence units measured cannot be transformed into a count of PCR products detected).
Fig. 4
Fig. 4
CAG frequency distributions obtained by MiSeq or PacBio SMRT sequencing of bulk-PCR products obtained for different tissues of one 6-week-old and one 117-week-old R6/2 mouse with ∼110 CAGs. MiSeq sequencing data in white and PacBio SMRT sequencing data in grey. The dotted line on the MiSeq sequencing data panels indicates 123 CAGs, which is the theoretical maximum number of CAGs that could have been sequenced using the PCR primer pair (31329/33934) and a 400 nt MiSeq read.
Fig. 5
Fig. 5
CAG frequency distributions obtained by PacBio SMRT sequencing of bulk-PCR products obtained for different tissues of one 6-week-old and one 20-week-old R6/2 mouse with ∼255 CAGs. The tail at weaning data for the 20-week-old mouse is not shown because only two reads with 266 and 274 CAGs were obtained post-alignment and post-discard.
Fig. 6
Fig. 6
CAG frequency distributions obtained by PacBio SMRT sequencing of bulk-PCR products obtained for different tissues of one 6-week-old and one 116-week-old R6/2 mouse with ∼470 CAGs.
Fig. 7
Fig. 7
Method summary for somatic mosaicism quantification at the level of a single molecule in HD. A) Generalised schematics for CRISPR/Casp9-mediated targeted enrichment of HTT locus for single-molecule long-read sequencing (i.e., no-amp targeted sequencing). Following DNA fragmentation and DNA molecule protection by adapter ligation or de-phosphorylation, CRISPR/Cas9 and locus-specific guide RNAs are used to selectively cut across the region of interest. While undigested DNA fragment ends are still protected, sequencing adapters are ligated to the Cas9 digestion product. Sequencing is then done on the appropriate single-molecule long-read sequencing platform such as PacBio SMRT or Oxford Nanopore Technologies (ONT). No-amp targeted sequencing studies of repeat expansions have used one or two Cas9 cuts with PacBio sequencing [31, 49, 57, 59] or ONT sequencing [58] respectively. Single-molecule sequencing read output can then be used to build the somatic mosaicism profile. B) The general method for amplicon sequencing of barcoded single molecules. Several methods for single-molecule barcoding exist, including one-cycle PCR using hairpin-protected primers with degenerate tags or region capture by barcoded molecular inversion probes. Following barcoding, sequencing adapters are incorporated into the uniquely tagged molecules through PCR with overhang primers. The resulting amplicon library is then sequenced on the platform of interest, including Illumina MiSeq or PacBio, depending on the amplicon length and the desired throughput. Resulting reads are grouped by barcode family, and the repeat length of the original molecule for each family is determined to build the real somatic mosaicism profile per sample.

References

    1. Aziz NA, van der Burg JMM, Tabrizi SJ, Landwehrmeyer GB. Overlap between age-at-onset and disease-progres-ion determinants in Huntington disease. Neurology. 2018;90(24):e2099–e106. doi: 10.1212/wnl.0000000000005690 - DOI - PMC - PubMed
    1. Donaldson J, Powell S, Rickards N, Holmans P, Jones L. What is the pathogenic CAG expansion length in Huntington’s disease? J Huntingtons Dis. 2020;doi: 10.3233/JHD-200445 - DOI - PMC - PubMed
    1. Hong EP, MacDonald ME, Wheeler VC, Jones L, Holmans P, Orthe M, et al. Huntington’s disease pathogenesis: Two sequential components. J Huntingtons Dis. 2020;doi: 10.3233/JHD-200427 - DOI - PMC - PubMed
    1. Duyao M, Ambrose C, Myers R, Novelletto A, Persichetti F, Frontali M, et al. Trinucleotide repeat length instability and age of onset in Huntington’s disease. Nat Genet. 1993;4(4):387–92. doi: 10.1038/ng0893-387 - DOI - PubMed
    1. Monckton DG. Somatic expansion of the CAG repeat in Huntington disease: An historical perspective. J Huntingtons Dis. 2020;doi: 10.3233/JHD-200429 - DOI - PMC - PubMed

Publication types