. 2021;11(2):585-603.
doi: 10.3233/JPD-202351.

T Cells Limit Accumulation of Aggregate Pathology Following Intrastriatal Injection of α-Synuclein Fibrils

Affiliations

T Cells Limit Accumulation of Aggregate Pathology Following Intrastriatal Injection of α-Synuclein Fibrils

Sonia George et al. J Parkinsons Dis. 2021.

Abstract

Background: α-Synuclein (α-syn) is the predominant protein in Lewy-body inclusions, which are pathological hallmarks of α-synucleinopathies, such as Parkinson's disease (PD) and multiple system atrophy (MSA). Other hallmarks include activation of microglia, elevation of pro-inflammatory cytokines, as well as the activation of T and B cells. These immune changes point towards a dysregulation of both the innate and the adaptive immune system. T cells have been shown to recognize epitopes derived from α-syn and altered populations of T cells have been found in PD and MSA patients, providing evidence that these cells can be key to the pathogenesis of the disease.ObjectiveTo study the role of the adaptive immune system with respect to α-syn pathology.

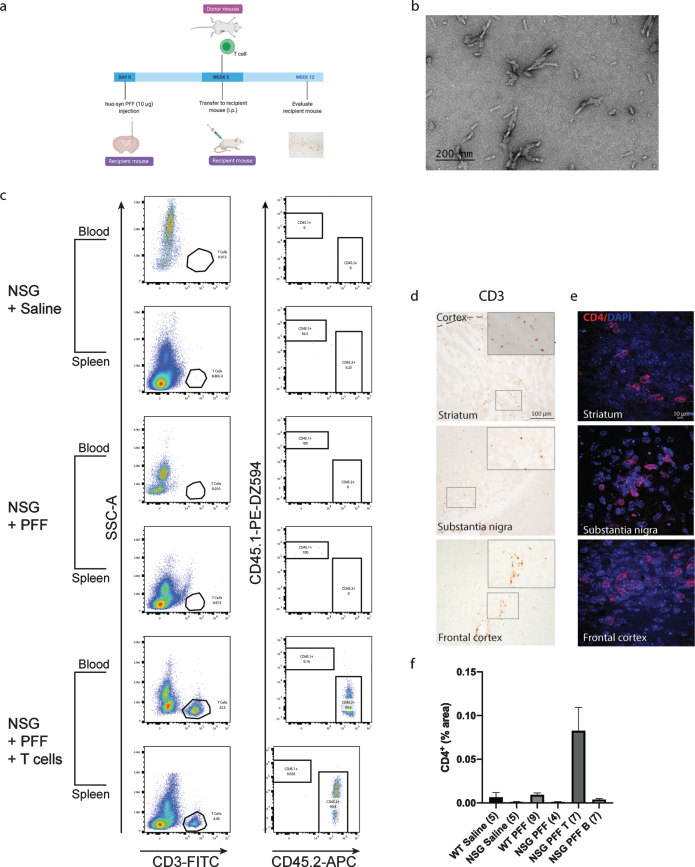
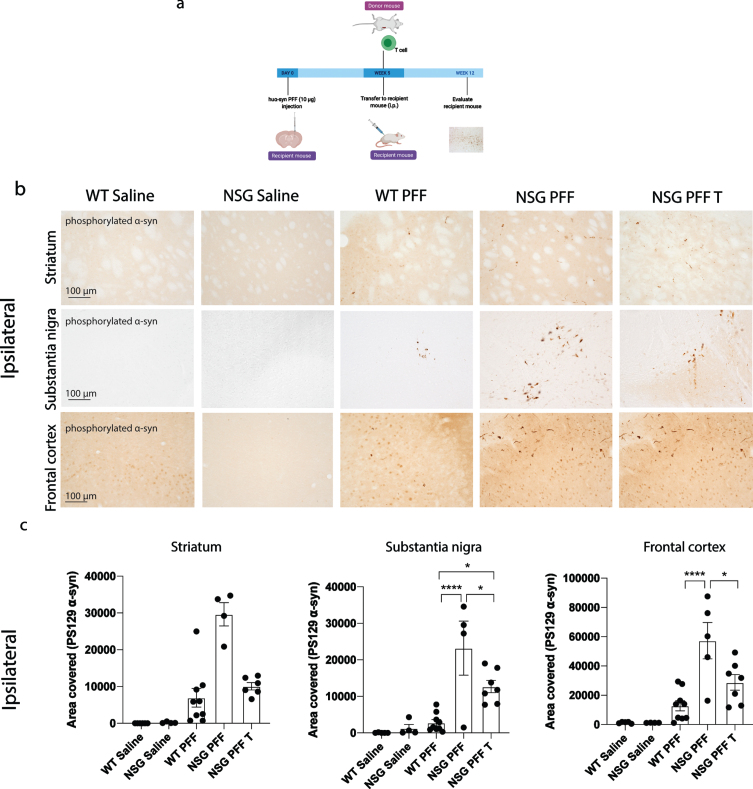
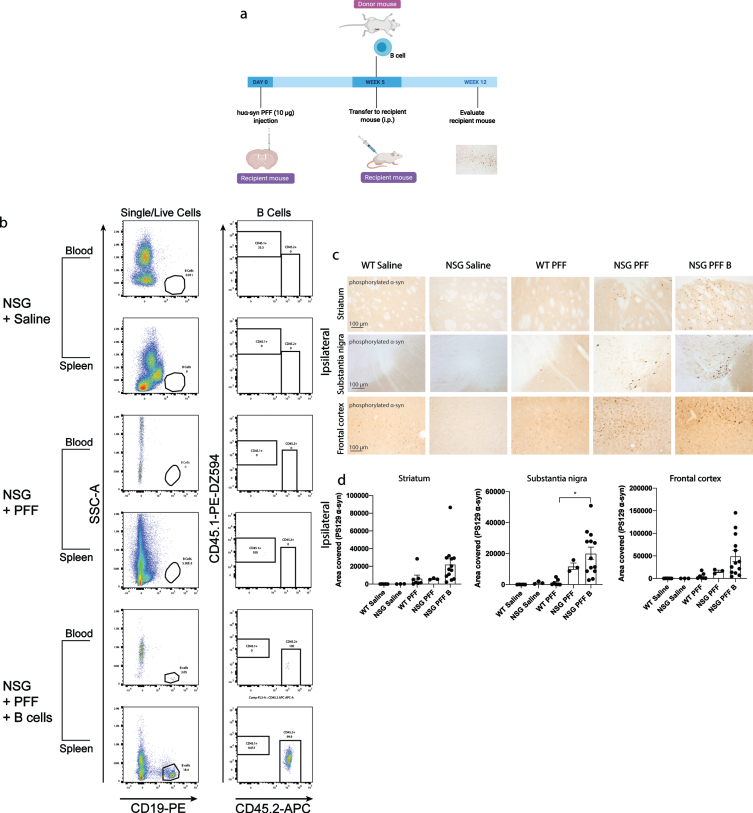
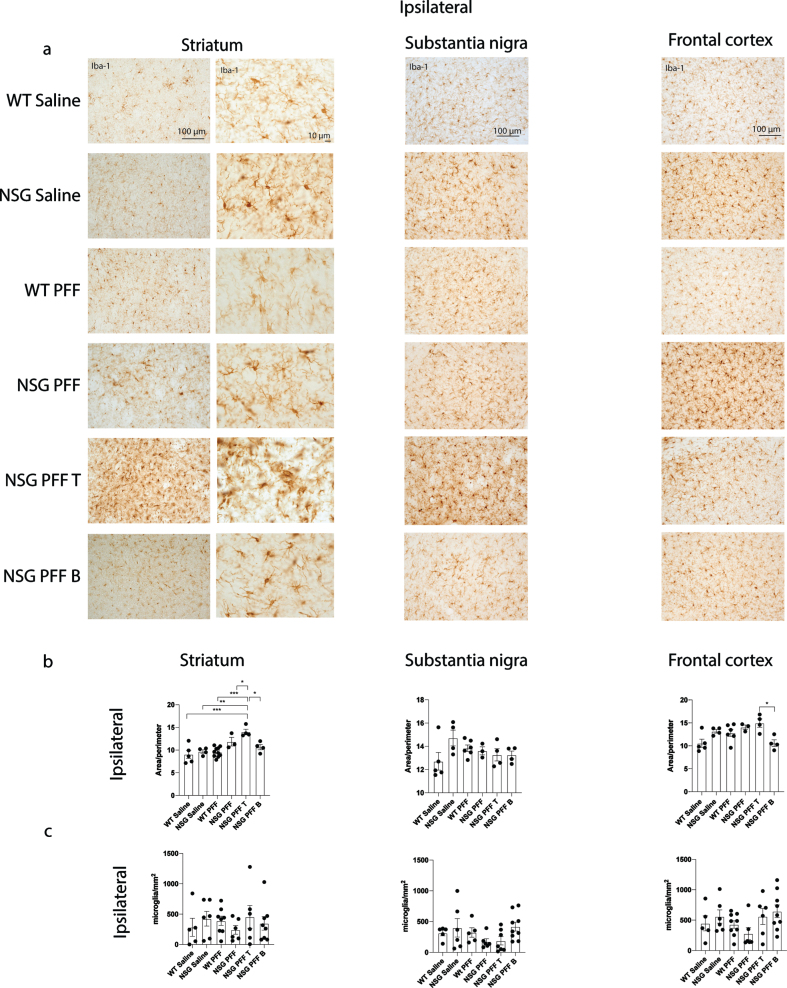
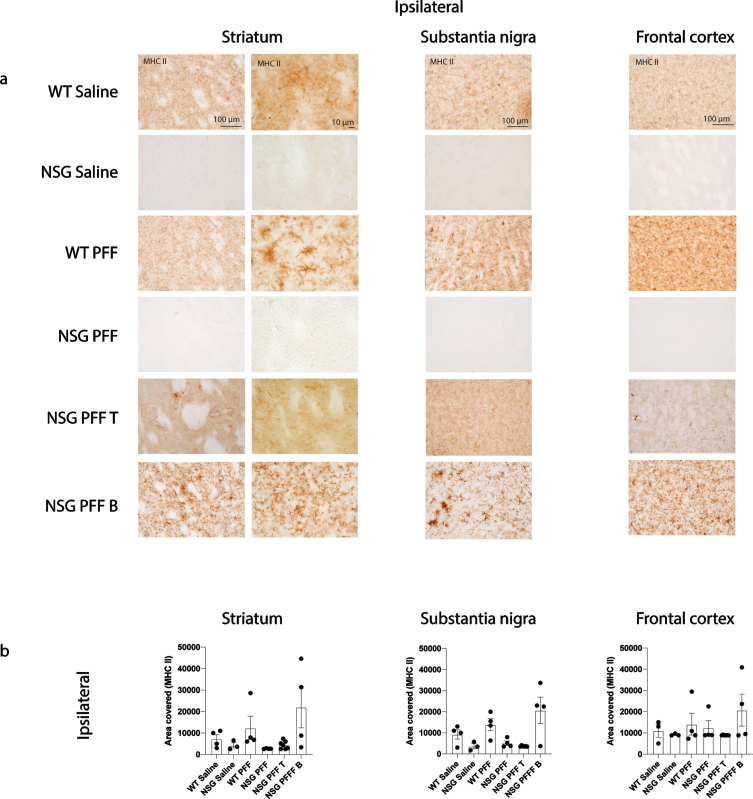
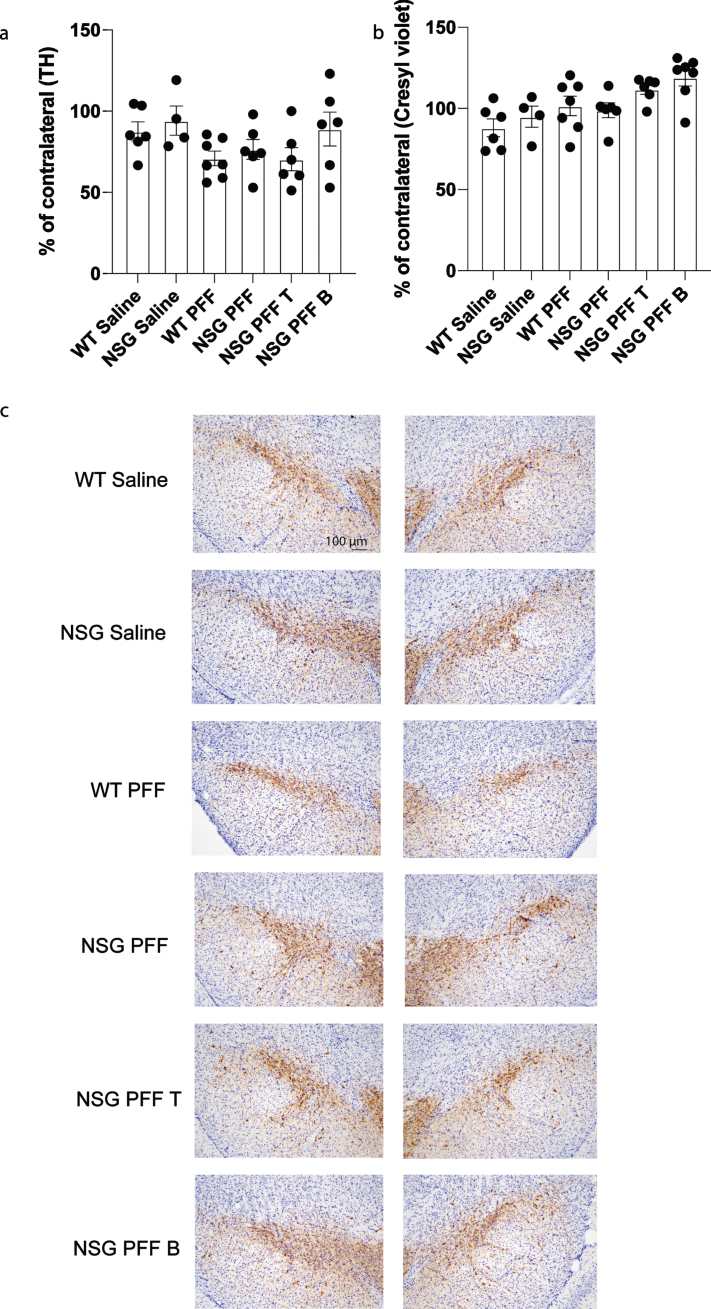
Methods: We injected human α-syn preformed fibrils (PFFs) into the striatum of immunocompromised mice (NSG) and assessed accumulation of phosphorylated α-syn pathology, proteinase K-resistant α-syn pathology and microgliosis in the striatum, substantia nigra and frontal cortex. We also assessed the impact of adoptive transfer of naïve T and B cells into PFF-injected immunocompromised mice.

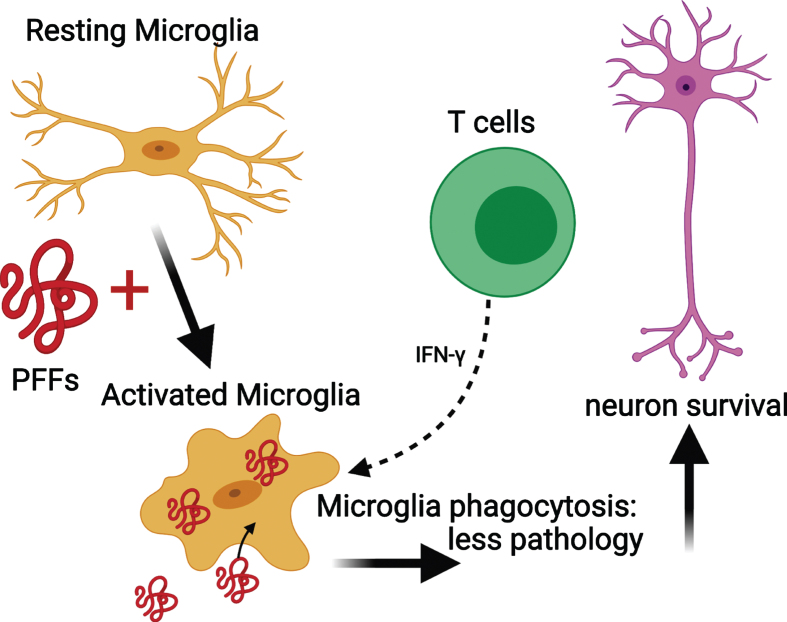
Results: Compared to wildtype mice, NSG mice had an 8-fold increase in phosphorylated α-syn pathology in the substantia nigra. Reconstituting the T cell population decreased the accumulation of phosphorylated α-syn pathology and resulted in persistent microgliosis in the striatum when compared to non-transplanted mice.

Conclusion: Our work provides evidence that T cells play a role in the pathogenesis of experimental α-synucleinopathy.

Keywords: Parkinson’s disease; T lymphocytes; alpha-synuclein; microglia; multiple system atrophy; phosphorylated alpha-synuclein.


Conflict of interest statement

PB has received commercial support as a consultant from Axial Biotherapeutics, Calico, CuraSen, Fujifilm-Cellular Dynamics International, Idorsia, IOS Press Partners, LifeSci Capital LLC, Lundbeck A/S and Living Cell Technologies LTD. He has received commercial support for grants/research from Lundbeck A/S and Roche. He has ownership interests in Acousort AB and Axial Biotherapeutics and is on the steering committee of the NILO-PD trial. The authors declare no additional competing financial interests.

Figures

Fig. 1
Fig. 1
T cells in the blood, spleen and brain following adoptive transfer. a) Timeline of the experiment. b) PFFs were sonicated and validated by transmission electron microscopy. c) Flow cytometric analysis. Wildtype mice contained populations of T and B cells that are CD45.2 positive. NSG mice did not contain T and B cell populations. Following adoptive transfer of T cells to NSG mice, CD45.2+ CD3+ T cells were detected. Representative plots are shown for each treatment condition. d) Representative images from the mouse striatum, substantia nigra and frontal cortex staining positive for CD3+T cells in mice that received adoptive transfer of T cells. e) Immunofluorescent staining for CD4+ T cells in the striatum, substantia nigra and frontal cortex. f) Percentage area of tissue that is positive for CD4 signal in striatum, substantia nigra and frontal cortex combined. Scale bar: 500μm and 10μm. Schematic created with BioRender.com.
Fig. 2
Fig. 2
Reduced phosphorylated α-syn pathology in immunocompromised mice that received adoptive transfer of T cells. a) Timeline of experiment. b) Phosphorylated α-syn was detected in the ipsilateral hemisphere to PFF injection in the striatum, substantia nigra and frontal cortex. The reconstitution of T cells was conducted in two separate experiments and the results pooled after results of the reduction in phosphorylated α-syn were shown to be consistent between the two experiments. c) Densitometry of 5–9 mice per group to determine the area covered in phosphorylated α-syn levels in the ipsilateral striatum, substantia nigra and frontal cortex. Wildtype Saline, n = 5; NSG Saline n = 5, wildtype PFF, n = 9; NSG PFF, n = 5; NSG PFF T n = 7). d) Statistical analyses were performed by Kruskal-Wallis test *p < 0.05, ****p < 0.001. Scale bar: 100μm. Schematic created with BioRender.com.
Fig. 3
Fig. 3
Adoptive transfer of B cells alone did not alter phosphorylated α-syn pathology in immunocompromised mice. a) Timeline of experiment. b) Flow cytometric analysis of mouse spleen and blood following adoptive transfer demonstrated that wildtype mice contain populations of T and B cells that are CD3 and CD19 positive. NSG mice do not have T and B cell populations. Following adoptive transfer of B cells, NSG mice contained CD45.2+ CD19+ B cells. Representative plots are shown for each treatment condition. c) Phosphorylated α-syn was detected in the ipsilateral striatum, substantia nigra and frontal cortex. d) Densitometry of 3–9 mice per group to determine the area covered in phosphorylated α-syn levels in the ipsilateral striatum, substantia nigra and frontal cortex. Wildtype Saline, n = 5; NSG Saline n = 3, wildtype PFFs, n = 3; NSG PFFs, n = 3; NSG PFF B n = 12). The error bars represent S.E.M. Statistical analyses were performed by Kruskal-Wallis test *p < 0.01. Scale bar: 100μm. Schematic created with BioRender.com
Fig. 4
Fig. 4
Microgliosis in the brain of α-syn PFFs injected mice. a) Representative images of Iba-1 immunoreactive microglia were present in the ipsilateral striatum, substantia nigra and frontal cortex of saline and PFFs injected mice. High magnification examples of Iba-1 immunoreactive microglia in the striatum. b) Quantification of microglia morphology and c) microglia numbers/mm2 in the ipsilateral hemisphere to PFF injection in the striatum, substantia nigra and frontal cortex (area/perimeter). Wildtype Saline, n = 5; NSG Saline n = 4–6, wildtype PFFs, n = 6–10; NSG PFFs, n = 3–5; NSG PFF T n = 4–7; NSG PFF B n = 4–9).
Fig. 5
Fig. 5
MHC II in the brain of α-syn PFFs injected mice. a) Representative images of MHC II immunoreactive cells in the ipsilateral striatum, substantia nigra and frontal cortex of saline and PFFs injected mice. High magnification examples of MHC II immunoreactive microglia in the striatum. b) Densitometry of 3–7 mice per group to determine MHCII levels in the ipsilateral striatum, substantia nigra and frontal cortex. Wildtype Saline, n = 3; NSG Saline n = 3, wildtype PFFs, n = 4; NSG PFFs, n = 4; NSG PFF T n = 7; PFF B n = 4). Statistical analyses were performed by Kruskal-Wallis test. *p < 0.05, **p < 0.01, ***p < 0.001. Scale bar: 100μm.
Fig. 6
Fig. 6
Stereological counts of saline and PFFs injected wildtype and NSG mice. a) Tyrosine Hydroxylase (TH) positive cells as percentage of the contralateral hemisphere. b) Cresyl violet stained cells as percentage of the contralateral hemisphere. c) Nigral sections stained with TH and cresyl violet. Wildtype Saline, n = 6; NSG Saline n = 4, wildtype PFFs, n = 7; NSG PFFs, n = 6; NSG PFF T n = 6; PFF B n = 7). The error bars represent S.E.M. Statistical analyses were performed by Kruskal-Wallis test.
Fig. 7
Fig. 7
Mechanism for the reduced phosphorylated α-syn pathology in immunocompromised mice that received adoptive transfer of T cells. PFFs activate resting microglia to become active and phagocytose PFFs. The presence of T cells releasing IFN-γ helps to further activate microglia and enhance phagocytosis. This results in less pathology and neuronal survival. Schematic created with BioRender.com.

References

    1. Hirsch EC, Vyas S, Hunot S (2012) Neuroinflammation in Parkinson’s disease. Parkinsonism Relat Disord 18, S210–S212. - PubMed
    1. Wakabayashi K, Yoshimoto M, Tsuji S, Takahashi H (1998) α-Synuclein immunoreactivity in glial cytoplasmic inclusions in multiple system atrophy. Neurosci Lett 249, 180–182. - PubMed
    1. Rydbirk R, Elfving B, Andersen MD, Langbøl MA, Folke J, Winge K, Pakkenberg B, Brudek T, Aznar S (2017) Cytokine profiling in the prefrontal cortex of Parkinson’s Disease and Multiple System Atrophy patients. Neurobiol Dis 106, 269–278. - PubMed
    1. Tan EK, Chao YX, West A, Chan LL, Poewe W, Jankovic J (2020) Parkinson disease and the immune system —associations, mechanisms and therapeutics. Nat Rev Neurol 16, 303–318. - PubMed
    1. Steiner JA, Quansah E, Brundin P (2018) The concept of alpha-synuclein as a prion-like protein: Ten years after. Cell Tissue Res 373, 161–173. - PMC - PubMed

Publication types

Substances