. 2021 Feb 12;12(1):979.
doi: 10.1038/s41467-021-21204-5.

PRMT5 inhibition disrupts splicing and stemness in glioblastoma

Affiliations

PRMT5 inhibition disrupts splicing and stemness in glioblastoma

Patty Sachamitr et al. Nat Commun. .

Abstract

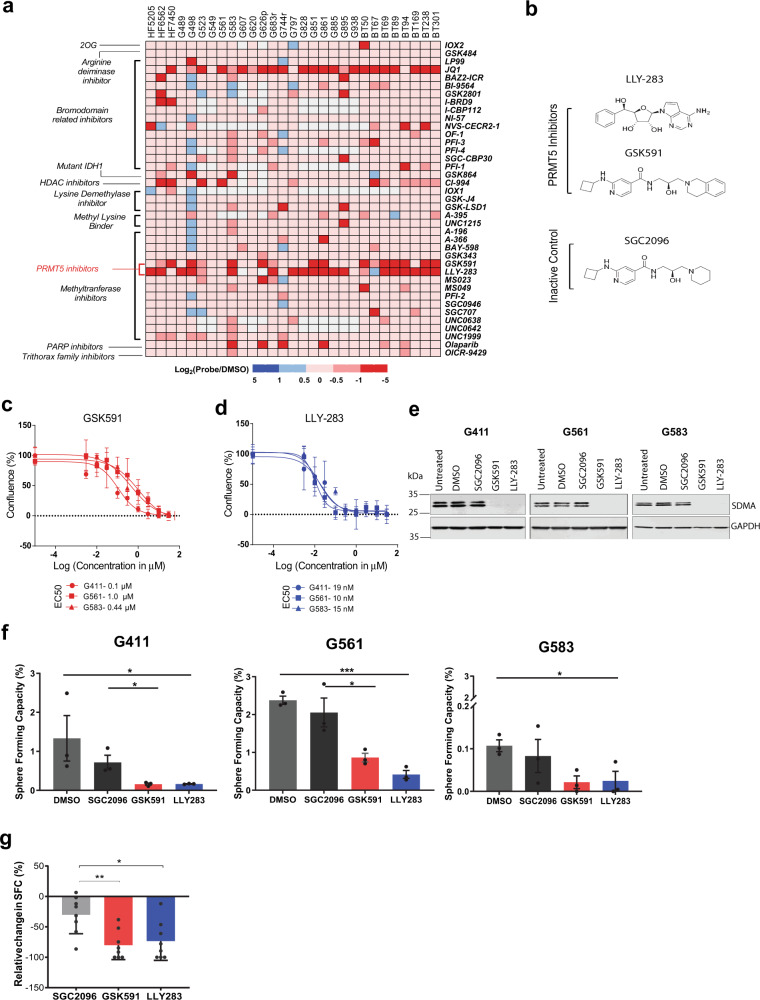
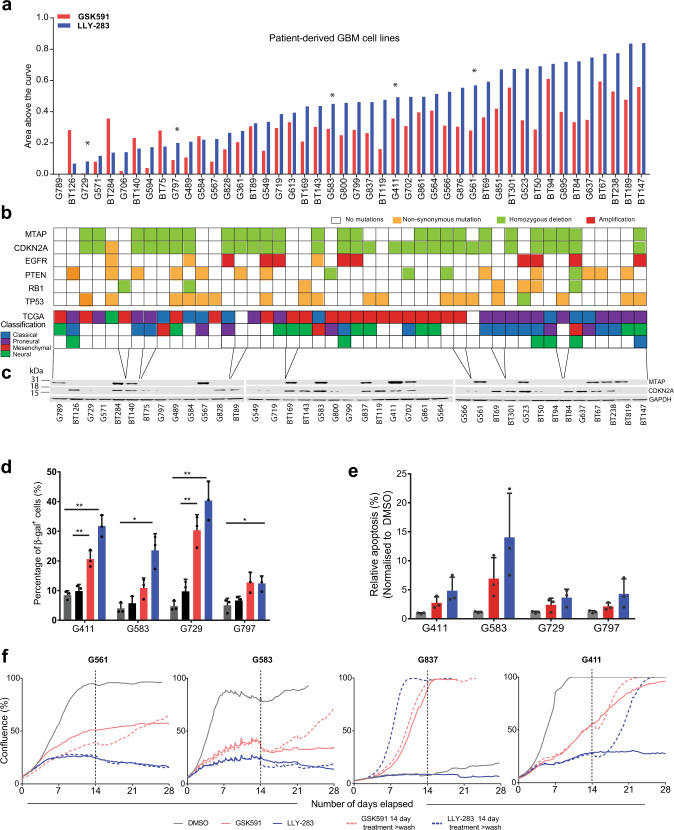
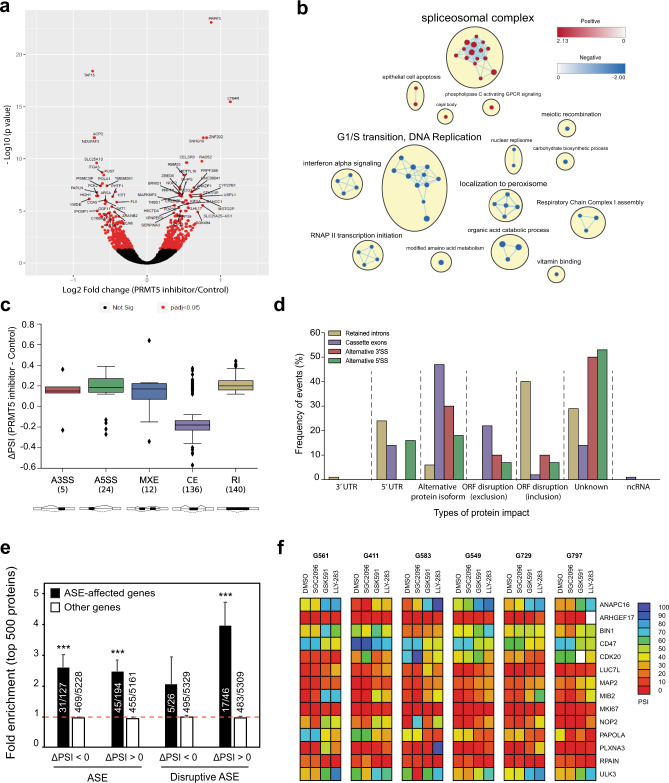
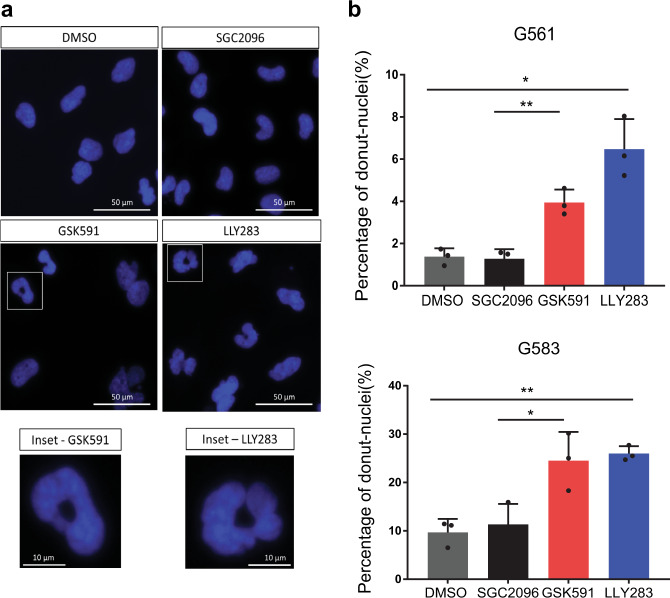
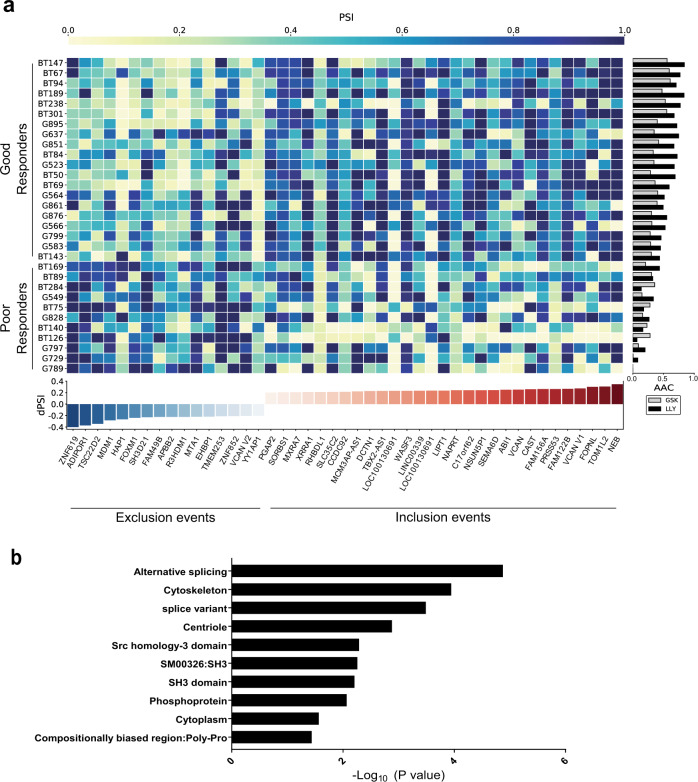
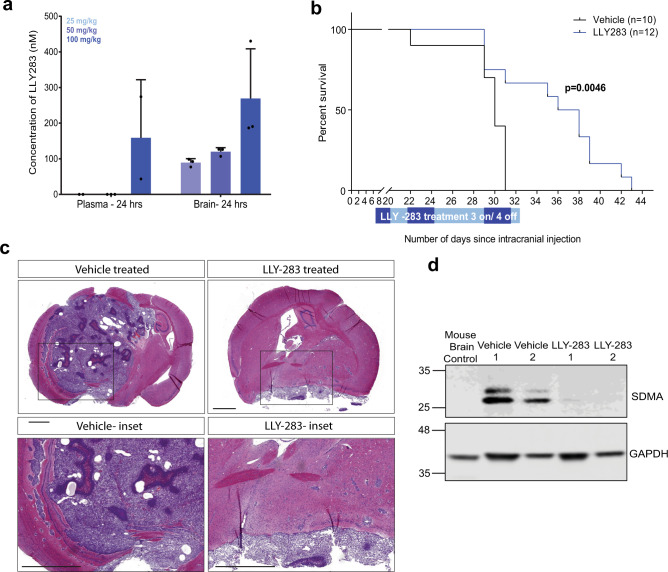
Glioblastoma (GBM) is a deadly cancer in which cancer stem cells (CSCs) sustain tumor growth and contribute to therapeutic resistance. Protein arginine methyltransferase 5 (PRMT5) has recently emerged as a promising target in GBM. Using two orthogonal-acting inhibitors of PRMT5 (GSK591 or LLY-283), we show that pharmacological inhibition of PRMT5 suppresses the growth of a cohort of 46 patient-derived GBM stem cell cultures, with the proneural subtype showing greater sensitivity. We show that PRMT5 inhibition causes widespread disruption of splicing across the transcriptome, particularly affecting cell cycle gene products. We identify a GBM splicing signature that correlates with the degree of response to PRMT5 inhibition. Importantly, we demonstrate that LLY-283 is brain-penetrant and significantly prolongs the survival of mice with orthotopic patient-derived xenografts. Collectively, our findings provide a rationale for the clinical development of brain penetrant PRMT5 inhibitors as treatment for GBM.


Conflict of interest statement

Z.Q.B. is an employee of Eli Lilly and Company. All other authors declare no competing interests.

Figures

Fig. 1
Fig. 1. Small molecule inhibition of PRMT5 impairs both proliferation and self-renewal in GSCs.
a Cell confluence heatmap of small molecule epigenetic screen showing significant inhibition of GSC proliferation by PRMT5 inhibitors. The screen was performed on 26 GSC lines and 3 control cell lines against 39 epigenetic chemical probes at 1 μM final concentration. Cells were grown adherently for 12–14 days and scored for confluence using high-throughput live-cell imaging. Data are represented as log2 (confluence with probe/confluence with DMSO). Red squares indicate decrease in cell confluence and blue squares indicate increase in confluence relative to vehicle. White squares indicate probe and cell line combinations that were not screened. b Chemical structures of the PRMT5 inhibitors, GSK591 and LLY-283, alongside the inactive control, SGC2096. c, d Percentage confluence of three GSC lines upon treatment with GSK591 (c—red) and LLY-283 (d—blue), with doses ranging from 3 nM to 30 μM. Dose response is calculated after 9–12 days of treatment with inhibitors/controls (until control wells are confluent). Data shown are representative of three independent experiments, mean ± SD. e Western blots of the SDMA mark on the SmB/B’ protein in three representative GSC lines G411, G561, and G583 following 5-day treatment with 1 μM of GSK591, LLY-283, SGC2096, or DMSO control. The western blot experiments were reproduced at least three independent times using cell lysates from different biological replicates. f Limiting dilution analysis (LDA) performed on three GSC lines treated with 1 μM of the PRMT5 inhibitors, GSK591 and LLY-283, and controls, SGC2096 and DMSO, for 14 days. Data show the percentage of sphere-forming capacity. n = 3 biologically independent samples, mean ± SEM. Two-tailed Unpaired t test, p values: G411-GSK/SGC = 0.0396, G561-LLY/DMSO = 0.0002, G561-GSK/SGC = 0.0400, G583-LLY/DMSO = 0.0350, G583-GSK/SGC = 0.2127. g Summary of limiting dilution analysis (LDA) performed on freshly dissociated GBM cells from 9 patients treated with 1 μM of the PRMT5 inhibitors, GSK591 and LLY-283, and controls, SGC2096 and DMSO, for 21 days. The y-axis shows the percentage relative change in sphere-forming capacity (normalized to DMSO). N = 9 biologically independent patient-derived GBM samples, mean ± SEM, individual data per sample are shown in Supplementary Fig. 1f. Two-tailed unpaired t test with Welch’s correction. p values: LLY283/SGC2096 = 0.0157, GSK591/SGC2096 = 0.0031. *p < 0.05; **p < 0.01; ***p < 0.001. Source data are provided as a Source data file.
Fig. 2
Fig. 2. GSC lines show differential sensitivities to PRMT5 inhibition.
a Area above the curve (AAC) calculated from dose–response assays across 46 patient-derived GSC lines for GSK591 (red) and LLY-283 (blue) over a range of compound concentrations from 3 nM to 30 μM. DMSO was used as a control. A higher AAC represents greater sensitivity. Asterisk (*) denotes lines studied in more detail in this paper. b Common genomic alterations (derived from whole-genome sequencing data), found in 46 patient-derived GSC lines alongside the TCGA classification for each line (in the order of decreasing GSEA enrichment). GSC lines are ordered as in a. c Western blots for MTAP, CDKN2A, and GAPDH expression across the panel of GSC lines (ordered by increasing response to PRMT5 inhibitors and roughly aligned with b). The full GSC line panel experiment was run once, albeit a subset of GSC lines were run twice with similar results. d Quantification of senescence-associated β-galactosidase-positive cells in four representative GSC lines. Cells were treated with 1 μM of the PRMT5 inhibitors, GSK591 and LLY-283, and controls, SGC2096 and DMSO, for 5 days. n = 3, mean ± SD. Two-tailed unpaired t test with Welch’s correction. p values: G411-GSK/SGC = 0.0079, G411-LLY/DMSO = 0.0035; G583-GSK/SGC = 0.1052, G583-LLY/DMSO = 0.0183; G729-GSK/SGC = 0.0071, G729-LLY/DMSO = 0.0076; G797-GSK/SGC = 0.0735, G797-LLY/DMSO = 0.0216. e Quantification of Annexin V+ cells in four GSC lines treated with 1 μM of the PRMT5 inhibitors, GSK591 and LLY-283, and controls, SGC2096 and DMSO, for 9–12 days (until cells of DMSO control were confluent). Data shown are representative of two independent experiments. f Cell numbers in GSC lines, G561, G583, G837, and G411 treated for 14 days with PRMT5 inhibitors, GSK591 and LLY283, after which drug was either washed out or left on and followed for another 14 days. Dashed line depicts the 14-day point after which the drug was washed out. Data shown are representative of two independent experiments. *p < 0.05; **p < 0.01. See also Supplementary Fig. 2. Source data are provided as a Source data file.
Fig. 3
Fig. 3. PRMT5 inhibition leads to deregulation of alternative splicing, affecting regulators of cell cycle.
a Volcano plot comparing fold change (x-axis) and p value obtained from DESeq2 analysis (y-axis) of the expressed genes between GSC lines treated with GSK591 and SGC2096 (n = 3). Red dots indicate significantly differentially expressed genes. The top 60 differentially expressed genes are annotated. b Gene-set enrichment analysis (GSEA) of all ranked differentially expressed genes (DEGs), visualized in Cytoscape. Networks of related ontologies (shown as colored nodes (red—upregulated; blue—downregulated) connected by blue lines, representing common genes between gene sets are circled and have been assigned group labels. c Distribution of ΔPSI (difference in “percent spliced in”) for classes of alternative splicing events (ASEs). The box shows the quartiles of the dataset while the whiskers extend to show the rest of the distribution, except for points that are determined to be “outliers.” The median marks the mid-point of the data and is shown by the line that divides the box into two parts. Twenty-five percent of scores fall below the lower quartile value while 75% of the scores fall below the upper quartile value. Thus 25% of data are above this value. The box plot shows the middle 50% of scores (i.e., the range between the 25th (Q1) and 75th (Q3) percentile). The minimum is the lowest score, excluding outliers (shown at the bottom of the lower whisker). The maximum is the highest score, excluding outliers (shown at the top of the upper whisker). The upper and lower whiskers represent scores outside the middle 50% (i.e., the lower 25% of scores and the upper 25% of scores) that are not outliers. Values that are lower than the minimum score or higher than the maximum score are considered as outliers. The y-axis shows the ΔPSI values between PRMT5 inhibitor and control and the x-axis indicates the type of ASEs: Alternative 5’ and 3’ splice sites (A3/A5SS; red and green respectively), mutually exclusive exons (MXE; blue), cassette exons (CE; purple), retained introns (RI; beige). d Prediction of protein impact (PI) classes for ASE events. The y-axis represents the frequency of occurrence for each type of protein impact prediction classes. The x-axis shows the type of PI classes found and their associated type of ASE: A3SS, A5SS, CE, RI. e The presence of genes affected by alternative splicing was evaluated among the top 500 enriched or depleted proteins identified by proteomics after PRMT5 inhibition in the same 3 GSC lines (G561, G564, and G583) used for RNA-Seq. Graph represents fold enrichment over expectation considering the total number of detected proteins for each category. ASE: includes genes with alternative splicing events detected in at least 2/3 GSC lines. Disruptive ASE: alternative splicing event predicted to disrupt the open reading frame in at least 2/3 PMRT5i-treated GSC lines. Error bars represent the standard error. ***p value < 0.001. f Heatmap of percent spliced in (PSI) values derived from RT-PCR analysis for 14 PRMT5-dependent ASEs in samples from 6 GSC lines treated with 1 μM GSK591, LLY-283, SGC2096 (inactive control), or vehicle for 3 days. End-point RT-PCR reactions were analyzed via capillary electrophoresis and percent spliced in (PSI) values were calculated as described in the “Methods” and plotted as a heatmap. Source data are provided as a Source data file.
Fig. 4
Fig. 4. Effect of PRMT5 probes on nuclear morphology.
a Hoechst staining of the GSC line, G561, upon treatment with the PRMT5 inhibitors, GSK591 and LLY-283, at 1 μM, as well as the control compounds, DMSO and SGC2096. Scale bar, 50 µm. Inset scale bar, 10 µm. b Percentage of cells with donut-shaped nuclei in the GSC lines, G561 and G583, 5 days after treatment with 1 μM of the PRMT5 inhibitors, GSK591 and LLY-283, and controls, SGC2096 and DMSO. n = 3 biologically independent samples, mean ± SD. Two-tailed unpaired t test with Welch’s correction. p values: G561-GSK591/SGC2096 = 0.0050, G561-LLY-283/DMSO = 0.0191, G583-GSK591/SGC2096 = 0.0406, G583-LLY-283/DMSO = 0.0025. *p < 0.05; **p < 0.01. Source data are provided as a Source data file.
Fig. 5
Fig. 5. A splicing signature predictive of PRMT5 inhibitor response.
a Heatmap of percent spliced in (PSI) values for 45 differential ASEs in transcripts across 31 GSC lines that are either good (19 lines) or poor responders (12 lines) to PRMT5 inhibition alongside AAC. More details about each ASE are provided in Supplementary Data 1. b Significant gene ontology terms and cellular processes derived from GO enrichment analysis of the 45 predictive ASEs. Enrichment analysis for transcripts containing predictive alternative splicing events for Gene Ontology (GO) Biological Process. The y-axis shows the top 10 enriched classes, ranked by adjusted p value (one sided, Fisher’s exact test) from low to high. The x-axis shows the p value transformed in a −log10 scale for visualization purposes. The p values were (from top to bottom in the chart order): 1.34E–05, 1.13E–04, 3.26E–04, 0.001315, 0.005137, 0.005137, 0.005507, 0.006227, 0.008603, 0.027258. Source data are provided as a Source data file.
Fig. 6
Fig. 6. Pharmacological inhibition of PRMT5 significantly extends survival of mice with orthotopic xenografts of GSCs.
a Concentration of LLY-283 in the plasma and brain of NSG mice 24 h after oral administration of 25, 50, and 100 mg/kg of LLY-283. n = 3, mean ± SD. b Kaplan–Meier survival curve of immunodeficient NSG mice injected intracranially with G411 GSCs and treated with 50 mg/kg LLY-283 (Vehicle: n = 10; LLY-283: n = 12). Significance was estimated using the log-rank (Mantel–Cox) test (two sided). Chi square = 8.038, p value = 0.0046. c H&E staining of a mouse brain with orthotopic xenografts treated with LLY-283 or vehicle at end point (scale bar = 1000 μm). N = 5 for LLY-283, N = 2 for vehicle. d Representative western blot of symmetric dimethyl arginine mark in tumor tissue from mice with orthotopic xenografts treated with LLY-283 or vehicle at experimental end point. The experiment was repeated twice with similar results. See also Supplementary Fig. 5. Source data are provided as a Source data file.

Similar articles

Cited by

References

    1. Stupp, R. et al. Radiotherapy plus concomitant and adjuvant temozolomide for globlastoma. N. Engl. J. Med.10.1016/j.canrad.2005.05.001 (2005). - PubMed
    1. Singh, S. K. et al. Identification of a cancer stem cell in human brain tumors. Cancer Res.10.1038/nature03128 (2003). - PubMed
    1. Bao, S. et al. Glioma stem cells promote radioresistance by preferential activation of the DNA damage response. Nature10.1038/nature05236 (2006). - PubMed
    1. Chen, J. et al. A restricted cell population propagates glioblastoma growth after chemotherapy. Nature10.1038/nature11287 (2012). - PMC - PubMed
    1. Lan, X. et al. Fate mapping of human glioblastoma reveals an invariant stem cell hierarchy. Nature10.1038/nature23666 (2017). - PMC - PubMed

Publication types

MeSH terms

Substances