. 2021 Feb 12;12(1):980.
doi: 10.1038/s41467-021-21210-7.

Insertion-sequence-mediated mutations both promote and constrain evolvability during a long-term experiment with bacteria

Affiliations

Insertion-sequence-mediated mutations both promote and constrain evolvability during a long-term experiment with bacteria

Jessika Consuegra et al. Nat Commun. .

Abstract

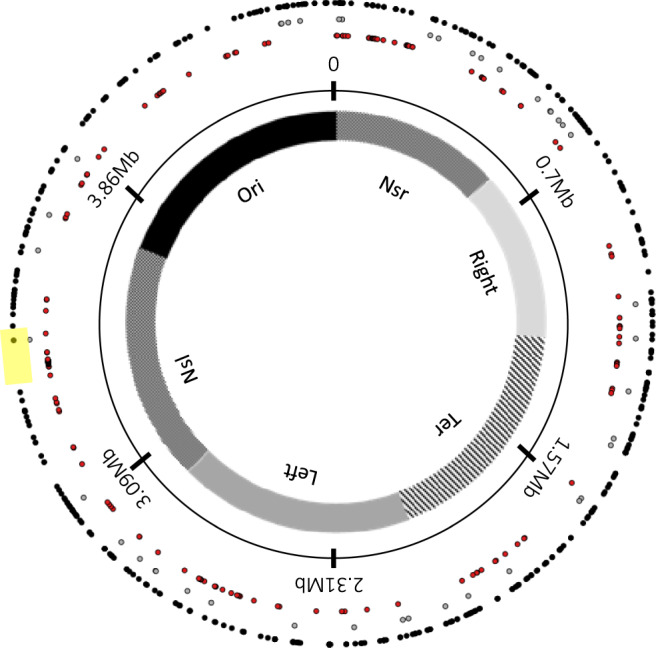
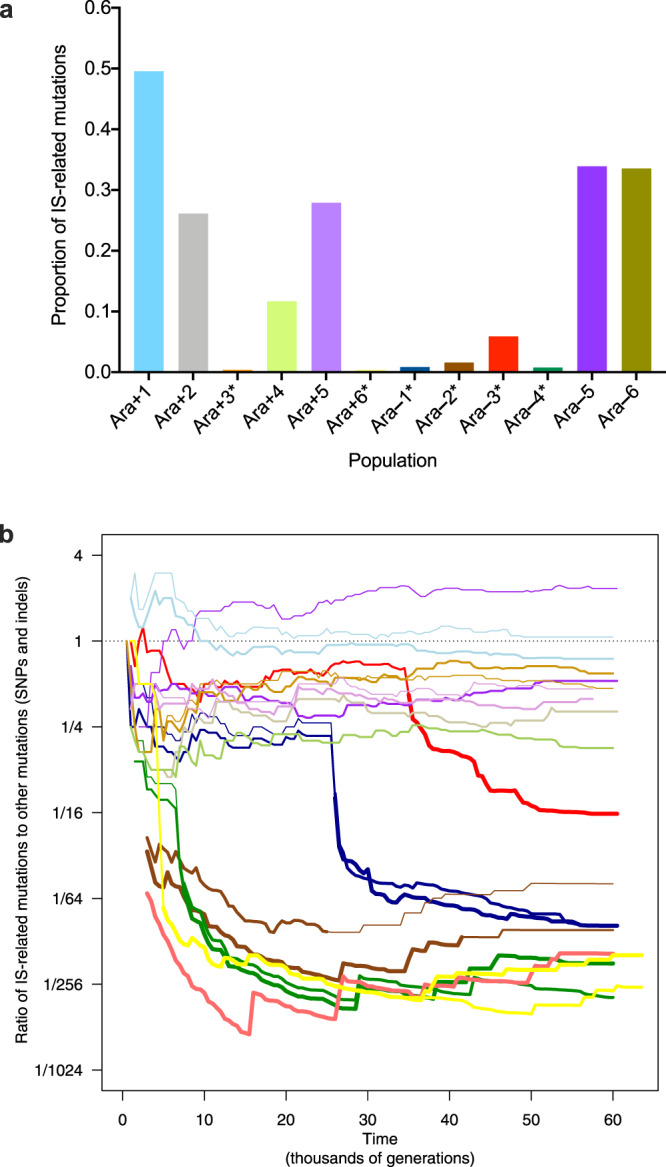
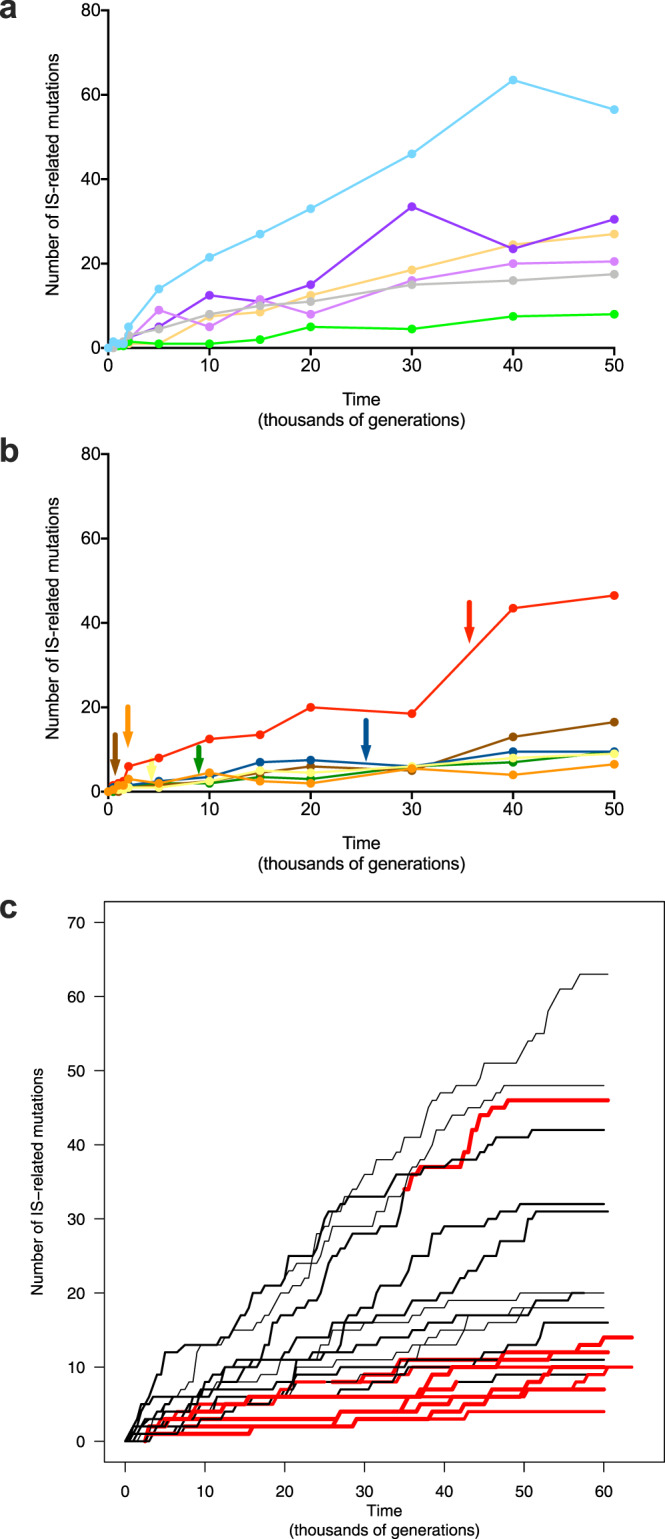
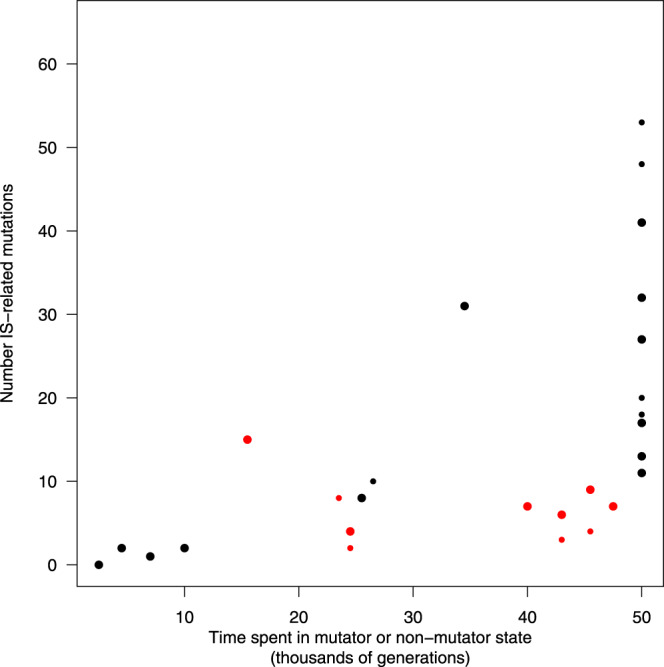
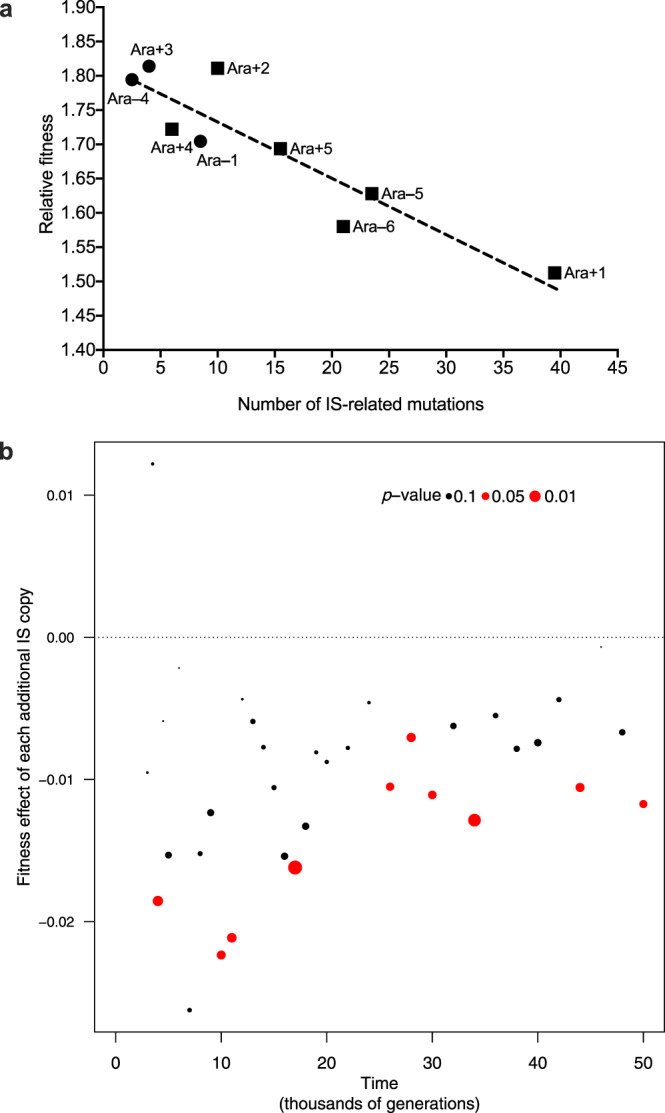
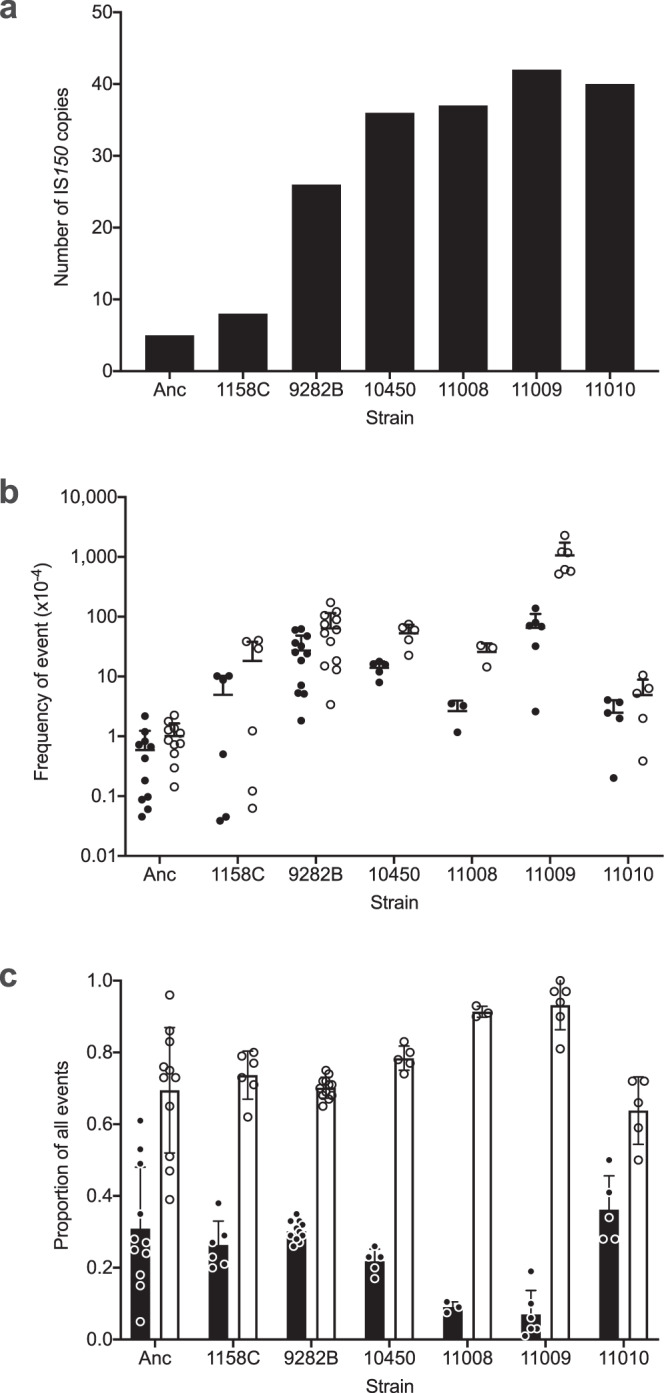
Insertion sequences (IS) are ubiquitous bacterial mobile genetic elements, and the mutations they cause can be deleterious, neutral, or beneficial. The long-term dynamics of IS elements and their effects on bacteria are poorly understood, including whether they are primarily genomic parasites or important drivers of adaptation by natural selection. Here, we investigate the dynamics of IS elements and their contribution to genomic evolution and fitness during a long-term experiment with Escherichia coli. IS elements account for ~35% of the mutations that reached high frequency through 50,000 generations in those populations that retained the ancestral point-mutation rate. In mutator populations, IS-mediated mutations are only half as frequent in absolute numbers. In one population, an exceptionally high ~8-fold increase in IS150 copy number is associated with the beneficial effects of early insertion mutations; however, this expansion later slowed down owing to reduced IS150 activity. This population also achieves the lowest fitness, suggesting that some avenues for further adaptation are precluded by the IS150-mediated mutations. More generally, across all populations, we find that higher IS activity becomes detrimental to adaptation over evolutionary time. Therefore, IS-mediated mutations can both promote and constrain evolvability.


Conflict of interest statement

The authors declare no competing interests.

Figures

Fig. 1
Fig. 1. Distribution of all insertion sites of IS elements in the genome sequences of the ancestor and 264 evolved clones.
Insertion sites are mapped onto the chromosome of the LTEE ancestor, REL606. The inner circle indicates the six chromosomal macrodomains: Ori origin; Nsr non-structured right domain; Right right domain; Ter terminus domain; Left left domain; Nsl non-structured left domain. The next circle shows the chromosomal coordinates. Gray and black dots show the location of IS elements in the ancestor and evolved clones, respectively. Red dots show the location of essential genes. The 152-kbp “IS-empty” chromosomal region is highlighted in yellow. Source data are provided as a Source Data file.
Fig. 2
Fig. 2. Effect of mutator phenotype on IS-related mutations.
a Proportion of IS-related mutations relative to total mutations after 50,000 generations. The numbers of mutations were inferred from genome sequences of evolved clones. The ratios of IS-related mutations to total mutations were calculated for two clones from each population, and the data shown are the averages. Asterisks indicate six populations that evolved point-mutation hypermutability. b Ratio of IS-related mutations to other mutations (SNPs and indels) in all populations shown on a logarithmic scale. These data are based on metagenome sequences obtained from whole-population samples over time; they include only IS insertions and SNPs that eventually reached fixation in the entire population, or in a subpopulation when a stable polymorphism was detected. The same colors are used in a and b (including Ara+6, yellow, which is barely visible in a). Major and minor (when present) lineages are shown by thin and very thin lines in the non-mutator populations, and by bold and lighter lines in the mutator populations. Source data are provided as a Source Data file.
Fig. 3
Fig. 3. Dynamics of IS-related mutations in the LTEE populations.
a Number of IS-related mutations, compared to the ancestor, in the genomes of evolved clones sampled over time in the non-mutator populations. b Number of IS-related changes in the genomes of evolved clones sampled over time in the mutator populations. Arrows indicate the times of transition to the mutator phenotype. The color code for the populations is the same as in Fig. 2. c Number of IS-related mutations detected in the metagenomes of entire populations. Trajectories include only those mutations that reached fixation in the entire population, or in a subpopulation when stable polymorphisms were detected. The number of IS-related mutations in major and minor subpopulations are shown as normal and thin lines, respectively, and mutator populations are shown in red after hypermutability evolved. Source data are provided as a Source Data file.
Fig. 4
Fig. 4. Number of fixed IS-related mutations as a function of a lineage’s time spent in mutator or non-mutator state.
Large and small dots show mutations fixed in major and minor lineages, respectively. (Both include mutations fixed in the total population, so they are not fully independent). Red and black dots indicate mutator and non-mutator populations, respectively; the y-axis values show the number of IS-related mutations that were fixed over the time spent in either the mutator or non-mutator state. Source data are provided as a Source Data file.
Fig. 5
Fig. 5. Relationship between fitness and IS-related mutations.
a Mean fitness of evolved populations at 50,000 generations, relative to the common ancestor, as a function of the number of IS-related mutations. The number of IS-related mutations uses the average value of the two evolved clones sequenced at that time point. Fitness values are inferred from a power-law model according to Wiser et al.. Three populations (Ara–2, Ara–3, and Ara+6) are excluded owing to technical problems associated with measuring their fitness values. Circles and squares indicate mutator and non-mutator populations, respectively. The line shows the least-squares linear regression y = 1.813 − 0.0081x (n = 9, r = –0.9115, two-tailed p = 0.0006). b Multiple regression analysis to estimate the marginal fitness effect (the cost, when negative) associated with having an extra IS copy, taking into account the lineage’s mutator or non-mutator status over time. The size of the points is larger for lower p values; red points indicate a significant contribution of IS copy number to fitness at the 5% level. Source data are provided as a Source Data file.
Fig. 6
Fig. 6. IS150-mediated recombination and transposition events in the ancestor and evolved clones from population Ara+1.
a Number of IS150 copies in genomes of the ancestor (Anc) and six evolved clones: 1158C (2000 generations), 9282B (20,000 generations), 10450 (30,000 generations), and 11008, 11009 and 11010 (40,000 generations). b Frequencies of IS150-mediated transposition (black) and recombination (white) events, measured using the reporter plasmid pFDX2339. c Proportion of transposition (black) and recombination (white) events, expressed relative to the total number of events (including both transposition and recombination). Error bars show the standard deviation based on three technical replicates for each of three biological replicates, except for the ancestor which had three technical replicates for each of five biological replicates and 1158C and 11009, which had three technical replicates for each of two biological replicates. Source data are provided as a Source Data file.

References

    1. Wagner, A. Robustness and Evolvability in Living Systems (Princeton University Press, Princeton, 2005).
    1. Wielgoss S, et al. Mutation rate dynamics in an Escherichia coli population reflect tension between adaptation and genetic load. Proc. Natl Acad. Sci. USA. 2013;110:222–227. doi: 10.1073/pnas.1219574110. - DOI - PMC - PubMed
    1. Sniegowski PD, et al. Evolution of high mutation rates in experimental populations of E. coli. Nature. 1997;387:703–705. doi: 10.1038/42701. - DOI - PubMed
    1. Giraud A, et al. Costs and benefits of high mutation rates: adaptive evolution of bacteria in the mouse gut. Science. 2001;291:2606–2608. doi: 10.1126/science.1056421. - DOI - PubMed
    1. Matic I, et al. Highly variable mutation rates in commensal and pathogenic Escherichia coli. Science. 1997;277:1833–1834. doi: 10.1126/science.277.5333.1833. - DOI - PubMed

Publication types

Substances

LinkOut - more resources