. 2021 Feb 12;12(1):1014.
doi: 10.1038/s41467-021-21117-3.

Tumor cell plasticity, heterogeneity, and resistance in crucial microenvironmental niches in glioma

Affiliations

Tumor cell plasticity, heterogeneity, and resistance in crucial microenvironmental niches in glioma

Erik Jung et al. Nat Commun. .

Abstract

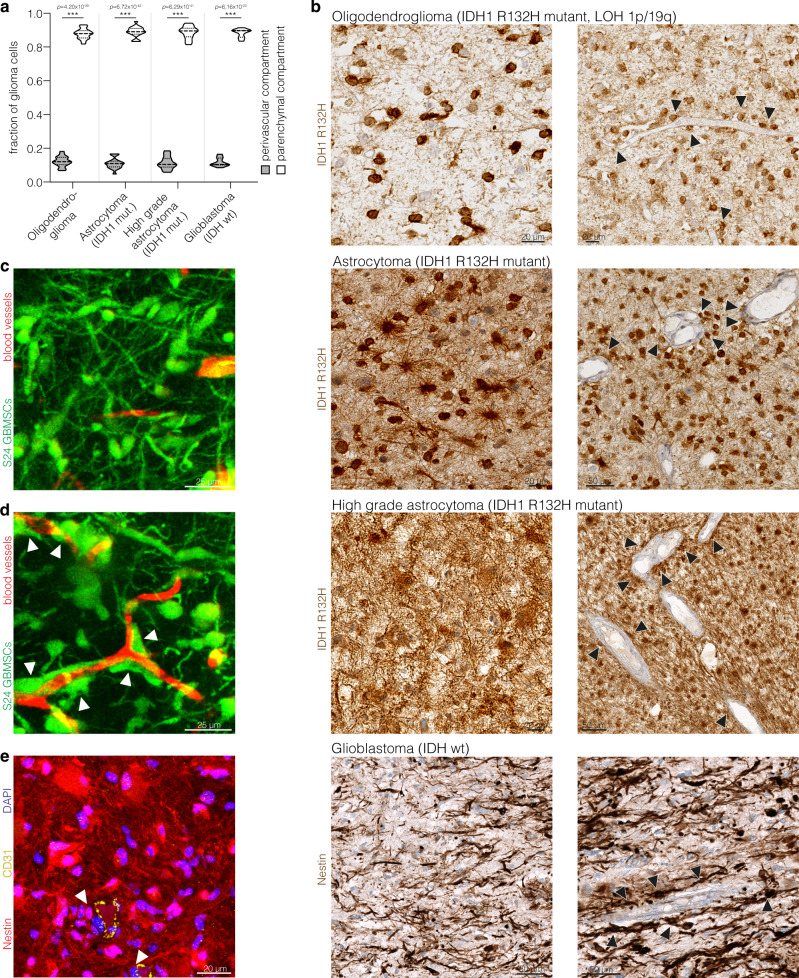
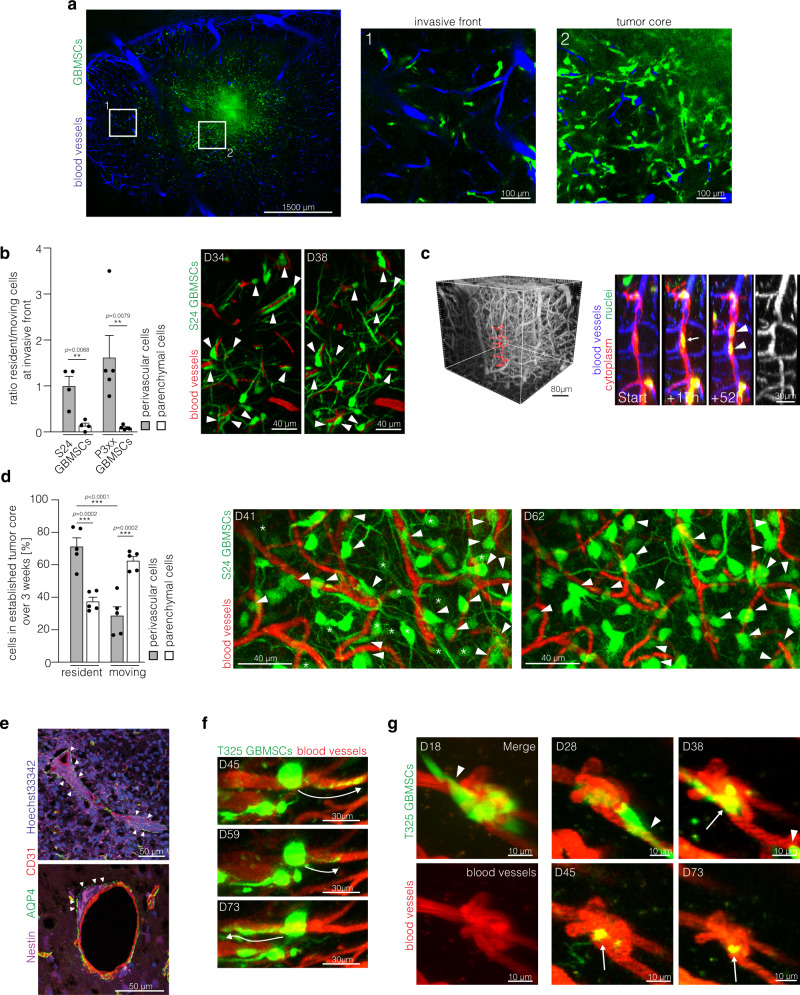
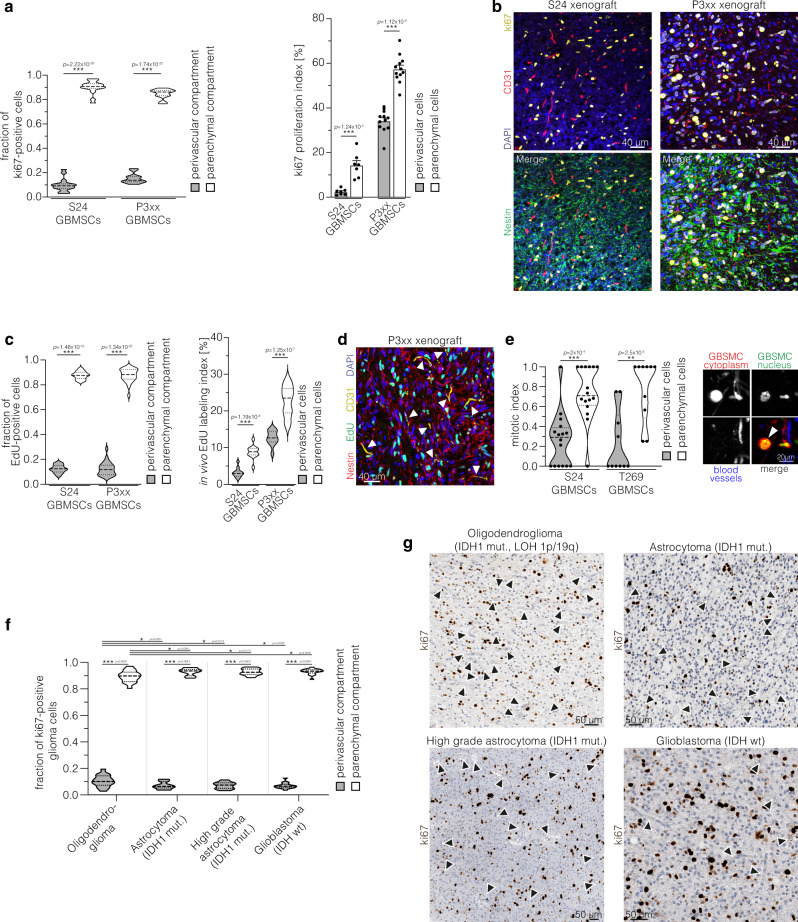
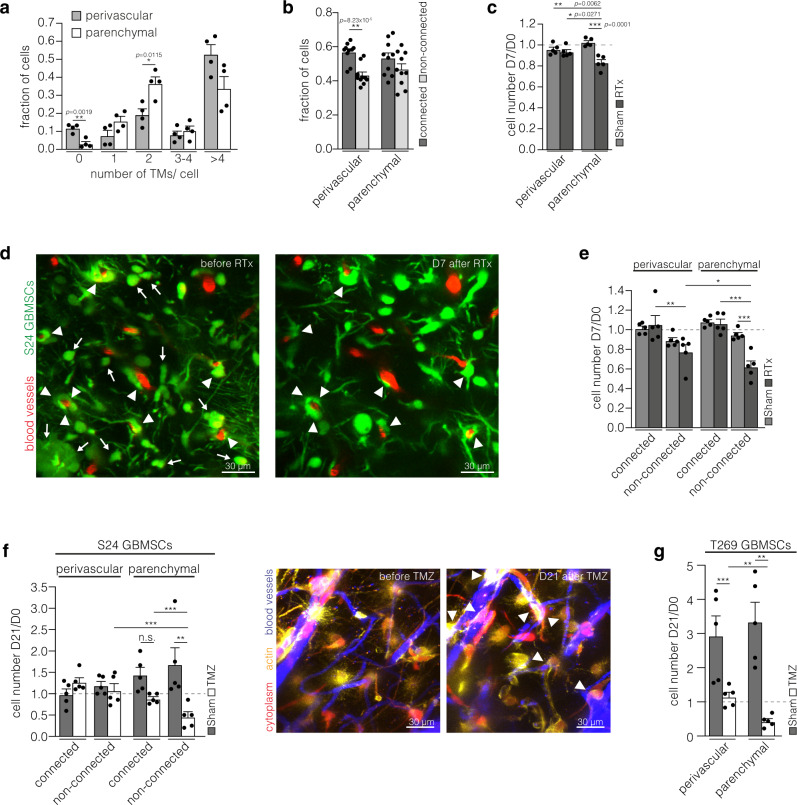
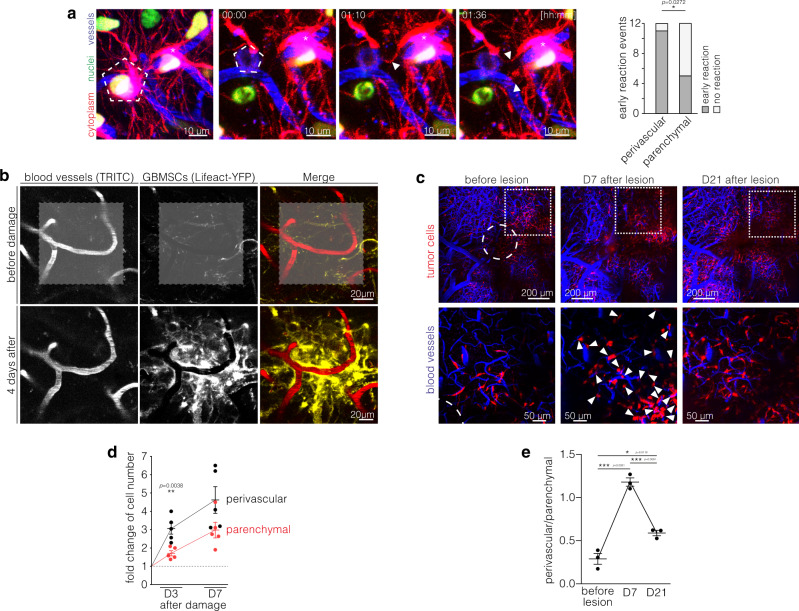
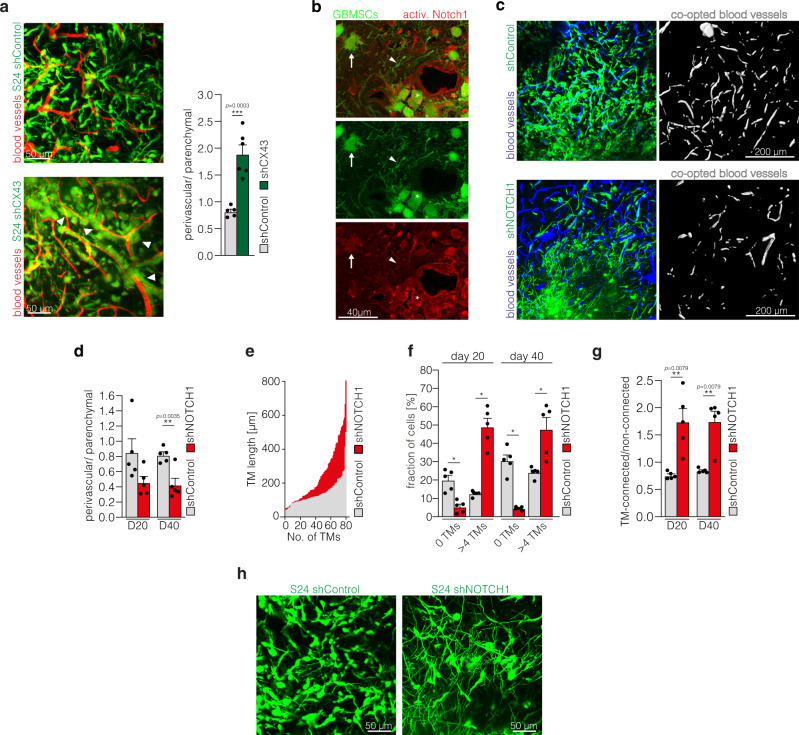
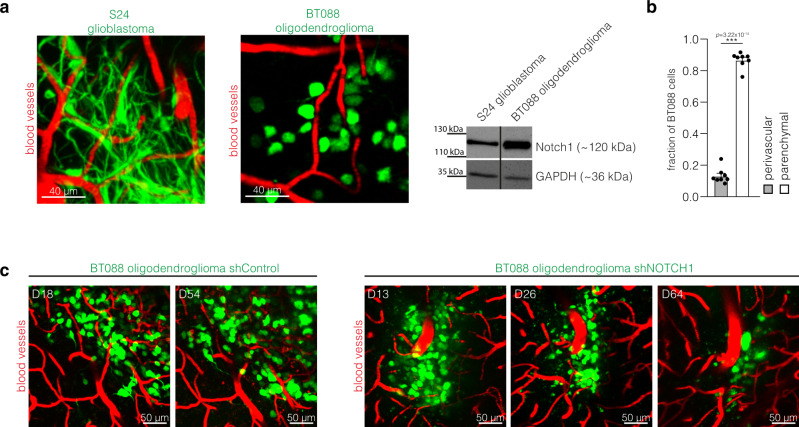
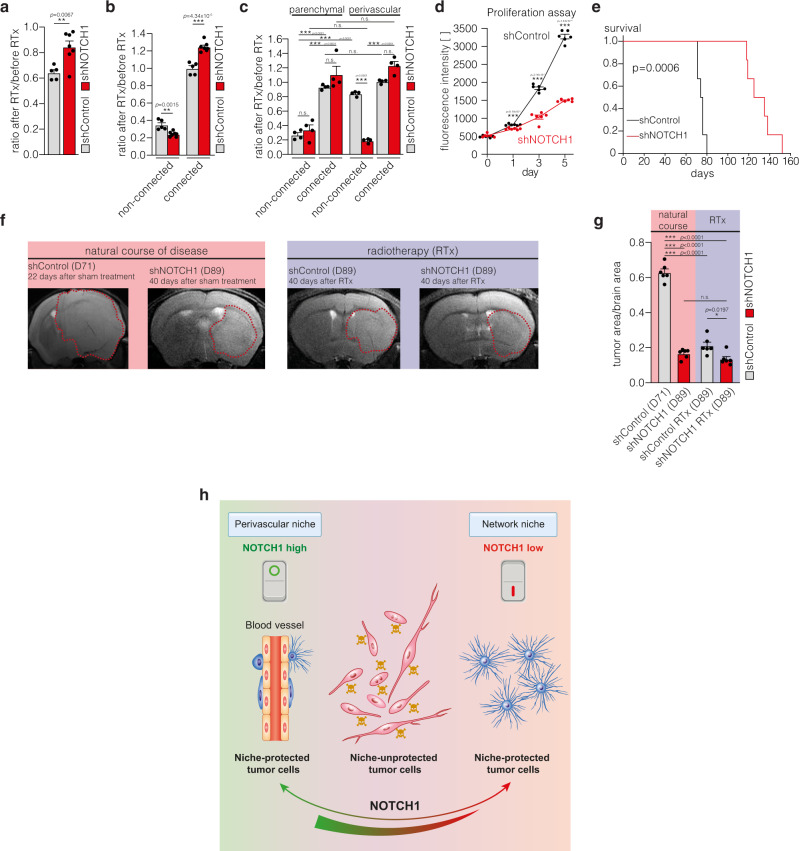
Both the perivascular niche (PVN) and the integration into multicellular networks by tumor microtubes (TMs) have been associated with progression and resistance to therapies in glioblastoma, but their specific contribution remained unknown. By long-term tracking of tumor cell fate and dynamics in the live mouse brain, differential therapeutic responses in both niches are determined. Both the PVN, a preferential location of long-term quiescent glioma cells, and network integration facilitate resistance against cytotoxic effects of radiotherapy and chemotherapy-independently of each other, but with additive effects. Perivascular glioblastoma cells are particularly able to actively repair damage to tumor regions. Population of the PVN and resistance in it depend on proficient NOTCH1 expression. In turn, NOTCH1 downregulation induces resistant multicellular networks by TM extension. Our findings identify NOTCH1 as a central switch between the PVN and network niche in glioma, and demonstrate robust cross-compensation when only one niche is targeted.


Conflict of interest statement

E.J., M.O., W.W. and F.W. report the patent (WO2017020982A1) “Agents for use in the treatment of glioma”. F.W. is co-founder of DC Europa Ltd (a company trading under the name Divide & Conquer) that is developing new medicines for the treatment of glioma. Divide & Conquer also provides research funding to F.W.’s lab under a research collaboration agreement. All other authors declare no competing interests.

Figures

Fig. 1
Fig. 1. Perivascular and network niches in human and experimental gliomas.
a Distribution of IDH1 R132H positive glioma cells and nestin positive glioblastoma cells in the perivascular and parenchymal compartment in molecularly defined patient glioma specimen (oligodendroglioma: n = 18 patients; astrocytoma: n = 19 patients; high grade astrocytoma: n = 20 patients; glioblastoma: n = 10 patients; one-way ANOVA, Tukey’s post hoc test). b Exemplary immunohistochemical stainings of IDH1 R132H in molecularly defined human glioma specimen and of nestin in human glioblastoma specimen demonstrate the dense interconnection of glioma cells in astrocytoma and glioblastoma specimen (left column) as well as the close association of tumor cells with blood vessels (arrowheads) (right column). c Exemplary two photon microscopy (2-PM) image of highly interconnected S24 glioblastoma stem-like cells (GBMSCs) growing in the mouse brain. d Intravital 2-PM image of perivascular S24 GBMSCs (arrowheads) in a mouse xenograft. e Exemplary immunofluorescence image of a human glioblastoma specimen (glioblastoma, IDH wild-type, ATRX retained, MGMT promoter unmethylated) demonstrates the dense interconnection of nestin-positive glioma cells and their relation to the perivascular niche (CD31-positive endothelium). Arrowheads exemplarily mark perivascular tumor cells. Data a are represented as violin plot with median and quartiles. (mut.: mutant; LOH: loss of heterozygosity; wt: wild-type). ***p < 0.001. Source data are provided as a Source Data file.
Fig. 2
Fig. 2. Long-term glioma cell behavior in the perivascular niche.
a Overview intravital 2-PM image of the tumor bearing hemisphere (S24 glioblastoma stem-like cells (GBMSCs), D23). Right: Magnifications show the invasive front (1) and the tumor core (2). b Left: Ratio of resident and moving S24 and P3xx GBMSCs at the invasive front over 4 (S24) and 5 (P3xx) days (n = 4 regions (S24; 41–86 cells per region)/5 regions (P3xx; 23–57 cells per region) in 3 mice per cell line, two-tailed t-test (S24) and two-tailed Mann Whitney test (P3xx)). Right: Exemplary intravital 2-PM images of the same region at the invasive front imaged over 4 days demonstrating several resident perivascular cells (arrowheads) (S24 GBMSCs, D34-38). c Left: 3D in vivo 2-PM image of the vasculature. The vessels shown on the right side are marked in red. Right: Timeseries of resident and dividing S24 GBMSC (arrow) in the perivascular niche over 52 h. Daughter nuclei are indicated with arrowheads. The angiogram is shown on the right. Blood vessels (blue), nuclei (green), cytoplasm (red). d Left: Analysis of residency and migration in the established tumor core over 21 days (D41–62) (S24 GBMSCs, in vivo 2-PM, n = 5 regions in three mice, 46–81 cells per region, one-way ANOVA (p = 5.36 × 10−6), Tukey’s post hoc test for multiple comparisons). Right: Exemplary intravital 2-PM images of the same region at day 41 and 62. Resident perivascular S24 GBMSCs are marked with arrowheads, parenchymal cells moving away are marked by asterisks. e Immunofluorescence staining of nestin (purple), Aquaporin 4 (AQP4) (green), CD31 (red), and Hoechst33342 (blue) demonstrates the localization of perivascular cell clusters (arrowheads) below the astrocyte endfeet (S24 GBMSCs). f Exemplary in vivo 2-PM images of T325 GBMSCs over 28 days showing a resident tumor cell extending and retracting TMs (arrows). g Repetitive 2-PM imaging of T325 GBMSCs (green) demonstrating a resident cell (arrow) associated with a remodeled blood vessel (red). Some cells from the initial cell cluster migrated away during the observation period (arrowheads). Data b, d are represented as mean + SEM. **p < 0.01, ***p < 0.001. Source data are provided as a Source Data file.
Fig. 3
Fig. 3. Perivascular cells are slow-cycling.
a Left: Distribution of ki67-positive cells in the perivascular and parenchymal compartment in orthotopic S24 (n = 16 regions from three mice, two-tailed t-test) and P3xx (n = 12 regions from four mice, two-tailed t-test) xenograft tumors. Right: ki67 proliferation index (ki67 positive cells/all cells in the respective compartment) of S24 (n = 3 mice, two-tailed t-test) and P3xx tumor cells (n = 4 mice, two-tailed t-test) in the perivascular and the parenchymal compartment in xenograft tumors. b Exemplary immunofluorescence stainings of ki67 (yellow, proliferating cells), nestin (green, tumor cells), DAPI (blue, nuclei), and CD31 (red, endothelium) in S24 and P3xx xenografts. c Left: Quantification of the distribution of EdU-positive tumor cells (indicating cells in S-phase) after in vivo incorporation of EdU (4 h) in the parenchymal and perivascular compartment (S24 xenografts, n = 25 regions from 5 mice, two-tailed t-test; P3xx xenografts, n = 12 regions from 4 mice, two-tailed t-test). Right: EdU labeling index (EdU positive cells/all cells in the respective compartment) in the perivascular and the parenchymal compartment (S24 xenografts, n = 5 mice, two-tailed t-test; P3xx xenografts, n = 4 mice, two-tailed t-test). d Exemplary immunofluorescence staining of EdU (green, cells in S-phase), nestin (red, tumor cells), DAPI (blue, nuclei) and CD31 (yellow, endothelium) demonstrates that most proliferating cells are located in the parenchymal compartment (P3xx xenograft). Blood vessels are marked with arrowheads. e Mitotic index (number of mitotic events normalized to the distribution of cells in the perivascular and parenchymal compartment) of S24 and T269 GBMSCs (n = 16 regions in eight mice (S24), n = 10 regions in 4 mice (T269), two-tailed Mann Whitney tests). Right: Exemplary in vivo 2-PM of mitosis of a parenchymal S24 GBMSC (arrowhead). Cytoplasm (red), nucleus (green), blood vessels (blue). f Distribution of ki67 positive cells in the parenchymal and perivascular compartment in molecularly defined human glioma specimen (oligodendroglioma: n = 16 patients; astrocytoma: n = 19 patients; high grade astrocytoma: n = 15 patients; glioblastoma: n = 16 patients; one-way ANOVA (p = 1.36 × 10−139), Tukey’s post hoc test for multiple comparisons). g Exemplary immunohistochemical stainings of ki67 in molecularly defined human glioma specimen. Arrowheads exemplarily mark blood vessels. Data in violin plots a, c, e, f are represented as median and quartiles. Data in columns a are represented as mean + SEM. *p < 0.05**, p < 0.01, ***p < 0.001. (mut: mutant; LOH: loss of heterozygosity; wt: wild-type). Source data are provided as a Source Data file.
Fig. 4
Fig. 4. Both perivascular and network glioma cells are particularly resilient.
a Analysis of fractions of cells with different number of TMs (S24 glioblastoma stem-like cells (GBMSCs), D41, n = 4 regions in 3 mice, 52–104 cells, two-tailed t-tests). b Analysis of the connectivity of cells in the perivascular and parenchymal compartment (S24 GBMSCs, D65 ± 4, n = 10 regions in 6 mice, 148–259 cells, two-tailed t-tests). c Ratio of tumor cell counts in the same regions 7 days after and before sham treatment or irradiation (RTx) (S24 GBMSCs, n = 5 regions in 3 mice per group, one-way ANOVA (p = 0.0002), Tukey’s post hoc test). d Representative 2-PM images of the same tumor region before and 7 days after radiotherapy demonstrate that perivascular glioma cells are largely radioresistant (S24 GBMSCs). Arrows: disappearing parenchymal tumor cells. Arrowheads: surviving perivascular tumor cells. e Ratio of tumor cell counts in the same regions 7 days after and before sham treatment or irradiation (RTx) categorized by connectivity and compartment (S24 GBMSCs, n = 5 regions in 3 mice per group, one-way ANOVA (p = 1.55; × 10−6), Student–Newman–Keuls post hoc test). The analysis revealed that non-connected tumor cells in the parenchyma are most susceptible for the cytotoxic effects of radiotherapy. In contrast, non-connected cells in the PVN are more radioresistant, thereby demonstrating the protective environment promoted by the PVN. In the PVN, interconnection has an additive effect on radioresistance. f Left: Ratio of cell counts of S24 GBMSCs in the same regions 21 days after and before temozolomide or sham treatment (n = 5 regions in 3 mice per group, one-way ANOVA on ranks (p = 0.0018), Student–Newman–Keuls post hoc test). Right: Exemplary 2-PM images before and 21 days after temozolomide treatment in S24 GBMSCs. Arrowheads: surviving perivascular GBMSCs. g Ratio of cell counts of T269 GBMSCs in the same regions 21 days after and before temozolomide or sham treatment (n = 5 regions in 3 mice per group, one-way ANOVA on ranks (p = 0.0002), Student–Newman–Keuls post hoc test). Data ac, eg are represented as mean + SEM. *p < 0.05, **p < 0.01, ***p < 0.001, n.s. = not significant. Source data are provided as a Source Data file.
Fig. 5
Fig. 5. Perivascular cells govern glioma’s damage response.
a Left: Early reaction (white arrowheads) of a perivascular cell (asterisk) after laser ablation of a nearby S24 GBMSC (pentagon). Cytoplasm (red), blood vessels (blue), nuclei (green). Right: Analysis of the early reaction to laser ablation of nearby cells (S24 glioblastoma stem-like cells (GBMSCs), n = 12 events, two-sided Fisher exact test). b After laser-induced stress (marked with gray area in the upper row) a strong perivascular reaction can be observed (S24 GBMSCs). c Representative in vivo 2-PM images of the same region before, 7 and 14 days after a surgical lesion (circle) in a S24 xenograft tumor. 7 days after lesioning there is a strong increase of the perivascular cell population (arrowheads). Upper row: overview; lower row: subset. Subset regions are marked by dotted squares. d Fold changes of perivascular (black) and parenchymal (red) cell counts 3 and 7 days after laser damage compared to before laser damage (S24 GBMSCs, n = 5 regions in 4 mice, two-tailed t-tests) indicate that the damage response is predominated by the PVN. e Quantification of the ratio of perivascular and parenchymal cells before, 7 and 14 days after a surgical lesion (S24 GBMSCs, n = 3 animals, one-way ANOVA (p = 3.92 × 10−5), Tukey’s post hoc test). This analysis reveals a shift towards the perivascular compartment that is most pronounced in the initial phase and precedes the repopulation of the lesioned brain area. Data d, e are represented as mean ± SEM. *p < 0.05, **p < 0.01, ***p < 0.001. Source data are provided as a Source Data file.
Fig. 6
Fig. 6. NOTCH1 inhibition leads to depletion of the perivascular niche but promotes TM-network formation.
a Left: Exemplary in vivo 2-PM images of S24 shControl (top, D40) and shCX43 tumors (bottom, D43). Right: Corresponding ratio of perivascular and parenchymal cells in S24 shControl and shCX43 knockdown tumors (D40± 4, n = 5 regions (S24 shControl)/6 regions (S24 shCX43) in 3 mice per group, two-tailed t-test). b Immunofluorescence staining of activated Notch1 in a S24 tumor section. Arrow: multi-TM parenchymal cell (low Notch1 activation); arrowhead: Notch1-low TM; asterisk: perivascular cell (high Notch1 activation). c Exemplary 2-PM images of S24 shControl (top) and shNOTCH1 (bottom) glioblastoma stem-like cells (GBMSCs) (green) with segmentation of co-opted blood vessels (white) demonstrating a reduced population of the perivascular compartment after NOTCH1 downregulation (D24 ± 1). Blood vessels (blue). d Ratio of the perivascular and parenchymal cell count 20 and 40 days after S24 shControl and shNOTCH1 tumor cell implantation (n = 5 regions in 3 mice (S24 shControl)/4 mice (S24 shNOTCH1), 38–445 cells, two-tailed t-tests). e Histogram and quantification of TM length in S24 shControl and shNOTCH1 GBSMSCs (D20, n = 3 mice (S24 shControl), n = 4 mice (S24 shNOTCH1). f Quantification of TM-devoid (0 TMs) vs. TM-rich (>4 TMs) S24 shControl and shNOTCH1 GBMSCs (n = 5 regions in 3 mice (S24 shControl)/4 mice (S24 shNOTCH1), 18–286 cells, one-way ANOVA on the ranks (p = 2.90 × 10−12), Student–Newman–Keuls post hoc test). g Ratio of connected and non-connected S24 shControl and shNOTCH1 GBMSCs 20 and 40 days after tumor cell implantation (n = 5 regions in 3 mice (S24 shControl)/4 mice (S24 shNOTCH1), 11–245 cells, two-tailed Mann–Whitney tests). h Corresponding 2-PM images demonstrating the TM richness of S24 shNOTCH1 tumors (D40). Data a, d, f, g are represented as mean + SEM. *p < 0.05, **p < 0.01, ***p < 0.001. Source data are provided as a Source Data file.
Fig. 7
Fig. 7. NOTCH1 pathway activation in TM-deficient oligodendrogliomas.
a Left: Exemplary intravital 2-PM images of S24 glioblastoma and BT088 oligodendroglioma cells (D21 after tumor implantation). Right: Western blot analysis of the Notch1 expression in S24 glioblastoma stem-like cells (GBMSCs) and BT088 oligodendroglioma cells. Loading control: GAPDH. b Quantification of the distribution of BT088 oligodendroglioma cells in the perivascular and parenchymal compartment (n = 8 regions in 5 mice, D21 ± 3, two-tailed t-test). c Exemplary images of BT088 shControl oligodendroglioma cells and BT088 shNOTCH1 cells demonstrate tumor regression after NOTCH1 knockdown. Data b are represented as mean + SEM. ***p < 0.001.
Fig. 8
Fig. 8. NOTCH1 downregulation sensitizes perivascular glioblastoma cells to radiotherapy, but induces network resistance.
a, b Ratio of cell counts 7 days after and before irradiation of S24 shControl and shNOTCH1 tumors (n = 5 regions (S24 shControl)/7 regions (S24 shNOTCH1) in 3 mice per group, two-tailed t-tests). c Subgroup analysis of the ratio of cell counts of S24 shControl and shNOTCH1 cells 7 days after and before irradiation categorized regarding connectivity and compartment (n = 4 regions in 3 mice per group, one-way ANOVA (p = 9.09 × 10−14), Tukey’s post hoc test). d AlamarBlue proliferation assay of S24 shControl and shNOTCH1 cells (n = 6 biological replicates, two-tailed t-tests). e Survival analysis of S24 shControl and shNOTCH1 tumor bearing mice (n = 6 mice per group, two-sided log rank test). f Exemplary 9.4 T MRI images of S24 shControl and shNOTCH1 tumors. Left: natural course, right: 40 days after irradiation (RTx). g Quantification of tumor burden (tumor area/brain area on 9.4 T MRI) in untreated and irradiated mice (n = 6 mice per group, one-way ANOVA (p = 6.18 × 10−15), Tukey’s post hoc test). h Graphical abstract of the two niches of resistance in glioblastoma. The perivascular niche (PVN) (left) is sustained by the NOTCH1 pathway, whereas low NOTCH1 expression leads to depletion of the perivascular niche and the induction of resistant multicellular networks (right). Non-connected, parenchymal cells (middle) in contrast are sensitive to cytotoxic therapies. Data ad, g are represented as mean + SEM. *p < 0.05, **p < 0.01, ***p < 0.001, n.s. = not significant. Source data are provided as a Source Data file.

Similar articles

Cited by

References

    1. Weller M, et al. Glioma. Nat. Rev. Dis. Prim. 2015;1:15017. doi: 10.1038/nrdp.2015.17. - DOI - PubMed
    1. Galli R, et al. Isolation and characterization of tumorigenic, stem-like neural precursors from human glioblastoma. Cancer Res. 2004;64:7011–7021. doi: 10.1158/0008-5472.CAN-04-1364. - DOI - PubMed
    1. Ignatova TN, et al. Human cortical glial tumors contain neural stem-like cells expressing astroglial and neuronal markers in vitro. Glia. 2002;39:193–206. doi: 10.1002/glia.10094. - DOI - PubMed
    1. Lathia JD, Mack SC, Mulkearns-Hubert EE, Valentim CL, Rich JN. Cancer stem cells in glioblastoma. Genes Dev. 2015;29:1203–1217. doi: 10.1101/gad.261982.115. - DOI - PMC - PubMed
    1. Lathia JD, et al. Direct in vivo evidence for tumor propagation by glioblastoma cancer stem cells. PLoS One. 2011;6:e24807. doi: 10.1371/journal.pone.0024807. - DOI - PMC - PubMed

Publication types