. 2021 Feb 12;12(1):1011.
doi: 10.1038/s41467-021-21366-2.

CTCF loss has limited effects on global genome architecture in Drosophila despite critical regulatory functions

Affiliations

CTCF loss has limited effects on global genome architecture in Drosophila despite critical regulatory functions

Anjali Kaushal et al. Nat Commun. .

Abstract

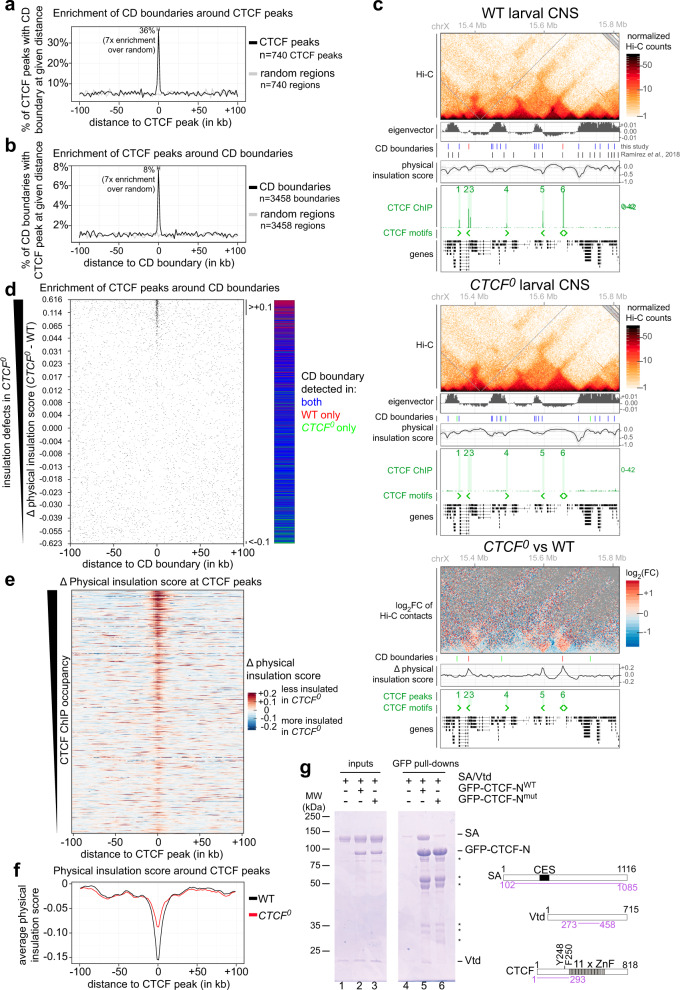
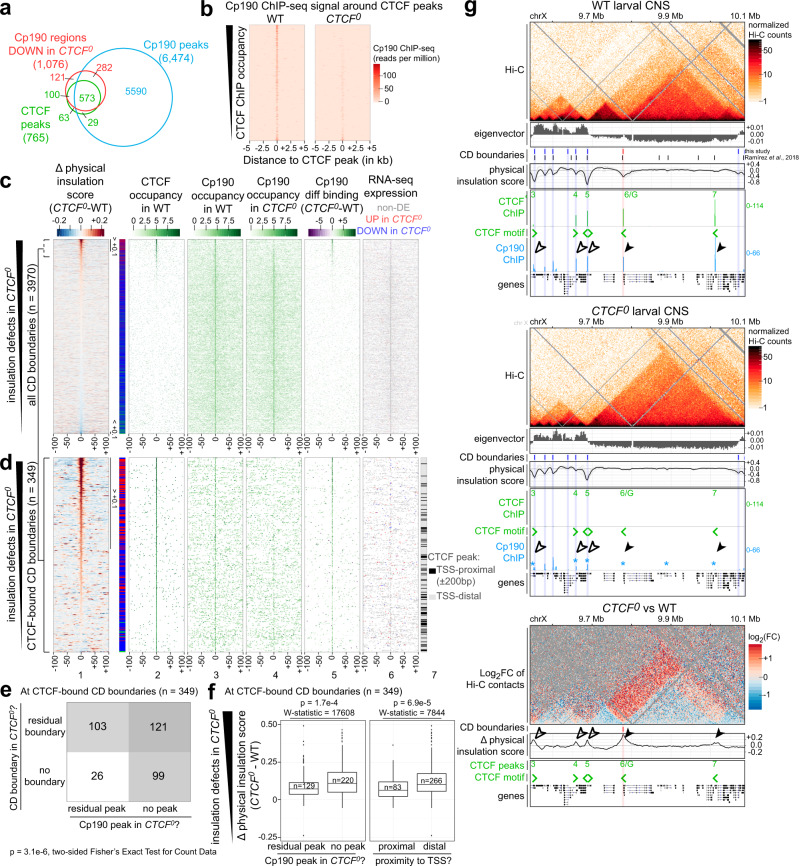
Vertebrate genomes are partitioned into contact domains defined by enhanced internal contact frequency and formed by two principal mechanisms: compartmentalization of transcriptionally active and inactive domains, and stalling of chromosomal loop-extruding cohesin by CTCF bound at domain boundaries. While Drosophila has widespread contact domains and CTCF, it is currently unclear whether CTCF-dependent domains exist in flies. We genetically ablate CTCF in Drosophila and examine impacts on genome folding and transcriptional regulation in the central nervous system. We find that CTCF is required to form a small fraction of all domain boundaries, while critically controlling expression patterns of certain genes and supporting nervous system function. We also find that CTCF recruits the pervasive boundary-associated factor Cp190 to CTCF-occupied boundaries and co-regulates a subset of genes near boundaries together with Cp190. These results highlight a profound difference in CTCF-requirement for genome folding in flies and vertebrates, in which a large fraction of boundaries are CTCF-dependent and suggest that CTCF has played mutable roles in genome architecture and direct gene expression control during metazoan evolution.


Conflict of interest statement

The authors declare no competing interests.

Figures

Fig. 1
Fig. 1. CTCF expression in neural stem cells or neurons is essential for Drosophila viability.
a Percentages (in y) of wildtype (WT), CTCFKO and animals lacking CTCF in neural stem cells (NSCs), neurons or muscle that successfully transition from third instar larva to pupa (black) and from pupa to adult (gray) in n = 3 biological replicates (rep 1–3), each containing the indicated number of animals per genotype. Horizontal lines show means. (b) Percentage of live adults of the same genotypes up to 30 days after pupal hatching. 40 animals of each genotype were analyzed in triplicate; dark lines show mean and shading shows ±standard deviation. c Same as (a) but for WT, CTCF0 and animals with CTCF expression restricted to NSCs, neurons or muscle. d Same as (b) but for genotypes indicated in (c).
Fig. 2
Fig. 2. Physical insulation defects in CTCF0 mutants.
a Percentage of n = 740 CTCF peaks with at least one contact domain (CD) boundary at a given distance (per 2 kb bins) around the CTCF peak. Enrichment of CD boundaries around the same number of random positions (gray) is shown as control. b Percentage of n = 3458 CD boundaries with at least one CTCF peak at a given distance (per 2 kb bins) around the CD boundary. Enrichment of CTCF peaks around the same number of random positions (gray) is shown as a control. c Example locus (dm6 coordinates) Hi-C maps, eigenvector values (positive for A compartment, negative for B compartment), CD boundaries from this study (color-coded as in Fig. 2d) and a Hi-C study in cultured cells, physical insulation score (calculated with different window sizes in gray, average in black), CTCF ChIP-seq (CTCF peaks highlighted and numbered), CTCF motif orientations in DNA, and gene tracks in WT (top) and CTCF0 (middle) larval CNSs. (Below) Differential (CTCF0 minus WT) Hi-C map and physical insulation score. d Position of CTCF peaks around all CD boundaries defined in any genotype (n = 3970 boundaries) ranked by physical insulation score differences measured in CTCF0 minus WT Hi-C maps. Visibly weaker boundaries in CTCF0 (score > +0.1) or in WT (score < −0.1) are bracketed. Boundaries are color-coded in all figures as present in both WT and CTCF0 (blue), only in WT (red) or only in CTCF0 (green). e Physical insulation score differences measured in CTCF0 minus WT Hi-C maps around CTCF peaks, ranked by CTCF ChIP occupancy in WT. f Average physical insulation scores around CTCF peaks in WT (black) and CTCF0 (red). g GFP pull-down of tagged CTCF N-terminus (residues 1–123) that is WT (GFP-CTCF-NWT) or Y248A F250A point mutant (GFP-CTCF-Nmut) mixed with untagged recombinant cohesin subcomplex (residues 102–1085 of SA and 273-458 of Vtd). Specific retention of cohesin by CTCF (lane 5) is higher than the background binding of SA-Vtd to beads (lanes 4, 6). Asterisks mark GFP-CTCF-N degradation. CES conserved essential surface, ZnF zinc finger.
Fig. 3
Fig. 3. CTCF impacts expression patterns of genes near CTCF peaks.
a RNA-seq MA plot of CTCF0 versus WT CNSs with mean abundance (in x) plotted as a function of enrichment (in y). Differentially expressed (DE) genes (padj < 0.05 and |fold change| > 1.5) are red. bd RNA-seq signals in WT (black) and CTCF0 (red) larval CNSs, and CTCF ChIP-seq signals in WT (green) and CTCF0 (red) larval CNSs at CG1354 (b), IFT52 (c) and Tsp (d) loci. Differentially transcribed regions are shaded in red. Scales in tracks of all figures indicate reads per million. In all figures, CTCF peaks labeled by capital letters were tested in Fig. 4c. e RNA-FISH with antisense probes (red) against indicated transcripts in CNSs of wildtype and CTCF0 larvae stained by DAPI (blue) (scale bars 100 µm). mRNAs of SP1029, IFT52 and an antisense transcript overlapping can (shown in Supplementary Fig. 3b) are normally not expressed in wildtype CNSs (background signal is sometimes visible in trachea) and are misexpressed in different patterns in CTCF0 mutants. All animals showed similar misexpression patterns for a given transcript. f Percentage (in y) of n = 386 DE genes in CTCF0 larval CNSs (black) or n = 386 randomly sampled expression-level-matched non-DE genes (gray) with at least one of 740 CTCF peaks at a given distance (per 2 kb bins) around the gene TSS, measured in the direction of transcription (in x). Ten percent of DE genes have at least one CTCF peak within ±1 kb of their TSS, which is ninefold higher than the average enrichment at the sampled non-DE genes. g Percentage (in y) of CTCF peaks with at least one of n = 386 DE gene TSSs (black) or n = 386 randomly sampled expression-level-matched non-DE gene TSSs (gray) at a given distance (per 2 kb bins) around CTCF peaks, measured in the direction of transcription (in x). Five percent of CTCF peaks have at least one DE gene TSS within ±1 kb, which is 9-fold higher than at the sampled non-DE TSSs.
Fig. 4
Fig. 4. CTCF occupancy scales with enhancer-blocker activity in a reporter assay.
a In the reporter plasmid, a test insulator I is cloned in between an enhancer E and EGFP, and mCherry serves as a reference (elements are drawn to scale, arrowheads represent Hsp70 minimal promoters). A gypsy insulator G is present downstream of EGFP to block EGFP activation by the enhancer (which in a circular plasmid molecule is both upstream and downstream of EGFP) from the left. b Split violin plots (thick lines mark medians, boxes mark interquartile ranges) show distributions of mCherry (left) and EGFP (right) fluorescence intensities (log10 values in y) measured in thousands of single S2 cells transiently transfected with reporters with indicated I fragments (in x). mCherry-to-EGFP ratios (log2 values in y) in single cells are shown below. For each reporter, merged biological triplicates are plotted. c Median mCherry-to-EGFP ratios in single transfected S2 cells (log2 values in y) relative to CTCF ChIP-seq counts in S2 cells 42 (log10 values in x) on selected CTCF peaks (labeled A–N, Supplementary Fig. 4c) cloned as I fragments. n = 2 (M), 3 (H, I, L, N) or 4 (A–G, J, K, N mut) biological replicates (dots) and mean values (horizontal lines) are shown. As a reference, mean values obtained with the gypsy insulator or a neutral spacer are indicated as horizontal lines. As a control, a CTCF motif in fragment N was mutated, leading to fragment N mut for which CTCF ChIP occupancy was not determined.
Fig. 5
Fig. 5. CTCF recruits Cp190 to a subset of Cp190-bound domain boundaries.
a Overlap between CTCF (green) and Cp190 (blue) peaks in WT, and regions with reduced Cp190 binding in CTCF0 relative to WT (red). Some peaks were split for three-way comparisons (see “Methods”). b Cp190 ChIP-seq signal in WT or CTCF0 around CTCF peaks, ranked by CTCF occupancy in WT. c Distribution of indicated datasets around CD boundaries defined in any genotype (n = 3970 boundaries) ranked by insulation defects in CTCF0. (1) Insulation score differences in CTCF0 minus WT. Visibly weaker boundaries in CTCF0 (score > +0.1) or in WT (score < −0.1) are bracketed. On the right, boundaries are classified as in Fig. 2d. (2–4) ChIP occupancy of CTCF peaks in WT, Cp190 peaks in WT or Cp190 peaks in CTCF0. (5) Differential Cp190 ChIP occupancy in CTCF0 minus WT. (6) Expressed TSSs in WT and CTCF0 with similar (gray), increased (red) or decreased (blue) expression in CTCF0 relative to WT. d As above for CD boundaries with a CTCF peak within ±2 kb (n = 349 boundaries) centered on the closest CTCF peak classified as TSS-proximal (within ±200 bp of a TSS) or distal (lane 7). e Numbers of CD boundaries bound by CTCF in WT (n = 349 boundaries) that are present or absent in CTCF0 mutants, and whose associated CTCF peak overlaps or not a residual Cp190 peak in CTCF0 mutants (p-val = 3.1e−6, two-sided Fisher’s Exact Test for Count Data). f Physical insulation score differences in CTCF0 minus WT at CTCF-bound CD boundaries (n = 349 boundaries) are higher when the associated CTCF peak does not overlap a residual Cp190 peak in CTCF0 mutants, or a TSS within 200 bp (indicated p values and W-statistics from two-sided Wilcoxon rank-sum test with continuity correction). Box plot: center line, median; box limits, upper and lower quartiles; whiskers, 1.5× interquartile ranges; points, outliers; n = CTCF peaks of each category (in x). g Example locus like Fig. 2c also displaying Cp190 ChIP-seq signal in WT and CTCF0 mutant larval CNSs. Asterisks mark Cp190 peaks in CTCF0 mutants with reduced occupancy relative to WT revealed by differential analysis. Solid arrowheads mark strictly CTCF-dependent boundaries (the second boundary was not called by TopDom), empty arrowheads mark partially CTCF-dependent boundaries.
Fig. 6
Fig. 6. CTCF and Cp190 co-regulate a subset of target genes.
a DE genes (with padj<0.05 and |fold change| > 1.5) in CTCF0 and/or Cp190KO mutant larval CNSs relative to WT with detectable expression in both differential RNA-seq analyses (omitting 55 DE genes in CTCF0 and 54 DE genes in Cp190KO that had low counts in the other differential analysis) are plotted in light blue and red. DE genes common in CTCF0 and Cp190KO mutants are highlighted in red and counted in each quadrant. Pearson’s correlation coefficient and p-value show correlated changes of common DE genes. The red line shows linear regression and gray shadowing the corresponding 95% confidence interval. b Extended SP1029 gene locus displaying CTCF ChIP-seq (peaks numbered and highlighted in green), CTCF motif orientations in DNA, Cp190 ChIP-seq, and mRNA-seq tracks (DE genes highlighted in red) in WT (top), CTCF0 (middle) and Cp190KO CNSs (bottom). Asterisks mark Cp190 peaks in CTCF0 mutants with reduced occupancy relative to WT revealed by differential analysis. c Lateral views of 11 h old embryos of labeled genotypes (columns) in 3 confocal sections (rows) subjected to SP1029 RNA-FISH (scale bars 100 µm). Arrowheads mark SP1029 misexpression in the nerve chord of CTCF0 and Cp1900 mutants (filled arrowheads), not occurring in WT embryos (empty arrowhead). d As Fig. 6b for the extended CG15478 gene locus. Residual Cp190 ChIP signal in Cp190KO mutants could be maternally deposited Cp190 or non-specific ChIP signal. e As Fig. 6c for CG15478 RNA-FISH. Arrowheads mark CG15478 expression in the brain and nerve chord of WT embryos (filled arrowheads), strongly reduced in CTCF0 and Cp1900 mutants (empty arrowheads). f Wildtype Drosophila contact domain boundaries are strictly CTCF-dependent, partially CTCF-dependent, or not bound by CTCF. CTCF recruits Cp190 to CTCF-dependent boundaries, and Cp190 is recruited independently to additional boundaries many of which are close to transcribed gene promoters. In CTCF0 mutants, Cp190 is lost from strictly CTCF-dependent boundaries, while at other former CTCF peaks residual Cp190 binding is associated with partial boundary retention. CTCF-dependent boundaries can prevent regulatory crosstalk (double-sided arrows) between genes and regulatory elements positioned on either side, and Cp190 co-regulates a subset of genes together with CTCF.

References

    1. Rao SSP, et al. Cohesin loss eliminates all loop domains. Cell. 2017;171:305–309.e24. doi: 10.1016/j.cell.2017.09.026. - DOI - PMC - PubMed
    1. Rowley, M. J. et al. Evolutionarily conserved principles predict 3D chromatin organization. Mol. Cell67, 837–852.e7 (2017). - PMC - PubMed
    1. Rowley MJ, Corces VG. Organizational principles of 3D genome architecture. Nat. Rev. Genet. 2018;19:1–800. doi: 10.1038/s41576-018-0060-8. - DOI - PMC - PubMed
    1. Rao SSP, et al. A 3D map of the human genome at kilobase resolution reveals principles of chromatin looping. Cell. 2014;159:1665–1680. doi: 10.1016/j.cell.2014.11.021. - DOI - PMC - PubMed
    1. Sanborn AL, et al. Chromatin extrusion explains key features of loop and domain formation in wild-type and engineered genomes. Proc. Natl Acad. Sci. USA. 2015;112:E6456–E6465. doi: 10.1073/pnas.1518552112. - DOI - PMC - PubMed

Publication types