. 2021 Feb 12;12(1):985.
doi: 10.1038/s41467-021-21255-8.

The acquisition of molecular drivers in pediatric therapy-related myeloid neoplasms

Affiliations

The acquisition of molecular drivers in pediatric therapy-related myeloid neoplasms

Jason R Schwartz et al. Nat Commun. .

Abstract

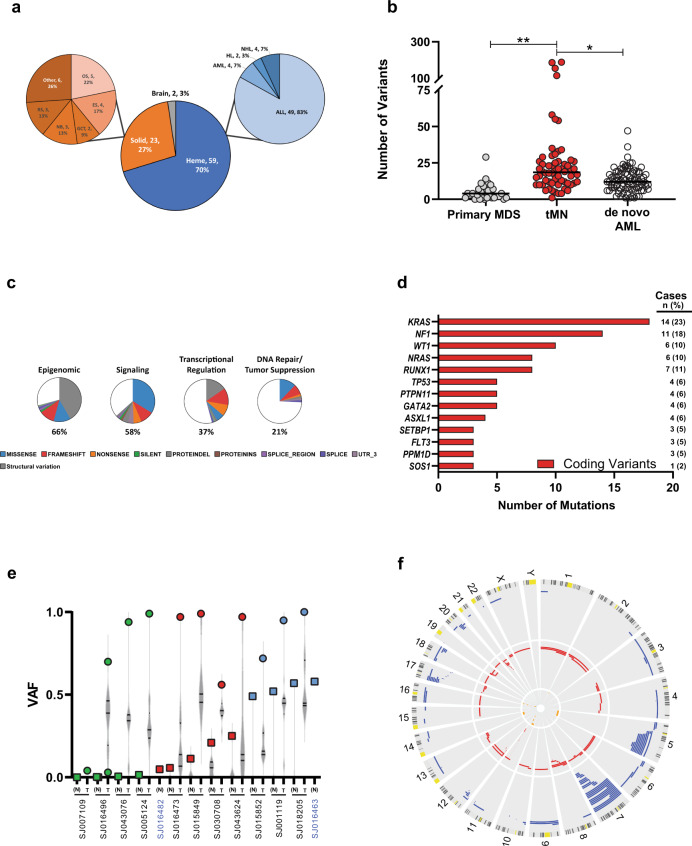
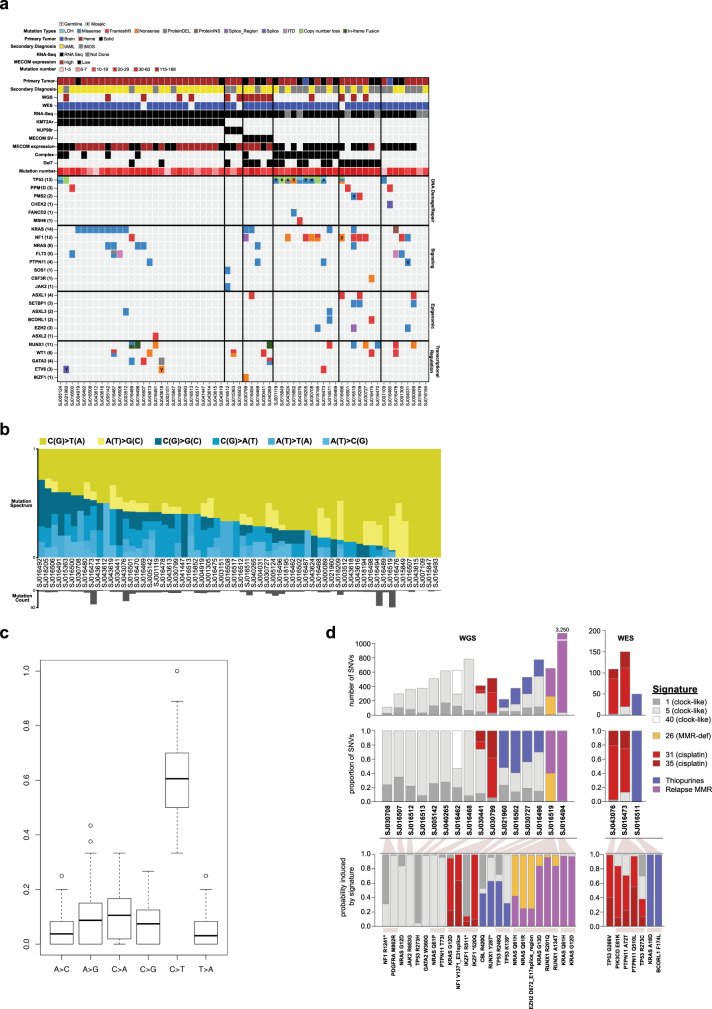
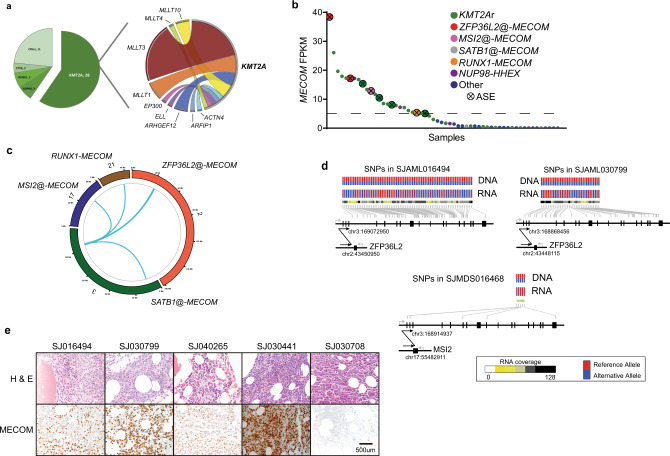
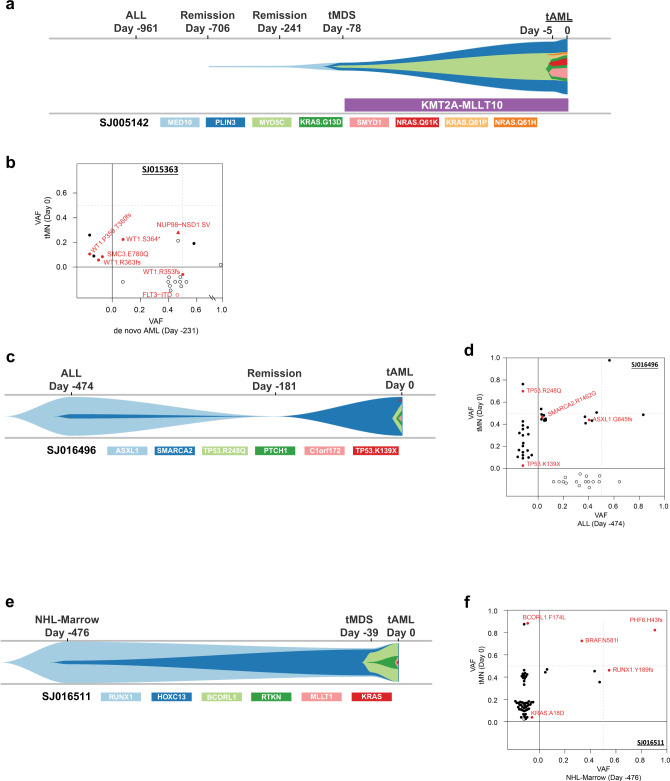
Pediatric therapy-related myeloid neoplasms (tMN) occur in children after exposure to cytotoxic therapy and have a dismal prognosis. The somatic and germline genomic alterations that drive these myeloid neoplasms in children and how they arise have yet to be comprehensively described. We use whole exome, whole genome, and/or RNA sequencing to characterize the genomic profile of 84 pediatric tMN cases (tMDS: n = 28, tAML: n = 56). Our data show that Ras/MAPK pathway mutations, alterations in RUNX1 or TP53, and KMT2A rearrangements are frequent somatic drivers, and we identify cases with aberrant MECOM expression secondary to enhancer hijacking. Unlike adults with tMN, we find no evidence of pre-existing minor tMN clones (including those with TP53 mutations), but rather the majority of cases are unrelated clones arising as a consequence of cytotoxic therapy. These studies also uncover rare cases of lineage switch disease rather than true secondary neoplasms.


Conflict of interest statement

The authors declare no competing interests.

Figures

Fig. 1
Fig. 1. Clinical and genomic features of the pediatric tMN cohort.
a Pie charts depicting the distribution of initial diagnoses within the pediatric tMN cohort. AML acute myeloid leukemia, HL Hodgkin lymphoma, NHL non-Hodgkin lymphoma, ALL acute lymphoblastic leukemia, OS osteosarcoma, ES Ewing sarcoma, GCT germ cell tumor, NB neuroblastoma, RS rhabdomyosarcoma, Other includes: embryonal sarcoma, Wilms tumor, rhabdoid tumor, ovarian carcinoma, and peripheral neuroepithelioma. b Total number of somatic mutations per patient (includes the following mutation types: silent, nonsense, frameshift, indel, splice site, ITD, RNA coding genes, 3′ and 5′ UTR) compared to pediatric primary MDS and de novo AML.*p < 0.001; **p < 0.0001. Black bar indicates the median. Wilcoxon–Mann–Whitney non-parametric, two-tailed test used to compare biologically independent samples from n = 62 tMN, n = 32 primary MDS, and n = 87 de novo AML cases. c Pie charts showing the distribution of recurrently mutated pathways in the pediatric tMN cohort and the distribution of mutation types within each pathway. Percentages refer to the frequency of mutations within a pathway amongst all somatic mutations present in the cohort. d The genes most frequently mutated (somatic) in pediatric tMN—Only coding variants are shown. e VAF plot showing the 13 patients with TP53 mutations (SNV or indel). Tumor (T; circles) and normal (N; squares) are shown for each unique patient. Green symbols denote cases with VAFs suggesting somatic variants, blue symbols denote cases with clear germline variants in the normal tissue, and red symbols denote cases with TP53 mosaicism. *p < 0.01 for binomial mosaicism test. Violin plots represent the range of VAFs for all somatic variants in that case. Black bars indicate the median and upper and lower quartiles. Note: SJ016482 and SJ016463 are from the normal only group of patients (blue font). f Circos plot showing copy number alterations found via WES (n = 58) & WGS (n = 4) analysis of 62 tumor/normal pairs. Circumferential numbers indicate chromosome number, blue lines = deletions, red lines = amplifications, and orange lines = CN-LOH.
Fig. 2
Fig. 2. Comprehensive mutational spectrum of pediatric tMN.
a Heat map showing the integrated analysis of the pediatric tMN cohort with tumor and non-tumor material (n = 62). b Mutational spectrum of 62 tumor/normal pairs. Yellow and blue bars show the relative contribution of transitions and transversion. Gray bars at bottom indicate number of mutations present for each patient. c Bar graph showing the mean relative contribution of each transition or transversion. C > T transitions are the most common transition or transversion in 60 of 62 patients (96.7%; 95% CI: 88.8–99.6%; p = 2.7 × 10−44 by exact binomial test). Boxes delineate the upper and lower quartiles and the black bar indicates the median. d Mutation signature analysis on 16 cases with available WGS and 3 cases with WES with >30 SNVs. Top: absolute number of SNVs and the contribution of specific COSMIC, thiopurine, and relapse MMR signatures. Middle: relative contribution of specific COSMIC, thiopurine, and relapse MMR signatures. Bottom: select disease relevant mutations present in each patient and the probability that each is induced by the indicated mutational process.
Fig. 3
Fig. 3. Structural variations and MECOM dysregulation in pediatric tMN.
a Pie chart showing the distribution of in-frame fusions (n = 47) found in the pediatric tMN cohort (left). Ribbon plot showing the KMT2A binding partners found in pediatric tMN (right). The weight of the ribbon correlates to the frequency of the fusion. b MECOM FPKM plot for cases with RNA-Seq (n = 56). Dashed line indicates the level above which cases were classified as MECOMHigh. ASE allele specific expression. c Circos plot indicting the MECOM SVs found in the pediatric tMN cohort. Chromosome number and specific SV is listed around outside of ring. d Allele-specific RNA expression resulting from structural variants. Heterozygous SNPs (genomic positions indicated by gray lines; red: reference allele; blue: alternative allele) detected in tumor DNA exhibited mono-allelic expression in tumor RNA. Structural alterations are indicated by arrows with breakpoints listed. Sequencing depth for each SNP in RNA-Seq are indicated as a heatmap. e Photomicrographs of bone marrow core biopsy of 4 cases with high MECOM expression (right panels: MECOM (Evi-1) IHC: 1C50E12, Cell Signaling Technology, dilution: 1:500) and a control case (SJ030708) with low/absent MECOM expression. Immunohistochemistry was performed once on the patient material available. All images are at equal magnification (20x).
Fig. 4
Fig. 4. Clonal evolution of pediatric tMN.
a A river plot showing a representative case where tMN variants occurred only after exposure to cytotoxic therapy. In this case the founding tMN clone was detectable 628 days prior to morphologic diagnosis of tMDS. b A 2-dimensional VAF plot showing that the tMN and de novo AML were actually related via a NUP98-NDS1 fusion (red triangle) and a subclonal WT1 variant. c, d River- and 2d-plots showing an ALL related to the subsequent tMN through an ASXL1-mutant founding clone with a SMARCA2 subclone, and following chemotherapy an outgrowth of the SMARCA2 clone with subsequent acquisition of 2 TP53 subclones. e, f River- and 2d-plots showing staging bone marrow collected at time of NHL diagnosis related to the subsequent tMN through a RUNX1 founding clone with eventual acquisition BCORL1 and KRAS subclones, which paralleled the development of tMDS and tAML, respectively. 2-d plot NOTE: upper right-hand quadrant contains shared variants between the 2 time-points (X and Y axes). Open symbols indicate variants with WGS or WES only. Closed symbols indicate variants validated via capture resequencing.

References

    1. Tsurusawa M, et al. Therapy-related myelodysplastic syndrome in childhood: a retrospective study of 36 patients in Japan. Leuk. Res. 2005;29:625–632. doi: 10.1016/j.leukres.2004.11.018. - DOI - PubMed
    1. Brown CA, Youlden DR, Aitken JF, Moore AS. Therapy-related acute myeloid leukemia following treatment for cancer in childhood: a population-based registry study. Pediatr. Blood Cancer. 2018;65:e27410. doi: 10.1002/pbc.27410. - DOI - PubMed
    1. Imamura T, et al. Nationwide survey of therapy-related leukemia in childhood in Japan. Int. J. Hematol. 2018;108:91–97. doi: 10.1007/s12185-018-2439-x. - DOI - PubMed
    1. Aguilera DG, et al. Pediatric therapy-related myelodysplastic syndrome/acute myeloid leukemia: the MD Anderson Cancer Center experience. J. Pediatr. Hematol. Oncol. 2009;31:803–811. doi: 10.1097/MPH.0b013e3181ba43dc. - DOI - PubMed
    1. Wong TN, et al. Role of TP53 mutations in the origin and evolution of therapy-related acute myeloid leukaemia. Nature. 2015;518:552–555. doi: 10.1038/nature13968. - DOI - PMC - PubMed

Publication types

Substances