. 2021 Feb 12;7(1):10.
doi: 10.1038/s41540-021-00170-0.

Predicted 'wiring landscape' of Ras-effector interactions in 29 human tissues

Affiliations

Predicted 'wiring landscape' of Ras-effector interactions in 29 human tissues

Simona Catozzi et al. NPJ Syst Biol Appl. .

Abstract

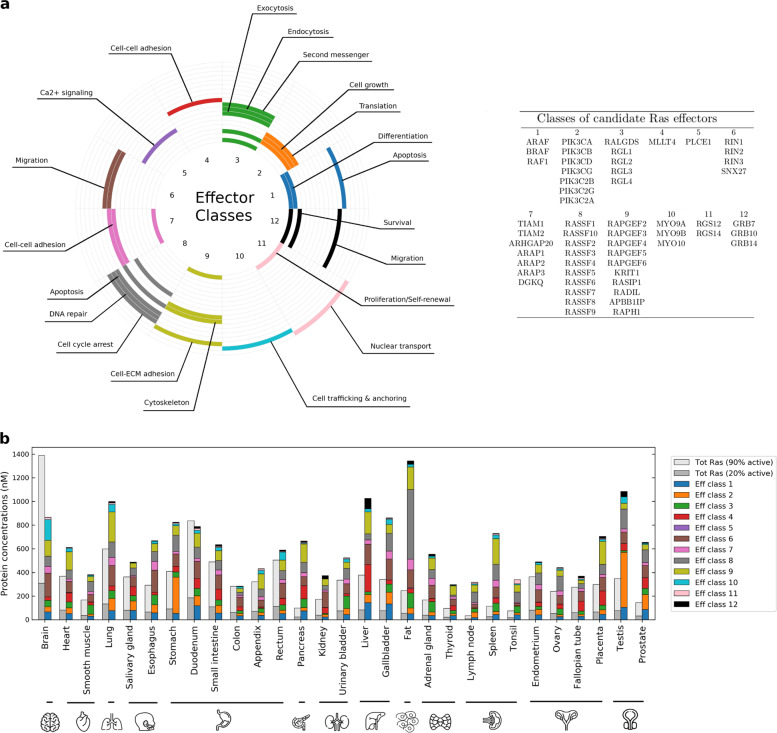
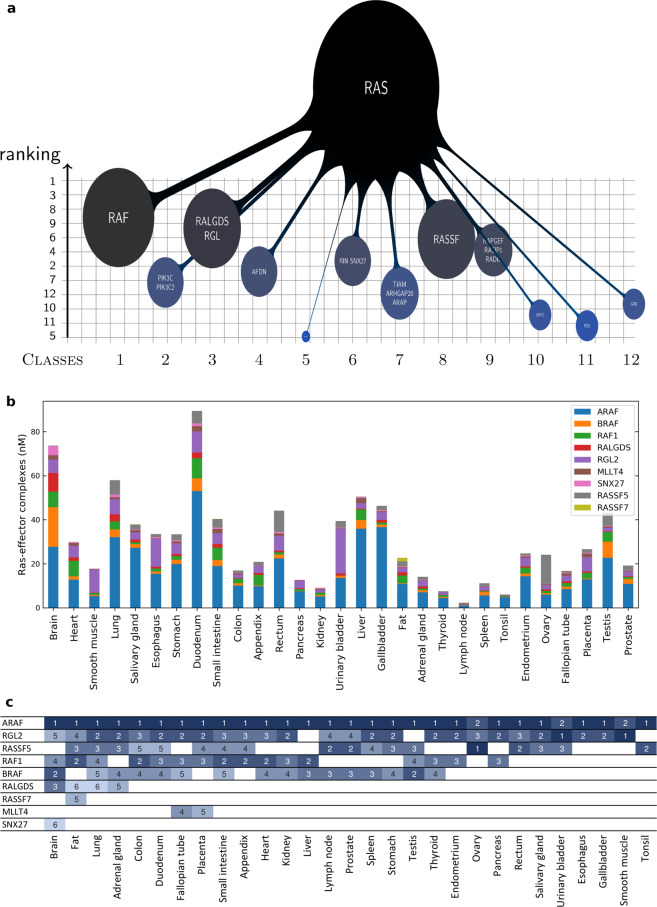
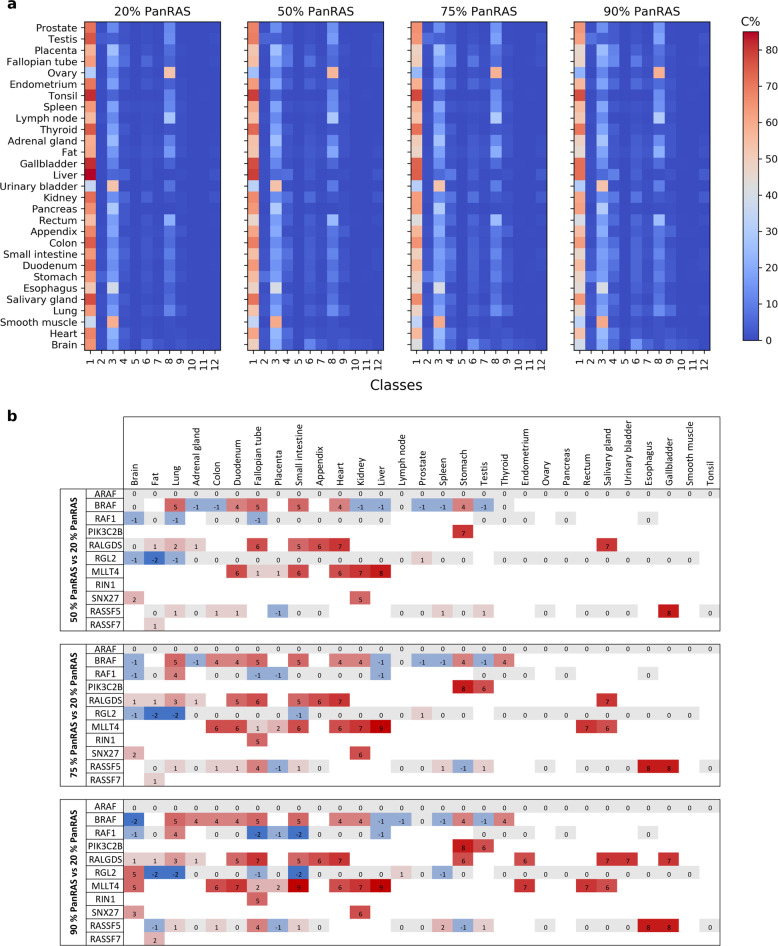
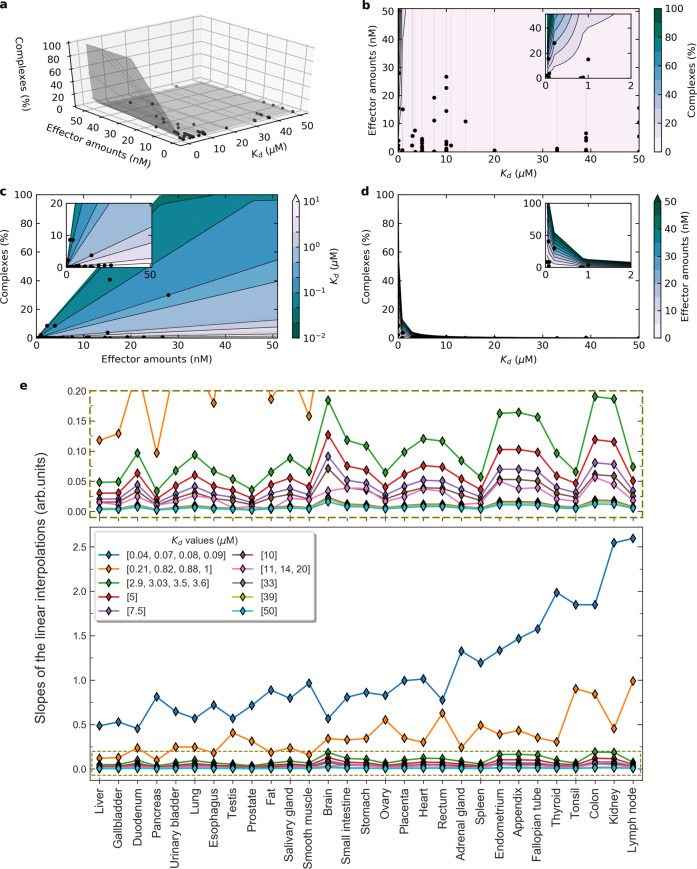
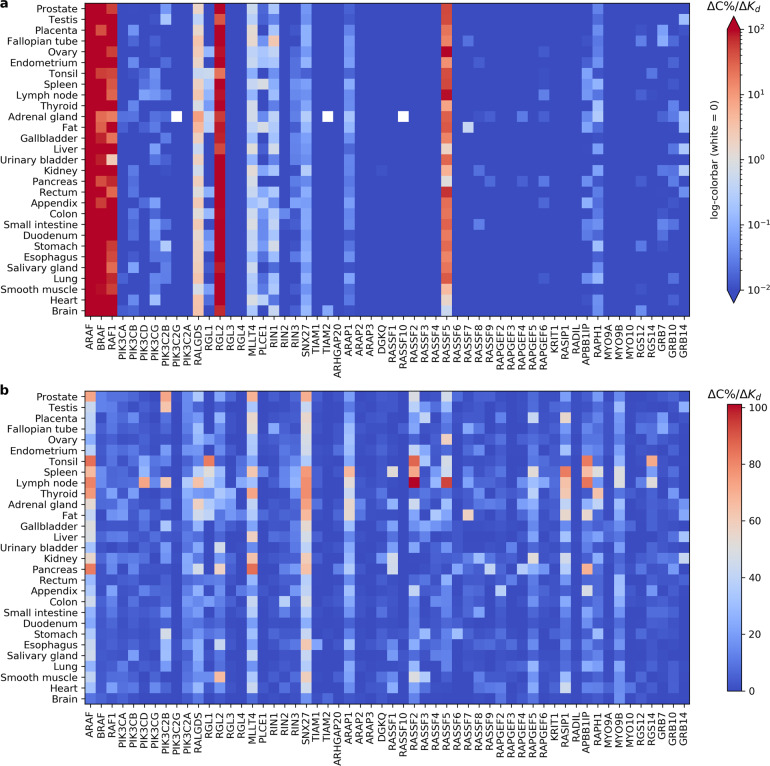
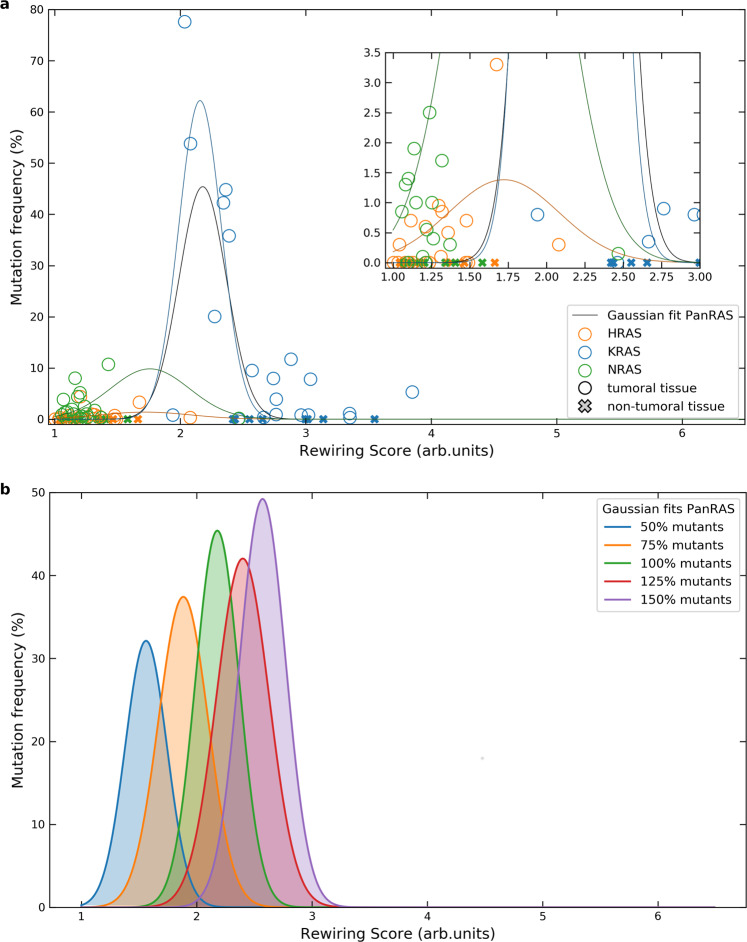
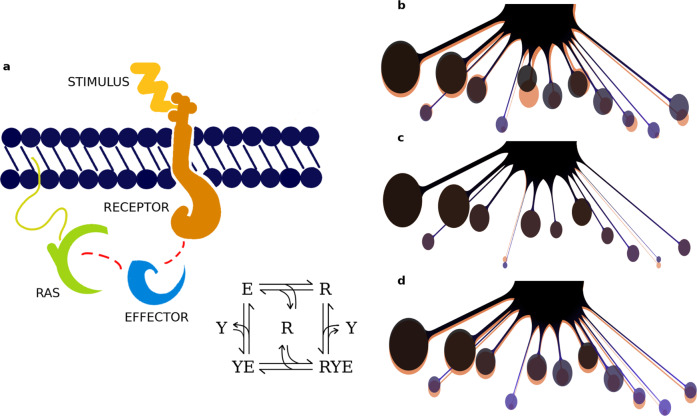
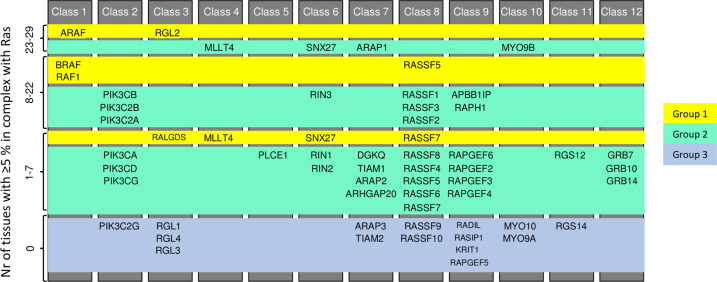
Ras is a plasma membrane (PM)-associated signaling hub protein that interacts with its partners (effectors) in a mutually exclusive fashion. We have shown earlier that competition for binding and hence the occurrence of specific binding events at a hub protein can modulate the activation of downstream pathways. Here, using a mechanistic modeling approach that incorporates high-quality proteomic data of Ras and 56 effectors in 29 (healthy) human tissues, we quantified the amount of individual Ras-effector complexes, and characterized the (stationary) Ras "wiring landscape" specific to each tissue. We identified nine effectors that are in significant amount in complex with Ras in at least one of the 29 tissues. We simulated both mutant- and stimulus-induced network re-configurations, and assessed their divergence from the reference scenario, specifically discussing a case study for two stimuli in three epithelial tissues. These analyses pointed to 32 effectors that are in significant amount in complex with Ras only if they are additionally recruited to the PM, e.g. via membrane-binding domains or domains binding to activated receptors at the PM. Altogether, our data emphasize the importance of tissue context for binding events at the Ras signaling hub.


Conflict of interest statement

The authors declare no competing interests.

Figures

Fig. 1
Fig. 1. The Ras-effector signaling system and protein abundances in 29 human tissues.
a Table of effectors and their categorization into 12 classes, to which are associated different signaling pathways and cellular responses. b Bar plot comparing the level of Ras proteins (for 20% or 90% GTP load, in gray) against the level of Ras effectors (class-specific abundance colored as per the legend). Concentrations of active Ras (H-, K-, and NRAS summed up together) in any of the 29 tissues are generally larger than the concentrations of all the effectors, thus satisfying the condition of competitive binding. Only exceptions are in brain and duodenum, although limited to the case where all Ras proteins are GTP loaded (90% active).
Fig. 2
Fig. 2. Hierarchies of Ras-effector complexes and key effectors in 29 human tissues.
a Example of an “octopus” network representation for the Ras binding profile by class (in lung tissue). The effector classes are ordered along the x-axis and ranked on the y-axis based on their relative amount bound to (20% GTP-loaded) Ras, at steady state. The bubbles on the grid show the repartition (in percentage) of such complexes, according to a discrete and a continuous scale, i.e. size and color variation, respectively. b Tissue-specific variation of Ras-effector complexes (in nM) for a set of 9 effectors that are in complex with Ras for a proportion of ≥5% in at least one tissue. c Ranking of the complexes associated to the nine effectors of panel b (deduced from the y-axis of the octopus plots, like in panel a). Color code from highest (1st) to lowest (6th) ranked (from dark to light blue) shows that these key effectors usually enter the list of the top six most abundant Ras complexes, if expressed. Tissues on the x-axis are ordered according to the number of involved key effectors per tissue.
Fig. 3
Fig. 3. Ras-effector complexes for varying PanRas levels.
a Heatmap of the predicted Ras-effector complexes (C%) in 29 human tissues, for different quantities – 20% to 90% – of Ras GTP (here denoted PanRAS, referring to the sum of the three oncoproteins HRAS, KRAS, and NRAS). b Change in ranking position of the 9 key effectors, for varying PanRas concentration (from 50 to 90% with respect to the 20% PanRas scenario). Negative/positive values (respectively blue/red) indicate a down-/up-ranking, zero values (gray) show a no-change.
Fig. 4
Fig. 4. Affinities and effector concentrations as determinants of complex formation at the Ras signaling hub.
ad Three-dimensional data (affinity, abundances, and complexes) represented in the 3D space and its 2D projections, for lymph node tissue. Surfaces are interpolated from the linear regressions of complexes (%) vs effector amounts (nM), for fixed affinities Kd values. Such lines are shown in light gray and the data points in black. (See also Appendices 4 and 5.) e Slopes of the linear interpolations of complexes (%) vs effector amounts (nM) for different Kd ranges, in 29 human tissues. The slopes for Kd ranges [2.9,50] (i.e. for medium-to-low affinity, cf. panel above) show a consistent trend; while for higher affinities (Kd in [0.04,1]) we observe more variability. Tissues are sorted by increasing average slope per tissue over the whole affinity range (Kd in [0.04,50] μM), namely from least to most sensitive to affinity variations.
Fig. 5
Fig. 5. Binding affinity sensitivity analysis.
Local (a) and global (b) one-at-a-time perturbation of the parameter Kd, dissociation constant of the Ras-effector complexes, in 29 tissues. The heatmaps show the change in the output ∆C (%) to the change of the input ∆Kd spanning (a) in the interval [Kd −10%, Kd +10%] and (b) in the interval [0.04,0.527] µM.
Fig. 6
Fig. 6. Analysis of the relation between isoform-specific network rewiring and mutation frequencies for different mutant levels.
a Data points and fits are calculated for Ras isoform mutants with a 100% GTP load. Gaussian interpolations on both Ras isoform-specific and PanRas-general data are traced in solid lines (respectively, blue, orange, and green, for H-, K-, and NRAS; black for all the dataset). Each fit is performed excluding the tissues which rarely are associated with cancer (see main text); the corresponding data points are indicated with cross markers. The parameters for the Gaussian fits, for H-, K-, N-, and PanRAS are, respectively: mean of 1.72, 2.15, 1.76, and 2.18, and standard deviation of 0.36, 0.17, 0.32, and 0.19. b Mutation frequency vs. network rewiring score for varying level of Ras isoform mutants (from 50% to 150%). Gaussian fits are performed on PanRas data points. Parameters for the fits (from left to right) are the following – means: 1.56, 1.89, 2.18, 2.4, 2.57; standard deviations: 0.18, 0.21, 0.19, 0.22, 0.2.
Fig. 7
Fig. 7. Stimulus-dependent mechanism of network rewiring.
a Graphical representation and reaction scheme of receptor-mediated Ras-effector interactions. Such compounds can assemble via the Ras binding domain (RBD), either directly, or through the piggyback mechanism (receptor-mediated). This latter is triggered by external stimulation (e.g. EGF) and induces the recruitment of an effector to bind a (active) transmembrane receptor (via a specific domain, e.g. SH2 or PDZ). As a result, the concentration of effector proteins at the membrane, that can then assemble into a complex with Ras, is enhanced. bd “Octopus” plots visualizing the amount of Ras-effector complexes (%) associated to 12 downstream pathways. In orange, it is represented the reference (unstimulated) Ras-binding profile (20% active Ras was assumed), which is overlapped to the profile, in purple, perturbed with b EGF, c PVRL3, or d the combination of the two stimuli (in those three cases, as a consequence of stimulation, 90% active Ras was considered). Stimulus-induced rewiring is the result of a change in competitivity among the effectors, and reflects the property, for the Ras network, to be able to adapt and respond to the specific cell needs.
Fig. 8
Fig. 8. Key effectors for Ras signaling.
Contribution of each of the 56 effectors to Ras binding was analyzed according to a 5%-complex-formation threshold, both for the unstimulated and the stimulated Ras network. Each effector forming a complex for at least 5%, in the unstimulated case, was classified in Group 1; if this happened in the stimulated case (according to the results from global sensitivity), it entered Group 2; otherwise it fed into the last group. – Group 1: efficient Ras-effector complex formation with RBD. Group 2: efficient Ras-effector complex formation with RBD and additional domains recruited to the plasma membrane. Group 3: inefficient Ras-effector complex formation.

Similar articles

Cited by

References

    1. Wang Y, Sahni N, Vidal M. Global edgetic rewiring in cancer networks. Cell Syst. 2015;1:251–253. doi: 10.1016/j.cels.2015.10.006. - DOI - PubMed
    1. van Boxel-Dezaire AH, Rani MR, Stark GR. Complex modulation of cell type-specific signaling in response to type I interferons. Immunity. 2006;25:361–372. doi: 10.1016/j.immuni.2006.08.014. - DOI - PubMed
    1. Miller-Jensen K, Janes KA, Brugge JS, Lauffenburger DA. Common effector processing mediates cell-specific responses to stimuli. Nature. 2007;448:604–608. doi: 10.1038/nature06001. - DOI - PubMed
    1. Kiel C, Serrano L. Cell type-specific importance of ras-c-raf complex association rate constants for MAPK signaling. Sci. Signal. 2009;2:ra38. doi: 10.1126/scisignal.2000397. - DOI - PubMed
    1. Schaefer MH, Yang JS, Serrano L, Kiel C. Protein conservation and variation suggest mechanisms of cell type-specific modulation of signaling pathways. PLoS Comput. Biol. 2014;10:e1003659. doi: 10.1371/journal.pcbi.1003659. - DOI - PMC - PubMed

Publication types

MeSH terms

LinkOut - more resources