

Characterization of kinesthetic motor imagery compared with visual motor imageries
- PMID: 33580093
- PMCID: PMC7881019
- DOI: 10.1038/s41598-021-82241-0
Characterization of kinesthetic motor imagery compared with visual motor imageries
Abstract
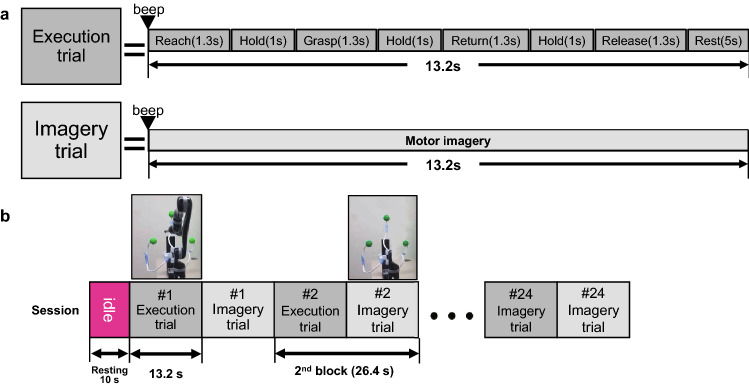
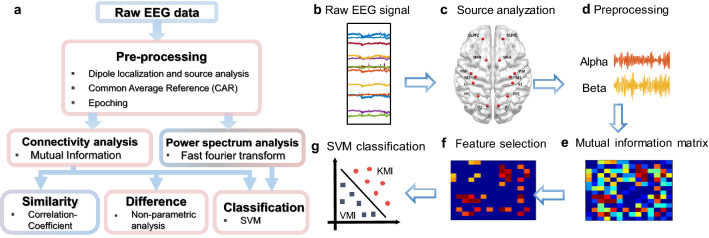
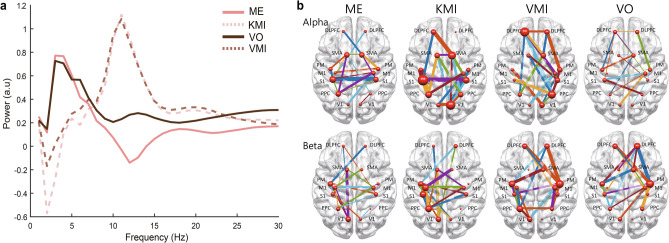
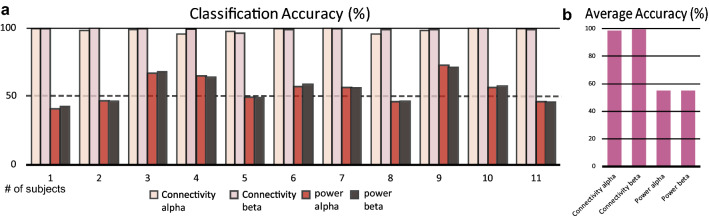
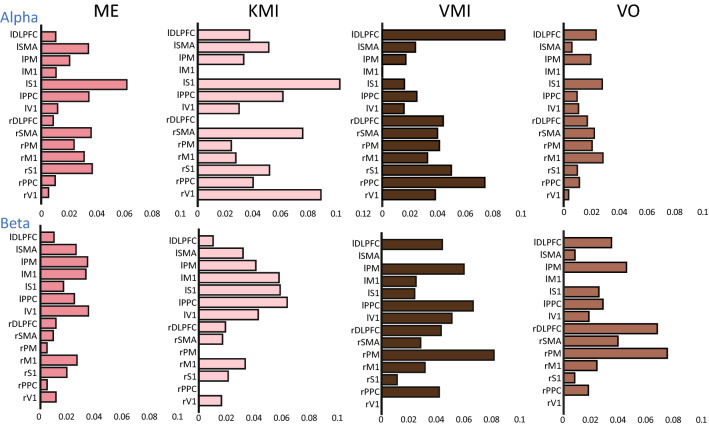
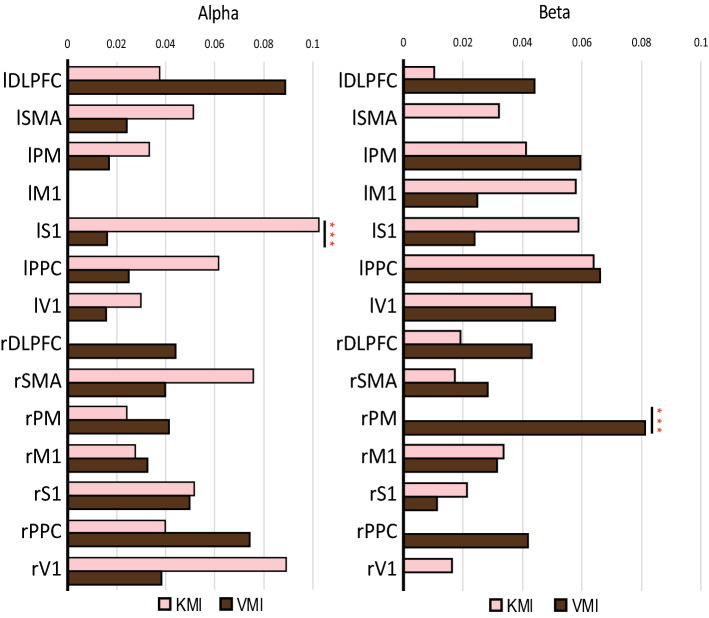
Motor imagery (MI) is the only way for disabled subjects to robustly use a robot arm with a brain-machine interface. There are two main types of MI. Kinesthetic motor imagery (KMI) is proprioceptive (OR somato-) sensory imagination and Visual motor imagery (VMI) represents a visualization of the corresponding movement incorporating the visual network. Because these imagery tactics may use different networks, we hypothesized that the connectivity measures could characterize the two imageries better than the local activity. Electroencephalography data were recorded. Subjects performed different conditions, including motor execution (ME), KMI, VMI, and visual observation (VO). We tried to classify the KMI and VMI by conventional power analysis and by the connectivity measures. The mean accuracies of the classification of the KMI and VMI were 98.5% and 99.29% by connectivity measures (alpha and beta, respectively), which were higher than those by the normalized power (p < 0.01, Wilcoxon paired rank test). Additionally, the connectivity patterns were correlated between the ME-KMI and between the VO-VMI. The degree centrality (DC) was significantly higher in the left-S1 at the alpha-band in the KMI than in the VMI. The MI could be well classified because the KMI recruits a similar network to the ME. These findings could contribute to MI training methods.
Conflict of interest statement
The authors declare no competing interests.
Figures
Similar articles
-
Relationship Between Kinesthetic/Visual Motor Imagery Difficulty and Event-Related Desynchronization/Synchronization.Annu Int Conf IEEE Eng Med Biol Soc. 2018 Jul;2018:1911-1914. doi: 10.1109/EMBC.2018.8512673. Annu Int Conf IEEE Eng Med Biol Soc. 2018. PMID: 30440771
-
Subjective Vividness of Kinesthetic Motor Imagery Is Associated With the Similarity in Magnitude of Sensorimotor Event-Related Desynchronization Between Motor Execution and Motor Imagery.Front Hum Neurosci. 2018 Jul 31;12:295. doi: 10.3389/fnhum.2018.00295. eCollection 2018. Front Hum Neurosci. 2018. PMID: 30108492 Free PMC article.
-
Enhancing the quality of kinesthetic motor imagery for complex motor skills through simulated muscle activation color visualization: Evidence from time-frequency and functional connectivity analyses.Neuroimage. 2025 Apr 1;309:121051. doi: 10.1016/j.neuroimage.2025.121051. Epub 2025 Feb 4. Neuroimage. 2025. PMID: 39914512
-
How Kinesthetic Motor Imagery works: a predictive-processing theory of visualization in sports and motor expertise.J Physiol Paris. 2015 Feb-Jun;109(1-3):53-63. doi: 10.1016/j.jphysparis.2015.02.003. Epub 2015 Mar 25. J Physiol Paris. 2015. PMID: 25817985 Review.
-
Motor Imagery: How to Assess, Improve Its Performance, and Apply It for Psychosis Diagnostics.Diagnostics (Basel). 2022 Apr 11;12(4):949. doi: 10.3390/diagnostics12040949. Diagnostics (Basel). 2022. PMID: 35453997 Free PMC article. Review.
Cited by
-
T-RAC: Study protocol of a randomised clinical trial for assessing the acceptability and preliminary efficacy of adding an exergame-augmented dynamic imagery intervention to the behavioural activation treatment of depression.PLoS One. 2023 Jul 31;18(7):e0288910. doi: 10.1371/journal.pone.0288910. eCollection 2023. PLoS One. 2023. PMID: 37523359 Free PMC article.
-
Kinesthetic vs. visual focus: No evidence for effects of practice modality in representation types after action imagery practice and action execution practice.Hum Mov Sci. 2023 Dec;92:103154. doi: 10.1016/j.humov.2023.103154. Epub 2023 Oct 14. Hum Mov Sci. 2023. PMID: 37844453 Free PMC article.
-
The Role of Interoceptive Sensitivity and Hypnotizability in Motor Imagery.Brain Sci. 2024 Aug 19;14(8):832. doi: 10.3390/brainsci14080832. Brain Sci. 2024. PMID: 39199523 Free PMC article.
-
Motor imagery evokes strengthened activation in sensorimotor areas and its effective connectivity related to cognitive regions in patients with complete spinal cord injury.Brain Imaging Behav. 2022 Oct;16(5):2049-2060. doi: 10.1007/s11682-022-00675-0. Epub 2022 Aug 22. Brain Imaging Behav. 2022. PMID: 35994188
-
Cardiac cycle modulates alpha and beta suppression during motor imagery.Cereb Cortex. 2024 Nov 5;34(11):bhae442. doi: 10.1093/cercor/bhae442. Cereb Cortex. 2024. PMID: 39579013 Free PMC article.
References
-
- Wolpaw JR, Wolpaw EW. Brain–Computer Interfaces: Principles and Practice. Oxford: Oxford University Press; 2012.
Publication types
LinkOut - more resources
Full Text Sources
Other Literature Sources
Medical
