. 2021 Feb 12;11(1):3755.
doi: 10.1038/s41598-021-82540-6.

Reduced nest development of reared Bombus terrestris within apiary dense human-modified landscapes

Affiliations

Reduced nest development of reared Bombus terrestris within apiary dense human-modified landscapes

Ivan Meeus et al. Sci Rep. .

Abstract

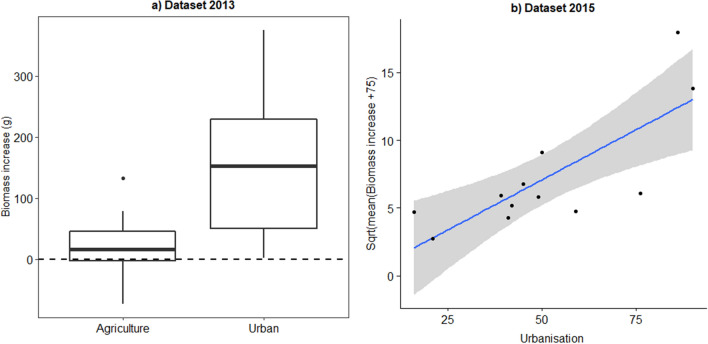
Wild bees are in decline on a local to global scale. The presence of managed honey bees can lead to competition for resources with wild bee species, which has not been investigated so far for human-modified landscapes. In this study we assess if managed honey bee hive density influence nest development (biomass) of bumble bees, an important trait affecting fitness. We hypothesize that domesticated honey bees can negatively affect Bombus terrestris nest development in human-modified landscapes. In Flanders, Belgium, where such landscapes are dominantly present, we selected 11 locations with landscape metrics ranging from urban to agricultural. The bee hive locations were mapped and each location contained one apiary dense (AD) and one apiary sparse (AS) study site (mean density of 7.6 ± 5.7 managed honey bee hives per km2 in AD sites). We assessed the effect of apiary density on the reproduction of reared B. terrestris nests. Reared B. terrestris nests had more biomass increase over 8 weeks in apiary sparse (AS) sites compared to nests located in apiary dense (AD) sites. This effect was mainly visible in urban locations, where nest in AS sites have 99.25 ± 60.99 g more biomass increase compared to nest in urban AD sites. Additionally, we found that managed bumble bee nests had higher biomass increase in urban locations. We conclude that the density of bee hives is a factor to consider in regard to interspecific competition between domesticated honey bees and bumble bees.


Conflict of interest statement

The authors declare no competing interests.

Figures

Figure 1
Figure 1
Multidimensional scaling was used to visualize the land cover dissimilarity matrix (calculation based on Euclidean distance). Circles represent AD (apiary dense) site and overlap with AS (apiary sparse) sites (rectangles) and paired sites are connected (showing that paired sites have similar land covers). The landscape types are: urban = blue, agricultural = red, and semi-urban = green.
Figure 2
Figure 2
Cohen's d effect size are positive when the bumble bee nest biomass increase in apiary sparse (AS) sites is greater than in apiary dense (AD) sites (a proxy for higher nest fitness). Circles represent the dataset of 2013, while squares represent the dataset of 2015. The filled circles represent locations dominated with agricultural landscape elements. In each location (n = 12; 6 in 2013 and 6 in 2015) we had 2 × 3 B. terrestris nests (n = 72). Linear mixed-effects models are performed on individual data points (this is 3 nests per site, 2 sites (AD and AS) per location, 6 locations per year and 2 years or 3*2*6*2 = 72 data points) and not on Cohen's d effect sizes, which are for visualization purpose only. To calculate the effect size between AS and AD sites we used the Cohen's d formula.
Figure 3
Figure 3
The frequency densities of the biomass increase of a bumble bee nests (in grams) in three different landscape types (Agriculture; Semi Urban, and Urban). The blue–green graphs represent apiary sparse (AS) sites, the red are apiary dense (AD) sites.
Figure 4
Figure 4
Biomass increase of bumble bee nests in relation to the land cover parameter urbanisation. (A) In the dataset of 2013 we had 3 urban locations while 3 locations had an agricultural character (each locations had 6 nests, with a total of 36 nests). (B) In 2015 the % urbanisation in the 6 locations showed a gradual increase (each locations had 6 nests, with a total of 36 nests). In both years urbanisation had a positive influence on the development of Bombus terrestris nests.

Similar articles

Cited by

References

    1. Ollerton J, Winfree R, Tarrant S. How many flowering plants are pollinated by animals? Oikos. 2011;120:321–326. doi: 10.1111/j.1600-0706.2010.18644.x. - DOI
    1. Klein AM, et al. Importance of pollinators in changing landscapes for world crops. Proc. R. Soc. B Biol. Sci. 2007;274:303–313. doi: 10.1098/rspb.2006.3721. - DOI - PMC - PubMed
    1. Kremen C, Williams NM, Thorp RW. Crop pollination from native bees at risk from agricultural intensification. Proc. Natl. Acad. Sci. U.S.A. 2002;99:16812–16816. doi: 10.1073/pnas.262413599. - DOI - PMC - PubMed
    1. Potts SG, et al. Global pollinator declines: Trends, impacts and drivers. Trends Ecol. Evol. 2010;25:345–353. doi: 10.1016/j.tree.2010.01.007. - DOI - PubMed
    1. Tscharntke T, et al. Landscape moderation of biodiversity patterns and processes—Eight hypotheses. Biol. Rev. 2012;87:661–685. doi: 10.1111/j.1469-185X.2011.00216.x. - DOI - PubMed

Publication types