. 2021 Feb 12;4(1):196.
doi: 10.1038/s42003-021-01725-x.

Bridgehead effect and multiple introductions shape the global invasion history of a termite

Affiliations

Bridgehead effect and multiple introductions shape the global invasion history of a termite

Alexander J Blumenfeld et al. Commun Biol. .

Abstract

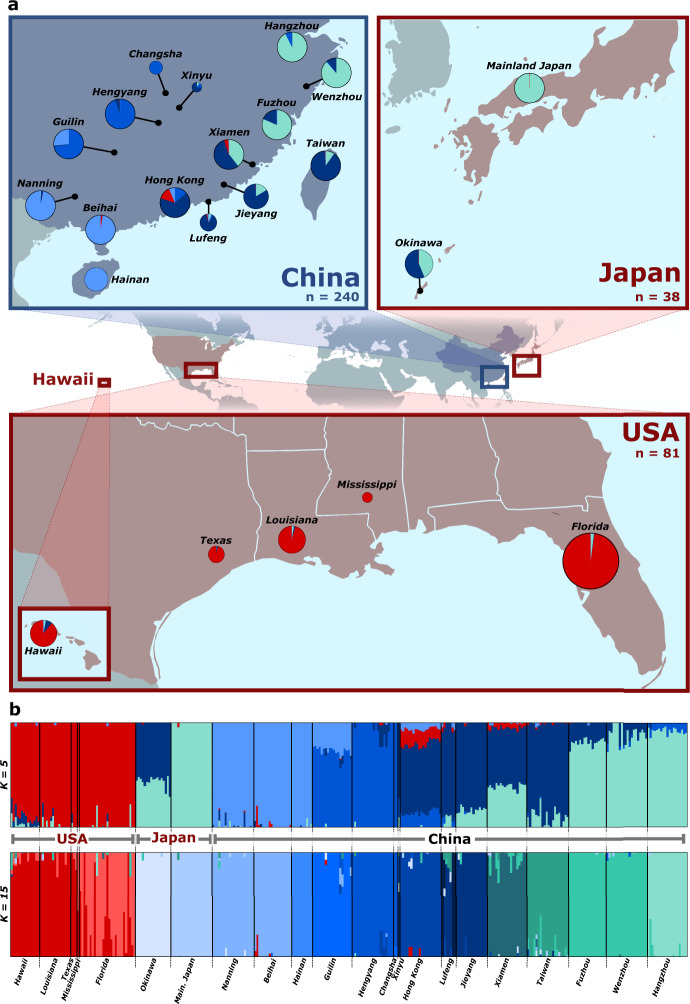
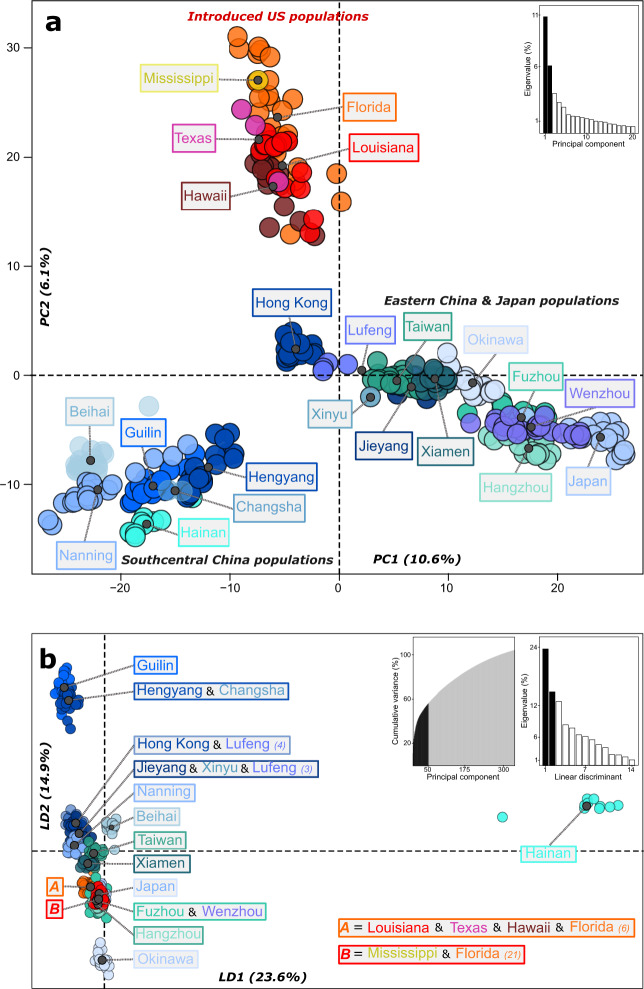
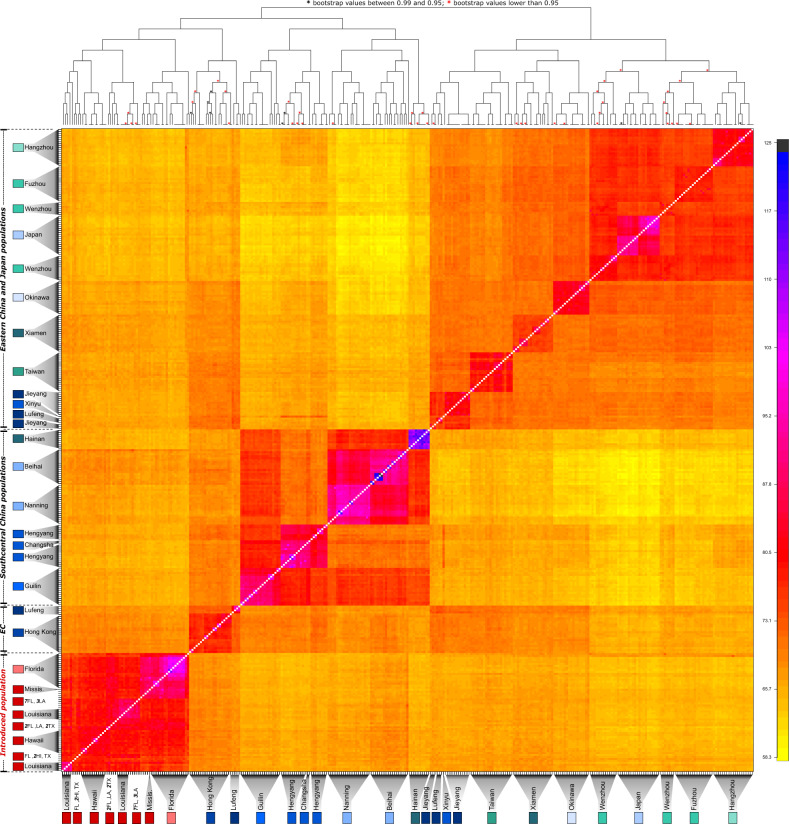
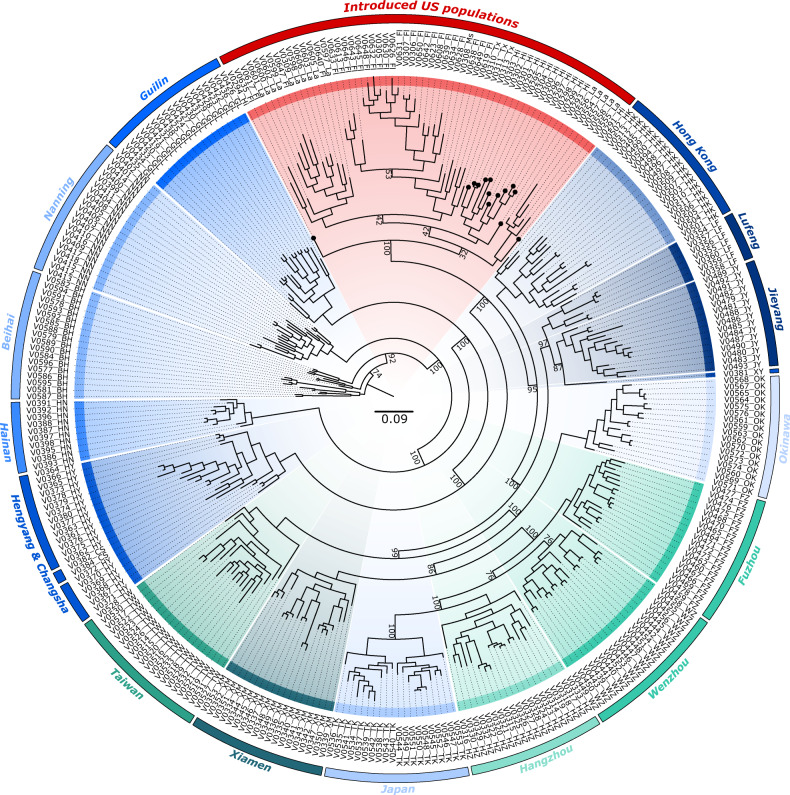
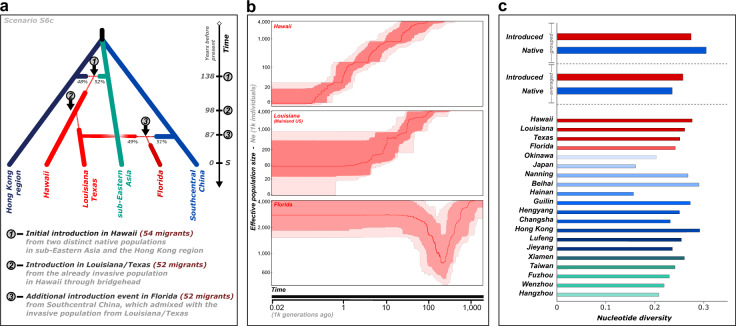
Native to eastern Asia, the Formosan subterranean termite Coptotermes formosanus (Shiraki) is recognized as one of the 100 worst invasive pests in the world, with established populations in Japan, Hawaii and the southeastern United States. Despite its importance, the native source(s) of C. formosanus introductions and their invasive pathway out of Asia remain elusive. Using ~22,000 SNPs, we retraced the invasion history of this species through approximate Bayesian computation and assessed the consequences of the invasion on its genetic patterns and demography. We show a complex invasion history, where an initial introduction to Hawaii resulted from two distinct introduction events from eastern Asia and the Hong Kong region. The admixed Hawaiian population subsequently served as the source, through a bridgehead, for one introduction to the southeastern US. A separate introduction event from southcentral China subsequently occurred in Florida showing admixture with the first introduction. Overall, these findings further reinforce the pivotal role of bridgeheads in shaping species distributions in the Anthropocene and illustrate that the global distribution of C. formosanus has been shaped by multiple introductions out of China, which may have prevented and possibly reversed the loss of genetic diversity within its invasive range.


Conflict of interest statement

The authors declare no competing interests.

Figures

Fig. 1
Fig. 1. Genetic clustering of C. formosanus populations.
a Pie charts of fastSTRUCTURE assignments (for K = 5) for each sampling location of C. formosanus in its native and introduced range. Pie chart size is proportional to the number of samples. b fastSTRUCTURE assignment for each individual sampled for K = 5 and 15. Each color represents a distinct genetic cluster and each vertical bar represents an individual.
Fig. 2
Fig. 2. Population substructure in the global C. formosanus population.
a Principal component analysis (PCA) of all C. formosanus individuals. The axes represent the first two principal components (PC). Only the first 20 PC’s (out of 324) are shown in the eigenvalue inset graph, with the black bars representing the two plotted PCs. b Discriminant analysis of principal components (DAPC) with best support for K = 15 genetic clusters. The axes represent the first two linear discriminants (LD). The first inset graph shows the cumulative variation explained by the PCs, with only the PCs in the black shaded area utilized for the DAPC. The second inset graph depicts the eigenvalues for all linear discriminants, with the black bars representing the two plotted LDs.
Fig. 3
Fig. 3. fineRADstructure analysis of C. formosanus.
Co-ancestry matrix between each pair of individuals inferred using fineRADstructure. Each pixel represents the individual co-ancestry coefficient between two individuals. Low co-ancestry coefficient values are depicted by yellow colors, whereas high values are indicated by darker colors.
Fig. 4
Fig. 4. Maximum likelihood phylogenetic tree of C. formosanus.
The sampling locations are colored according to their fastSTRUCTURE assignments (K = 15). For clarity, bootstrap values are only indicated for major branching events. Samples from Hawaii are highlighted with a round tip.
Fig. 5
Fig. 5. The invasion history of C. formosanus.
a Graphical representation of the most likely invasion history scenario for C. formosanus out of Asia tested through ABC RF. Thin dotted lines represent bottleneck events. Estimated duration of each bottleneck event, as well as all of the posterior parameter estimates are provided in Supplementary Table 11. Time is not to scale, with S indicating sampling time. b Estimation of the variation of effective population size through time for three invasive localities using Stairway Plot 2. The solid red line is the estimate of the median effective population size, and the light and dark red shaded areas represent the 95% and 75% confidence intervals, respectively. c Nucleotide diversity in the introduced and native range. All native and introduced localities were first analyzed while grouped together, then independently.

References

    1. Lewis SL, Maslin MA. Defining the Anthropocene. Nature. 2015;519:171–180. doi: 10.1038/nature14258. - DOI - PubMed
    1. Capinha C, Essl F, Seebens H, Moser D, Miguel Pereira H. The dispersal of alien species redefines biogeography in the Anthropocene. Science. 2015;348:1248–1251. doi: 10.1126/science.aaa8913. - DOI - PubMed
    1. Hulme PE. Trade, transport and trouble: managing invasive species pathways in an era of globalization. J. Appl. Ecol. 2009;46:10–18. doi: 10.1111/j.1365-2664.2008.01600.x. - DOI
    1. Meyerson LA, Mooney HA. Invasive alien species in an era of globalization. Front. Ecol. Environ. 2007;5:199–208. doi: 10.1890/1540-9295(2007)5[199:IASIAE]2.0.CO;2. - DOI
    1. Banks NC, Paini DR, Bayliss KL, Hodda M. The role of global trade and transport network topology in the human-mediated dispersal of alien species. Ecol. Lett. 2015;18:188–199. doi: 10.1111/ele.12397. - DOI - PubMed

Publication types

LinkOut - more resources