. 2021 Feb 12;4(1):194.
doi: 10.1038/s42003-021-01723-z.

Molecular and phenotypic analysis of rodent models reveals conserved and species-specific modulators of human sarcopenia

Affiliations

Molecular and phenotypic analysis of rodent models reveals conserved and species-specific modulators of human sarcopenia

Anastasiya Börsch et al. Commun Biol. .

Abstract

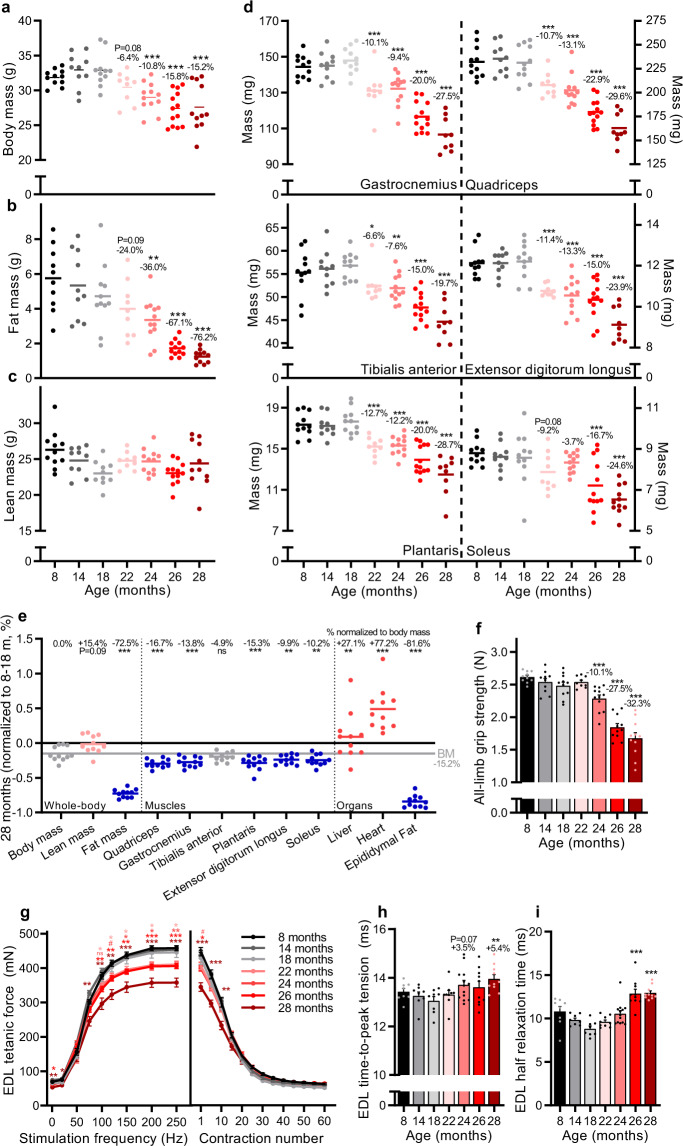
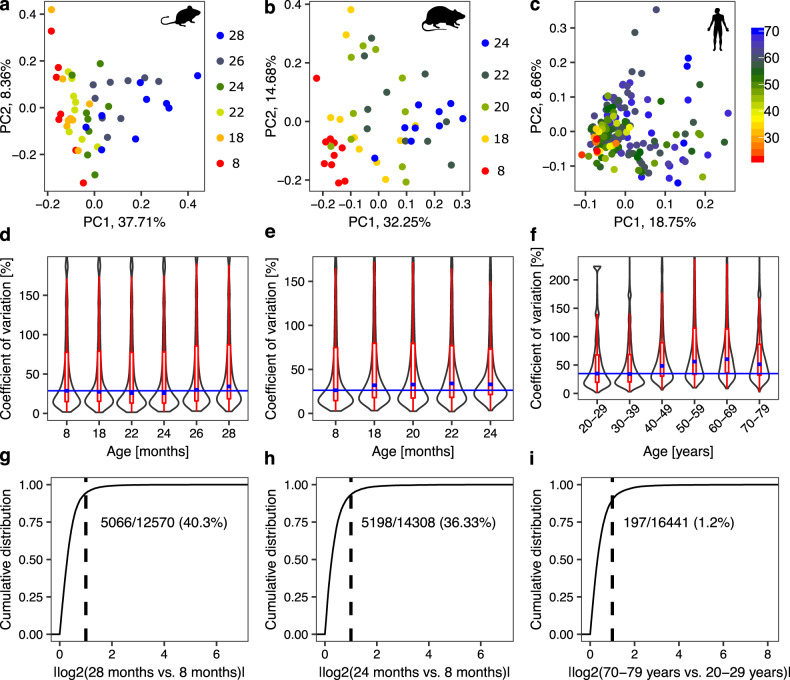
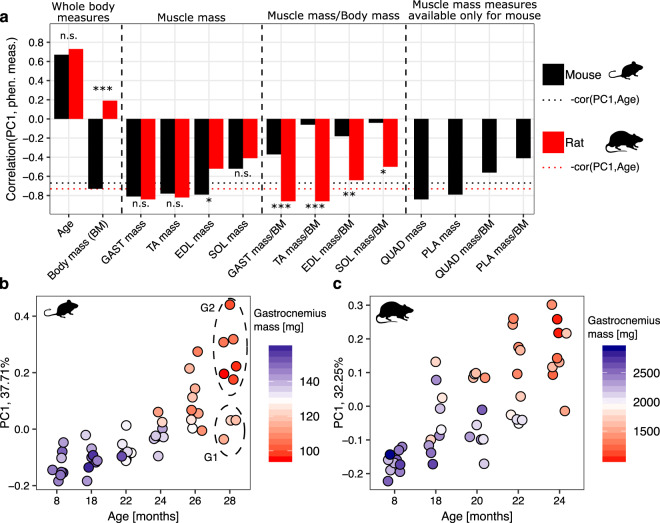
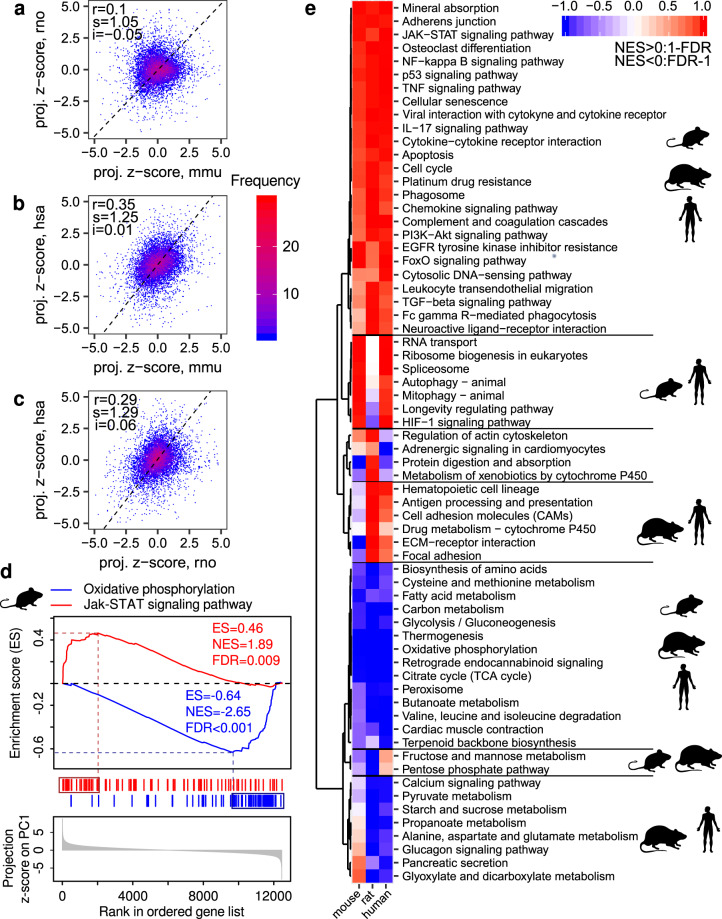
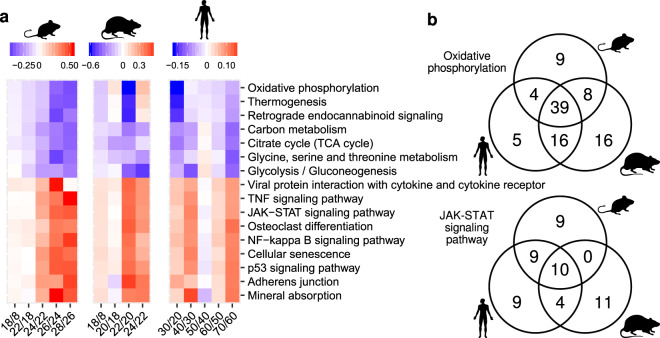
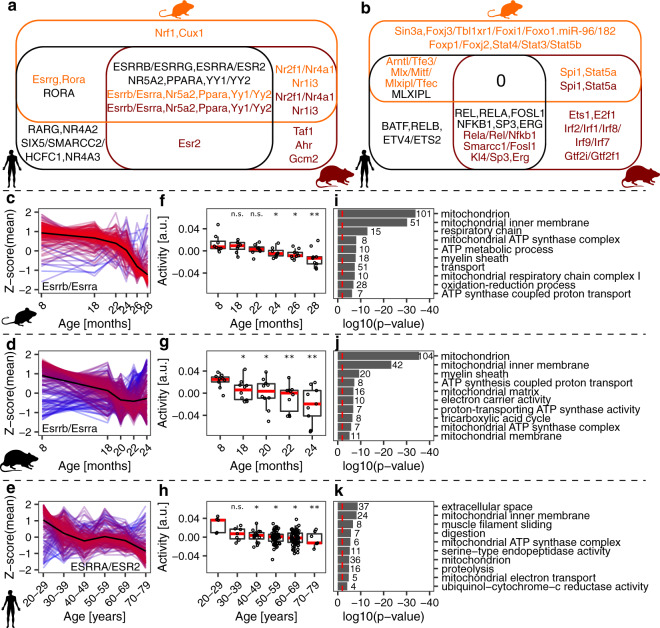
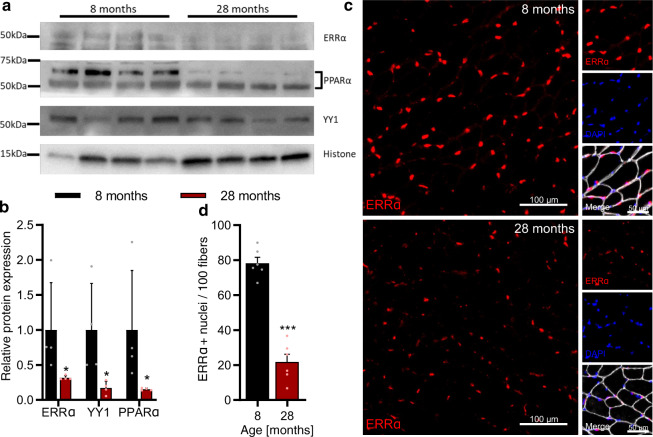
Sarcopenia, the age-related loss of skeletal muscle mass and function, affects 5-13% of individuals aged over 60 years. While rodents are widely-used model organisms, which aspects of sarcopenia are recapitulated in different animal models is unknown. Here we generated a time series of phenotypic measurements and RNA sequencing data in mouse gastrocnemius muscle and analyzed them alongside analogous data from rats and humans. We found that rodents recapitulate mitochondrial changes observed in human sarcopenia, while inflammatory responses are conserved at pathway but not gene level. Perturbations in the extracellular matrix are shared by rats, while mice recapitulate changes in RNA processing and autophagy. We inferred transcription regulators of early and late transcriptome changes, which could be targeted therapeutically. Our study demonstrates that phenotypic measurements, such as muscle mass, are better indicators of muscle health than chronological age and should be considered when analyzing aging-related molecular data.


Conflict of interest statement

Authors E.M. and J.N.F. declare the following competing interests: they are full-time employees of Nestlé SA. All other authors declare no competing interests.

Figures

Fig. 1
Fig. 1. Muscle mass and function progressively decline in male C57BL/6JRj mice during aging.
a Body mass for 8, 14, 18, 22, 24, 26, and 28 months-old mouse groups. EchoMRI measurements of b fat and c whole-body lean mass. d Absolute muscle mass for quadriceps (QUAD), gastrocnemius (GAS), tibialis anterior (TA), plantaris (PLA), extensor digitorum longus (EDL) and soleus (SOL) averaged across both limbs. e Body, lean and fat mass as well as muscle tissue and organ mass in 28 months-old mice normalized to the mean of 8, 14, and 18 months-old groups. The mean percentage loss in mass relative to body mass is reported above each data set. The color scheme designates the direction of changes and significance: gray is not different (p-value > 0.10), red is increased (p-value < 0.05), blue is decreased (p-value < 0.05), light red is a trend for increased (0.05 < p-value < 0.10). f Recordings of all-limb grip strength. Isolated EDL muscle function parameters, including g force-frequency curve (left) and fatigue response to multiple stimulations (right); and twitch time-to-peak tension in (h) and half relaxation time in (i). Group numbers of biological replicates are: n = 9–13 in (af); n = 7–12 in (g) (left); n = 5–11 in (g) (right) and n = 7–12 in (h-i). For statistical comparisons 8, 14, and 18 months-old groups were pooled and compared with each of the other four groups. One-way ANOVAs with Dunnett’s post hoc tests were used to compare between 8 and 18 months data and the other four groups. *, ** and *** denote a significant difference between groups of p-value < 0.05, p-value < 0.01 and p-value < 0.001, respectively. Trends (0.05 < p-value < 0.10) are denoted by # or the p-value specified. Colored asterisks refer to the group of comparison. All values were visualized as mean ± standard error of the mean (SE).
Fig. 2
Fig. 2. Summary of gene expression changes in the gastrocnemius muscle during aging across species.
ac Principal component analysis (PCA) of transcript abundances during muscle aging in mice in (a), rats in (b) and humans in (c). Each dot corresponds to one sample with colors indicating organism age. The numbers associated with PCs indicate the fraction of the variance in gene expression across samples along the corresponding PC. df Distribution of the coefficients of variation (CVs) of individual genes per age/age group for mice in (d), rats in (e) and humans in (f). The higher the CV, the more variable the expression of the gene across replicates. Thin blue lines are baselines indicating the median CV for the youngest age/age group. Median values of CVs for other ages/age groups (thick blue lines within violin plots) are mostly located over the baseline, especially for older ages/age groups, indicating higher heterogeneity across replicates for these ages/age groups in comparison to the youngest one. Limits for y-axis were set to include both the 25th and 75th percentiles of data points and up to 1.5 times the interquartile range in both directions from percentiles (red). gi Cumulative distribution of absolute log2-fold changes in gene expression between the youngest and oldest age groups of mice in (g), rats in (h) and humans in (i). Differential expression analysis was performed with the EdgeR tool. Dashed lines designate the position of the log2-fold change of 1, numbers correspond to the fraction of genes with significantly different expression among all genes in the group of oldest compared to the group of youngest individuals (FDR < 0.01). Group numbers for age groups of biological replicates are: n = 8–9 for mouse, n = 9–10 for rat and n = 5–79 for human.
Fig. 3
Fig. 3. Correlation between PC1 and phenotypic measurements in rodents.
a Values of the Pearson correlation coefficient between PC1 and phenotypic measurements for mice (black) and rats (red) during aging. Black and red dotted horizontal lines are baselines representing the negative value of the correlation coefficient of PC1 with age for mouse and rat, respectively. Fisher’s test was used to compare Pearson correlation coefficients obtained for the same measure for mouse and rat, *p-value < 0.05, **p-value < 0.01, ***p-value < 0.001, “n.s.” not significant (p-value ≥ 0.05). b, c PC1 coordinates of mouse and rat RNA-Seq data sets, respectively, grouped by age and colored by the gastrocnemius mass. With dashed ellipses we marked two groups of 28 months-old mouse replicates (“G1” and “G2”) used for subsequent differential expression analysis. BM body mass, GAST gastrocnemius, TA tibialis anterior, EDL extensor digitorum longus, SOL soleus, QUAD quadriceps, PLA plantaris.
Fig. 4
Fig. 4. Changes in gene expression and pathway activities during gastrocnemius aging across species.
ac Correlation between the standardized PC1 projections for individual genes (projection z-scores) across species. “mmu”, “rno” and “hsa” designate “Mus musculus” (mouse), “Rattus norvegicus” (rat) and “Homo sapiens” (human), respectively. “r” indicates the value of the Pearson correlation coefficient. Black dashed lines correspond to directions of the highest variance for comparisons, with the slope “s” and intercept “i”. d Schema of the gene set enrichment analysis (GSEA) for the KEGG pathways “Oxidative phosphorylation” and “Jak-STAT signaling pathway” for the mouse gastrocnemius time course RNA-Seq data. ES enrichment score, NES normalized enrichment score. e Heatmap summarizing the enrichment of KEGG pathways among genes ranked by projection z-scores for mouse, rat, and human, respectively. A pathway was included in the heatmap if it was significantly enriched in at least one organism with the significance threshold FDR < 0.01. Hierarchical clustering revealed pathways with a similar response during muscle aging in two or more species.
Fig. 5
Fig. 5. The timing of changes in core age-related pathways.
a Slopes of changes in the expression of genes from KEGG pathways that were significantly enriched for all considered species in GSEA (FDR < 0.1). The mean expression in replicates of the same age for each gene from the leading edge was calculated (see further description in the text). For humans, the mean expression was calculated for replicates from the age groups 20–29, 30–39, 40–49, 50–59, 60–69, and 70–79 years. The slopes defined by mean gene expression changes in neighboring time points (or age groups) were used to calculate median values across genes from the leading edge, which are visualized (Supplementary Fig. 7). b Venn diagrams of genes from the leading edge of two representative pathways across species.
Fig. 6
Fig. 6. ISMARA-inferred activity of transcription factors (TFs) and miRNAs during muscle aging.
a Venn diagram of motifs associated with TFs and miRNAs whose targets were downregulated during muscle aging. b Venn diagram of motifs associated with TFs and miRNAs whose targets were upregulated during muscle aging. Names of TFs and miRNAs are color-coded with respect to species: orange—mouse, brown—rat, black—human. ce The normalized expression (z-scores of mean log2(TPMs)) of the top 300 target genes of motifs Esrrb/Esrra, Esrrb/Essra, and ESRRA/ESR2 in mouse, rat, and human, respectively. The mean value per age (or age group) across genes is indicated by the black (reference) line. Gene expression time course lines were colored by the distance from the reference line: red- close to the reference line, blue- far from the reference line. fh Activity of motifs associated with TFs Esrrb/Esrra, Esrrb/Essra and ESRRA/ESR2 in mouse, rat, and human, respectively, predicted by ISMARA. *, ** and *** denote a significant difference based on two-sided Student’s t-test between the youngest age/age group and all other ages/age groups with p-value < 0.05, p-value < 0.01 and p-value < 0.001, respectively; “n.s.” not significant (p-value ≥ 0.05). ik The 10 most enriched GO terms for the top 300 target genes of the TFs, i.e., genes depicted in (ce). GO analysis was performed in DAVID. Red dashed lines indicate the significance threshold (p-value < 0.01). The numbers next to the bars denote how many genes were attributed to an enriched GO term.
Fig. 7
Fig. 7. Validation of predictions for the ISMARA-inferred activity of transcription factors (TFs) during muscle aging.
a Representative western blot analysis of the abundance of TFs ERRα, YY1, and PPARα in the gastrocnemius muscle (tissue lysate) of 8 and 28-months-old mice, respectively. b Quantification of western blots showing the relative abundance of TFs ERRα, YY1, and PPARα normalized to the nuclear protein histone H3, respectively. *Denotes a significant difference based on two-sided Mann–Whitney U test between 8 and 28 months-old mice with p-value < 0.05. c Representative images of tibialis anterior cross sections of 8 and 28-months-old mice with magnification stained for ERRα (red), Laminin α2 (white), and DAPI (blue). d Quantification of the percentage of ERRα-positive nuclei in tibialis anterior fibers of 8 and 28-months-old mice, respectively. ***Denotes a significant difference based on two-sided Student’s t-test between 8 and 28-months-old mice with p-value < 0.001. All values were visualized as mean ± standard error of the mean (SE).

Similar articles

Cited by

References

    1. Wolfe RR. The underappreciated role of muscle in health and disease. Am. J. Clin. Nutr. 2006;84:475–482. doi: 10.1093/ajcn/84.3.475. - DOI - PubMed
    1. Glass DJ. Skeletal muscle hypertrophy and atrophy signaling pathways. Int. J. Biochem. Cell Biol. 2005;37:1974–1984. doi: 10.1016/j.biocel.2005.04.018. - DOI - PubMed
    1. Schiaffino S, Reggiani C. Fiber types in mammalian skeletal muscles. Physiol. Rev. 2011;91:1447–1531. doi: 10.1152/physrev.00031.2010. - DOI - PubMed
    1. Demontis F, Piccirillo R, Goldberg AL, Perrimon N. Mechanisms of skeletal muscle aging: insights from Drosophila and mammalian models. Dis. Model. Mech. 2013;6:1339–1352. doi: 10.1242/dmm.012559. - DOI - PMC - PubMed
    1. Kim TN, Choi KM. Sarcopenia: definition, epidemiology, and pathophysiology. J. Bone Metab. 2013;20:1. doi: 10.11005/jbm.2013.20.1.1. - DOI - PMC - PubMed

Publication types

MeSH terms