. 2021 Aug 2;23(8):1360-1370.
doi: 10.1093/neuonc/noab034.

Ultra high-risk PFA ependymoma is characterized by loss of chromosome 6q

Affiliations

Ultra high-risk PFA ependymoma is characterized by loss of chromosome 6q

Lorena V Baroni et al. Neuro Oncol. .

Abstract

Background: Within PF-EPN-A, 1q gain is a marker of poor prognosis, however, it is unclear if within PF-EPN-A additional cytogenetic events exist which can refine risk stratification.

Methods: Five independent non-overlapping cohorts of PF-EPN-A were analyzed applying genome-wide methylation arrays for chromosomal and clinical variables predictive of survival.

Results: Across all cohorts, 663 PF-EPN-A were identified. The most common broad copy number event was 1q gain (18.9%), followed by 6q loss (8.6%), 9p gain (6.5%), and 22q loss (6.8%). Within 1q gain tumors, there was significant enrichment for 6q loss (17.7%), 10q loss (16.9%), and 16q loss (15.3%). The 5-year progression-free survival (PFS) was strikingly worse in those patients with 6q loss, with a 5-year PFS of 50% (95% CI 45%-55%) for balanced tumors, compared with 32% (95% CI 24%-44%) for 1q gain only, 7.3% (95% CI 2.0%-27%) for 6q loss only and 0 for both 1q gain and 6q loss (P = 1.65 × 10⁻¹³). After accounting for treatment, 6q loss remained the most significant independent predictor of survival in PF-EPN-A but is not in PF-EPN-B. Distant relapses were more common in 1q gain irrespective of 6q loss. RNA sequencing comparing 6q loss to 6q balanced PF-EPN-A suggests that 6q loss forms a biologically distinct group.

Conclusions: We have identified an ultra high-risk PF-EPN-A ependymoma subgroup, which can be reliably ascertained using cytogenetic markers in routine clinical use. A change in treatment paradigm is urgently needed for this particular subset of PF-EPN-A where novel therapies should be prioritized for upfront therapy.

Keywords: 1q gain; 6q loss; PFA; PFB; ependymoma; posterior fossa; subgrouping.


Figures

Fig. 1
Fig. 1
Clinical and cytogenetic landscape of 1q gain PF-EPN-A. Kaplan-Meier progression-free survival analysis of 1q status across (A) all PF-EPN-A and (B) only completely resected and radiated PF-EPN-A. Copy number heatmaps comparing (C) 1q balanced PF-EPN-A and (D) 1q gain PF-EPN-A where blue indicates loss, and red indicates gain. P values determined using the log-rank test, and shaded areas around each curve represent 95% confidence intervals.
Fig. 2
Fig. 2
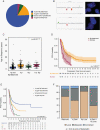
Clinical features of 6q loss ependymoma. (A) Percentage distribution of 1q and 6q status across all PF-EPN-A. (B) Representative copy number profile and corresponding FISH of two tumors showing correlation between the two methods. Aqua—probe to 6q; Red 17p and Green 17q. (C) Age distribution stratified by 1q and 6q status across all PF-EPN-A. Post-hoc comparison using Tukey contrast for age—All bal vs 1q+: P < 1 × 10⁻⁵, All bal vs 6q−: P = 1.5 × 10⁻⁵, All bal vs 1q+6q−: P < 1 × 10⁻⁵, 1q+ vs 6q−: P = 1, 1q+ vs 1q+6q−: P = .76, 6q− vs 1q+6q−: P = .68. Kaplan-Meier survival analysis stratified by 1q and 6q status across (D) 1q gain PF-EPN-A only, (E) all PF-EPN-A. P values determined using the log-rank test. (F) Pattern of relapse stratified by 1q and 6q status with the P value determined comparing local relapse to any distant relapse.
Fig. 3
Fig. 3
6q loss as a distinct group. (A) PCA plot of differentially expressed genes (Padj < .05) where 6q loss and 6q balanced form separate clusters. Red represents 6q balanced while blue indicates 6q loss. (B) Unsupervised clustering of genes restricted to chromosome 6q. The expression count of the top 25 downregulated genes on chromosome 6q was normalized, scaled, and clustered using Euclidean distance and average linkage metrics. Red denotes upregulation, whereas green represents downregulation. (C) Gene set enrichment results comparing the top significantly enriched pathways and biological processes (Padj < .01) between 6q loss and 6q balanced where red indicates enriched in 6q balanced and blue shows enriched in 6q loss.

References

    1. Khatua S, Ramaswamy V, Bouffet E. Current therapy and the evolving molecular landscape of paediatric ependymoma. Eur J Cancer. 2017;70:34–41. - PubMed
    1. Mack SC, Taylor MD. Put away your microscopes: the ependymoma molecular era has begun. Curr Opin Oncol. 2017;29(6):443–447. - PMC - PubMed
    1. Pajtler KW, Mack SC, Ramaswamy V, et al. . The current consensus on the clinical management of intracranial ependymoma and its distinct molecular variants. Acta Neuropathol. 2017;133(1):5–12. - PMC - PubMed
    1. Cavalli FMG, Hübner JM, Sharma T, et al. . Heterogeneity within the PF-EPN-B ependymoma subgroup. Acta Neuropathol. 2018;136(2):227–237. - PMC - PubMed
    1. Witt H, Mack SC, Ryzhova M, et al. . Delineation of two clinically and molecularly distinct subgroups of posterior fossa ependymoma. Cancer Cell. 2011;20(2):143–157. - PMC - PubMed

Publication types