. 2021 Apr;239(4):1203-1221.
doi: 10.1007/s00221-021-06037-4. Epub 2021 Feb 12.

Perception of body shape and size without touch or proprioception: evidence from individuals with congenital and acquired neuropathy

Affiliations

Perception of body shape and size without touch or proprioception: evidence from individuals with congenital and acquired neuropathy

R Christopher Miall et al. Exp Brain Res. 2021 Apr.

Abstract

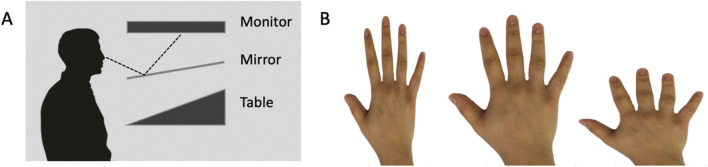
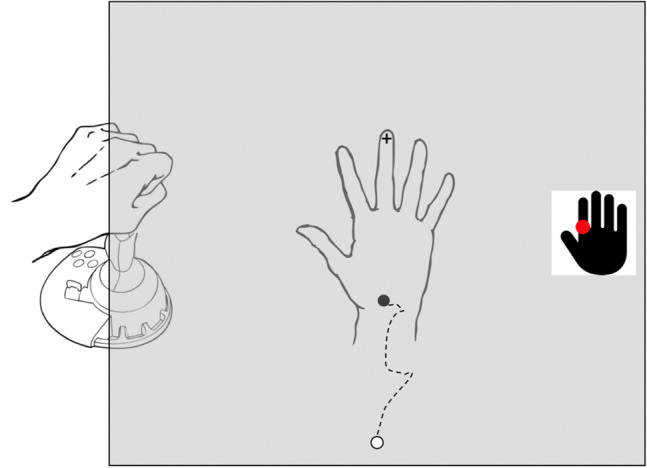
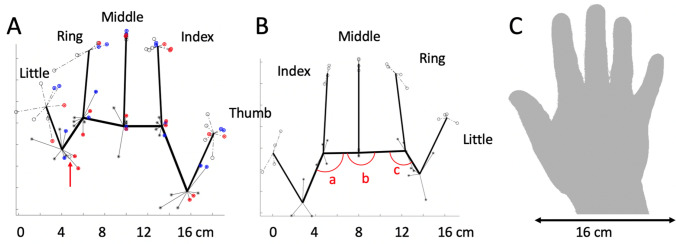
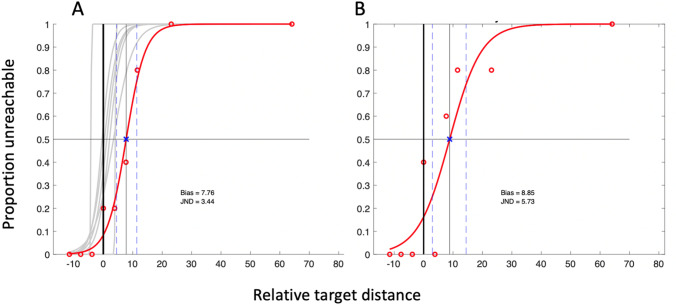
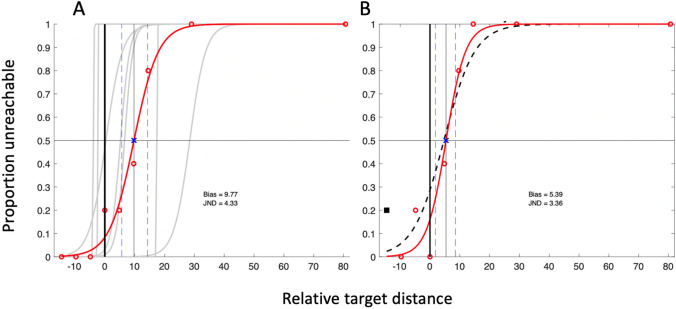
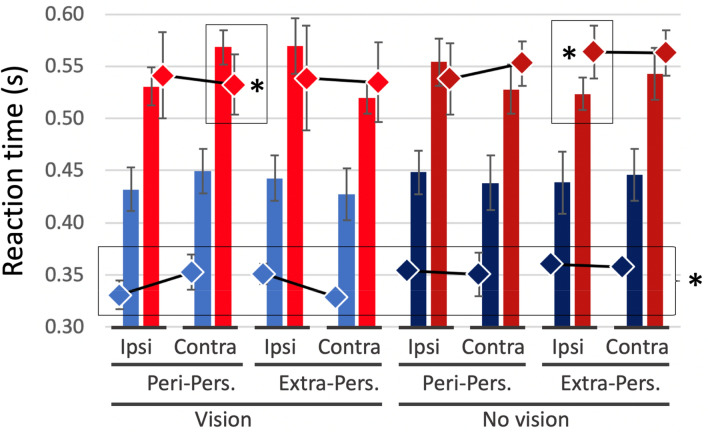
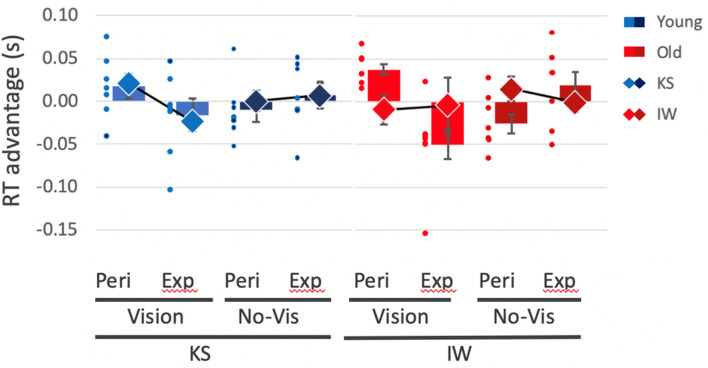
The degree to which mental representations of the body can be established and maintained without somatosensory input remains unclear. We contrast two "deafferented" adults, one who acquired large fibre sensory loss as an adult (IW) and another who was born without somatosensation (KS). We compared their responses to those of matched controls in three perceptual tasks: first accuracy of their mental image of their hands (assessed by testing recognition of correct hand length/width ratio in distorted photographs and by locating landmarks on the unseen hand); then accuracy of arm length judgements (assessed by judgement of reaching distance), and finally, we tested for an attentional bias towards peri-personal space (assessed by reaction times to visual target presentation). We hypothesised that IW would demonstrate responses consistent with him accessing conscious knowledge, whereas KS might show evidence of responses dependent on non-conscious mechanisms. In the first two experiments, both participants were able to give consistent responses about hand shape and arm length, but IW displayed a better awareness of hand shape than KS (and controls). KS demonstrated poorer spatial accuracy in reporting hand landmarks than both IW and controls, and appears to have less awareness of her hands. Reach distance was overestimated by both IW and KS, as it was for controls; the precision of their judgements was slightly lower than that of the controls. In the attentional task, IW showed no reaction time differences across conditions in the visual detection task, unlike controls, suggesting that he has no peri-personal bias of attention. In contrast, KS did show target location-dependent modulation of reaction times, when her hands were visible. We suggest that both IW and KS can access a conscious body image, although its accuracy may reflect their different experience of hand action. Acquired sensory loss has deprived IW of any subconscious body awareness, but the congenital absence of somatosensation may have led to its partial replacement by a form of visual proprioception in KS.

Keywords: Body representation; Deafferentation; Sensory neuropathy; Somatosensation.


Conflict of interest statement

The authors declare that they have no conflicts of interest.

Figures

Fig. 1
Fig. 1
The set-up for Experiment 1(a). Participants viewed 15 images of their own hand, presented in a numbered 3 × 5 grid, with each image distorted vertically or horizontally by up to ± 35% (as shown here with left: 35% reduction of width, middle: no distortion, and right: 35% reduction of length); the participant verbally reported which image was closest in shape to their own unseen hand
Fig. 2
Fig. 2
Mean length/width ratios a for the young (blue bar) and older (red bar) control groups (n = 7, mean + 1SEM) and for KS (blue diamonds) and IW (red diamonds). Panel B shows the within-participant standard deviation across 8 trials (n = 7, mean + 1 SEM). The small blue and red dots are the individual data for the younger and older controls, respectively; other conventions as in panel A
Fig. 3
Fig. 3
A schematic of the hand configuration task, Experiment 1b. Participants rested their test hand (in this case the right hand) on a sloped surface beneath an occluding mirror (see Fig. 1a), with the middle finger touching a small raised bump ( +). On each trial, an icon appeared at the right side of the screen with a target location marked (red dot). Control participants then used their other hand to move a cursor (black dot) that appeared at the bottom of the screen, to the perceived landmark on their unseen hand and, when ready, pressed the joystick trigger button. IW and KS controlled the cursor by verbally instructing the experimenter, who manipulated the joystick on their behalf
Fig. 4
Fig. 4
Estimated digit lengths a and hand width b as percentages of the actual. a: Vertical bars represent the mean distance (+ 1 SEM for the younger and older control groups, each n = 7) between the estimated position of the proximal knuckle and the fingertip, for each of the five digits; blue bars are for the younger control group, red for the older group. The small blue and red dots are the individual data for the younger and older controls, respectively. The large diamonds are means for KS and IW, averaged over four sessions. b: Horizontal bars represent the % distance between the estimated proximal knuckle positions of the index and little fingers. Symbols as in panel A
Fig. 5
Fig. 5
KS’s reported hand maps. a: Left hand and b: right hand. The thick black lines join the mean estimated position of the proximal knuckles, and the tip of each digit, for her left (dominant) and right (non-dominant) hands. The data points are the reported positions across multiple sessions, each linked to the spatial mean for that landmark. For the left hand, data were collected over four sessions. In one session, the hand was held on the lap (red data); this session produced the only outlier (a location reported > 2 cm from the cluster mean), which was thus discounted. This red datum is shown unlinked from the cluster mean for the proximal knuckle of her ring finger. In another session, KS viewed her hand in situ, between each trial, while each landmark position was reported when view of the hand was blocked (blue data). Note the high lateral accuracy for the middle fingertip which was held at a constant midline location on the table. c: KS’s right hand, at a reduced scale compared to panel B. In all panels, the horizontal and vertical scales are equal
Fig. 6
Fig. 6
IW’s hand maps. Format is as in Fig. 5. There is one outlying data point (red arrow, panel A), where one location for the fingertip of the left little finger was reported near to the location of the proximal knuckle; this datum is shown unlinked from the fingertip cluster mean and was excluded from the mean. The red arcs (panel B, labelled a, b, c) represent the knuckle angles reported in the main text
Fig. 7
Fig. 7
The individual reach-estimate psychometric fits of the older control group (grey curves) and IW (red curve and data points) for the dominant arm a and, for IW only, the non-dominant arm b. The horizontal axis is target distance relative to actual reach distance (thick black vertical line), presented as percentage of arm length. The thin black vertical line and blue x mark IW’s bias (50:50 point); the bias points for the controls not shown. The two blue dashed lines surrounding IW’s bias point are the 25 and 75% points of the curve; the interval between these is his JND
Fig. 8
Fig. 8
The psychometric fits for the younger control group and for KS, in the same format as in Fig. 7. In panel B, the dashed black curve is the initial logistic fit; the left-most data point (black square) was identified as an outlier and removed before the final fit (red curve) was achieved
Fig. 9
Fig. 9
Violin plots for the control group’s distribution of reach estimation bias a and JND b; the small white crosses are the group medians; horizontal lines are the group means. The black boxes are the bias and JND estimates for the dominant arm for IW and KS (against the old and young controls, respectively); the black circles are IW and KS’s non-dominant arm estimates. The data labelled UG is from a larger group of undergraduates
Fig. 10
Fig. 10
Visual attention task. The participant rested one hand on a table beneath an occluding mirror that reflected a display screen, such that targets were in the plane of the hand. Through the selective application of a sidelight, the hand was either visible a or not visible b through a black window. The outline of the hand shown in B is for display only and neither the hand nor the arm was visible in this condition. In each trial, after participants fixated on a central cross (see a: top panel), two placeholders would appear: placeholders were located either far a or near the hand b. One would be highlighted (red) as an attentional cue (middle panels), and then, the target would appear (black square, front panels) congruent a or incongruent to the cue b. Vocal reaction times were detected by microphone
Fig. 11
Fig. 11
Mean reaction times for the young (blue/dark blue bars) and older control groups (red/dark red bars) for detection of targets in valid-cue trials; error bars are SEM across the group. The hand was visible (vision–light colours) or not (No Vision–dark colours); targets appeared in personal (Peri-Pers) or extra-personal space (Extra-Pers), ipsilateral (Ipsi), or contralateral (Contra) to the hand. The diamonds are the means across daily sessions for KS (blue/dark blue) and IW (red/dark red), with SD error bars across sessions. KS was faster than her controls in all conditions (black outline and star), IW only differed in 2/8 valid trial conditions (black outlines and stars)
Fig. 12
Fig. 12
Reaction time differences between contralateral and ipsilateral target presentations, for valid trials only. Positive values represent an RT advantage for targets closer to the hand; negative values represent an advantage for targets contralateral to the hand. Blue and red bars are the group means (with ± 1 SEM) for the younger and older controls, respectively; small dots are the individuals’ data (n = 7 per group). Large diamonds are the means for KS and IW, averaged across session, ± 1 SD. Controls (and KS) show a reversal of RT advantage between peri-personal space (Peri) and extra-personal space (Exp) in vision (light blue/red) vs no-vision conditions (dark blue/red); IW showed no differences

References

    1. Balslev D, Cole J, Miall RC. Proprioception contributes to the sense of agency during visual observation of hand movements: evidence from temporal judgments of action. J Cogn Neurosci. 2007;19:1535–1541. doi: 10.1162/jocn.2007.19.9.1535. - DOI - PMC - PubMed
    1. Balslev D, Miall RC, Cole J. Proprioceptive deafferentation slows down the processing of visual hand feedback. J Vis. 2007;7(12):1–7. doi: 10.1167/7.5.12. - DOI - PMC - PubMed
    1. Bootsma RJ, Bakker FC, van Snippenberg FEJ, Tdlohreg CW. The effects of anxiety on perceiving the reachability of passing objects. Ecol Psychol. 1992;4:1–16. doi: 10.1080/10407413.1992.10530790. - DOI
    1. Brown LE, Marlin MC, Morrow S. On the contributions of vision and proprioception to the representation of hand-near targets. J Neurophysiol. 2015;113:409–419. doi: 10.1152/jn.00005.2014. - DOI - PMC - PubMed
    1. Cardinali L, Brozzoli C, Luauté J, et al. Proprioception is necessary for body schema plasticity: evidence from a deafferented patient. Front Hum Neurosci. 2016;10:441–448. doi: 10.3389/fnhum.2016.00272. - DOI - PMC - PubMed

LinkOut - more resources