

Quantitation of cancer treatment response by 2-[18F]FDG PET/CT: multi-center assessment of measurement variability using AUTO-PERCIST™
- PMID: 33580383
- PMCID: PMC7881074
- DOI: 10.1186/s13550-021-00754-1
Quantitation of cancer treatment response by 2-[18F]FDG PET/CT: multi-center assessment of measurement variability using AUTO-PERCIST™
Abstract
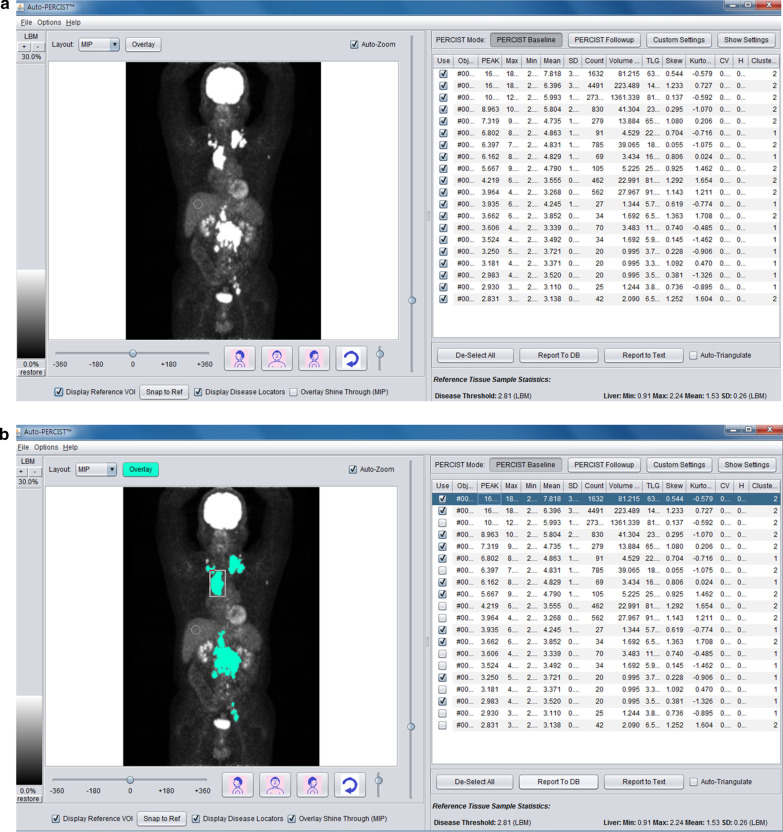
Background: The aim of this study was to assess the reader variability in quantitatively assessing pre- and post-treatment 2-deoxy-2-[18F]fluoro-D-glucose positron emission tomography/computed tomography ([18F]FDG PET/CT) scans in a defined set of images of cancer patients using the same semi-automated analytical software (Auto-PERCIST™), which identifies tumor peak standard uptake value corrected for lean body mass (SULpeak) to determine [18F]FDG PET quantitative parameters.
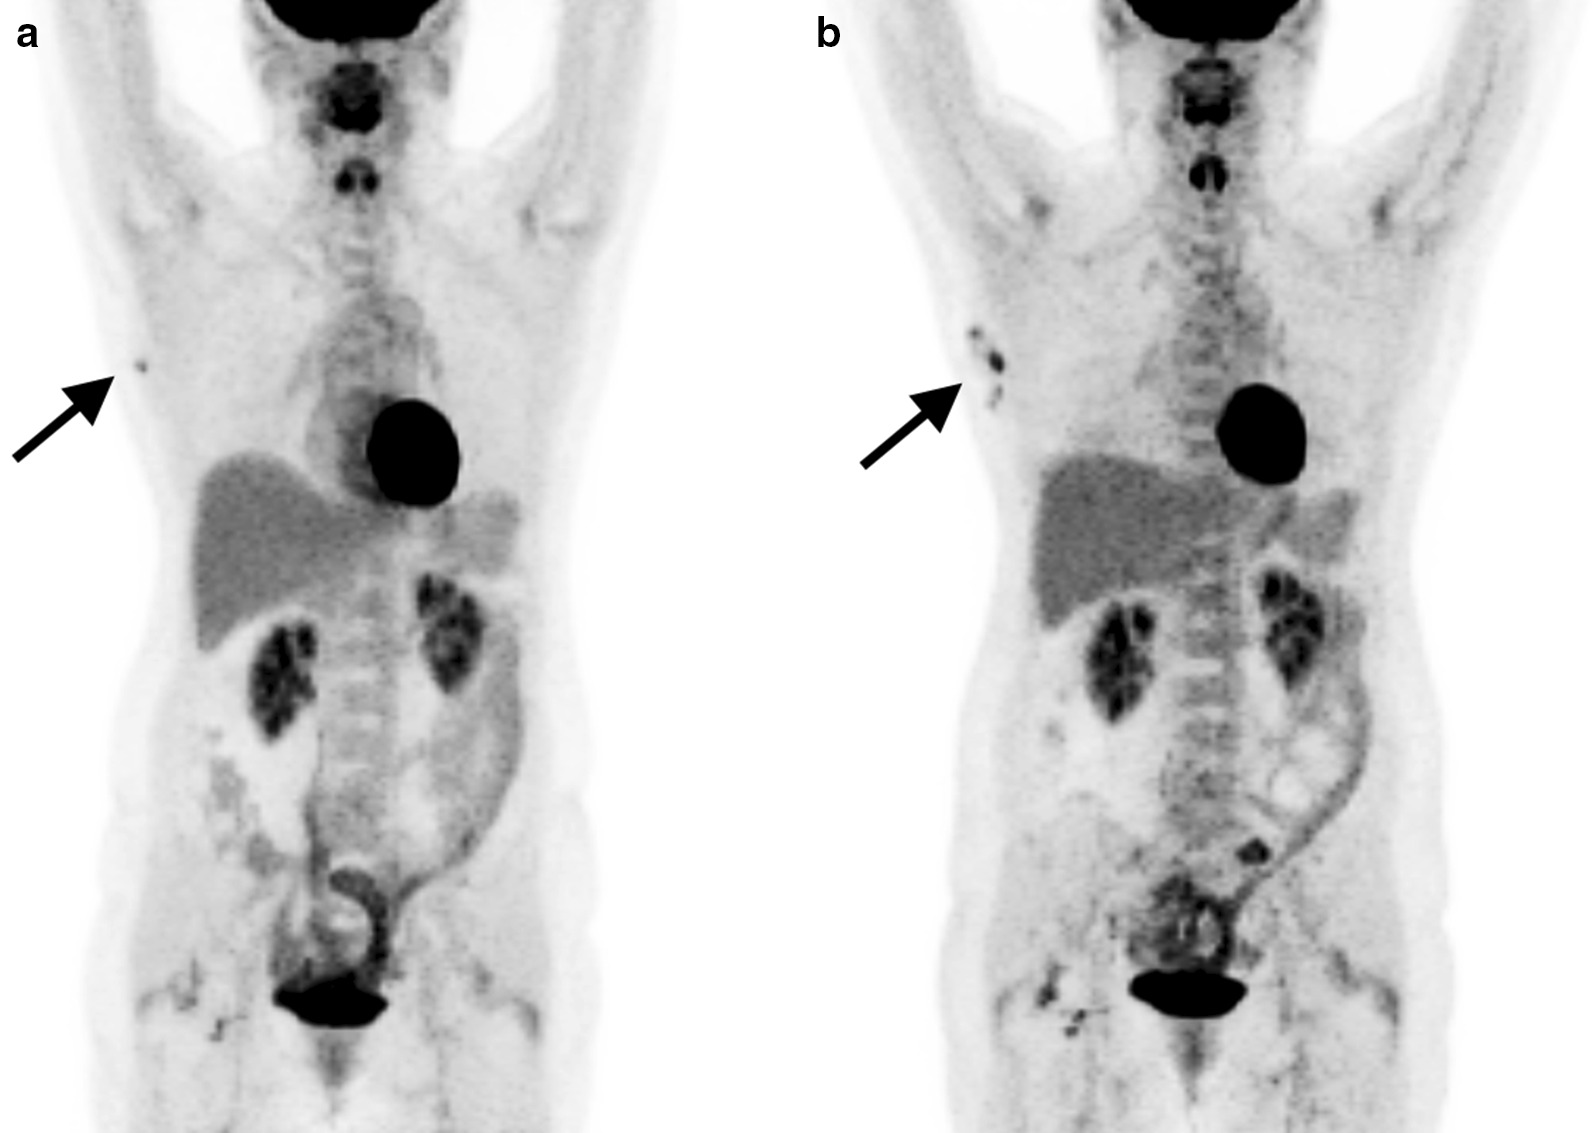
Methods: Paired pre- and post-treatment [18F]FDG PET/CT images from 30 oncologic patients and Auto-PERCIST™ semi-automated software were distributed to 13 readers across US and international sites. One reader was aware of the relevant medical history of the patients (readreference), whereas the 12 other readers were blinded to history but had access to the correlative images. Auto-PERCIST™ was set up to first automatically identify the liver and compute the threshold for tumor measurability (1.5 × liver mean) + (2 × liver standard deviation [SD]) and then detect all sites with SULpeak greater than the threshold. Next, the readers selected sites they believed to represent tumor lesions. The main performance metric assessed was the percent change in the SULpeak (%ΔSULpeak) of the hottest tumor identified on the baseline and follow-up images.
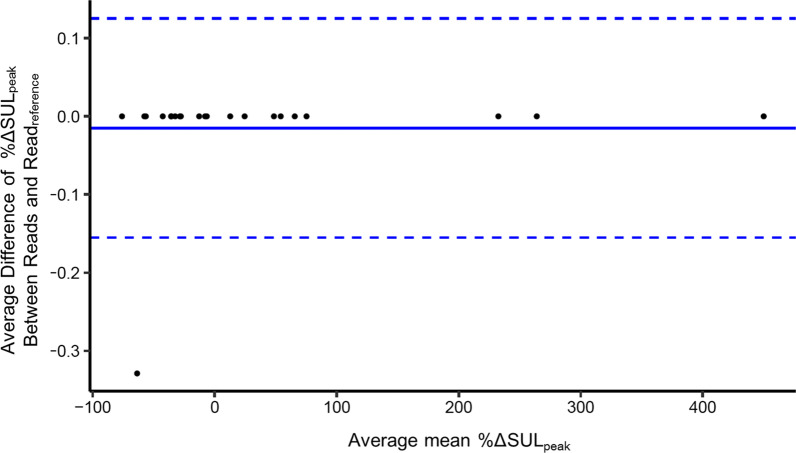
Results: The intra-class correlation coefficient (ICC) for the %ΔSULpeak of the hottest tumor was 0.87 (95%CI: [0.78, 0.92]) when all reads were included (n = 297). Including only the measurements that selected the same target tumor as the readreference (n = 224), the ICC for %ΔSULpeak was 1.00 (95%CI: [1.00, 1.00]). The Krippendorff alpha coefficient for response (complete or partial metabolic response, versus stable or progressive metabolic disease on PET Response Criteria in Solid Tumors 1.0) was 0.91 for all reads (n = 380) and 1.00 including for reads with the same target tumor selection (n = 270).
Conclusion: Quantitative tumor [18F]FDG SULpeak changes measured across multiple global sites and readers utilizing Auto-PERCIST™ show very high correlation. Harmonization of methods to single software, Auto-PERCIST™, resulted in virtually identical extraction of quantitative tumor response data from [18F]FDG PET images when the readers select the same target tumor.
Keywords: Quantification; Response assessment; [18F]FDG PET/CT.
Conflict of interest statement
No relevant conflicts of interest were identified except two of the authors, JL and RW, who are co-inventors on a patent underlying the Auto-PERCIST™ software.
Figures

References
-
- Gallamini A, Barrington SF, Biggi A, et al. The predictive role of interim positron emission tomography for Hodgkin lymphoma treatment outcome is confirmed using the interpretation criteria of the Deauville five-point scale. Haematologica. 2014;99:1107–1113. doi: 10.3324/haematol.2013.103218. - DOI - PMC - PubMed
Grants and funding
LinkOut - more resources
Full Text Sources
Other Literature Sources
