. 2021 Jul;86(1):97-114.
doi: 10.1002/mrm.28679. Epub 2021 Feb 13.

Magnetization-prepared GRASP MRI for rapid 3D T1 mapping and fat/water-separated T1 mapping

Affiliations

Magnetization-prepared GRASP MRI for rapid 3D T1 mapping and fat/water-separated T1 mapping

Li Feng et al. Magn Reson Med. 2021 Jul.

Abstract

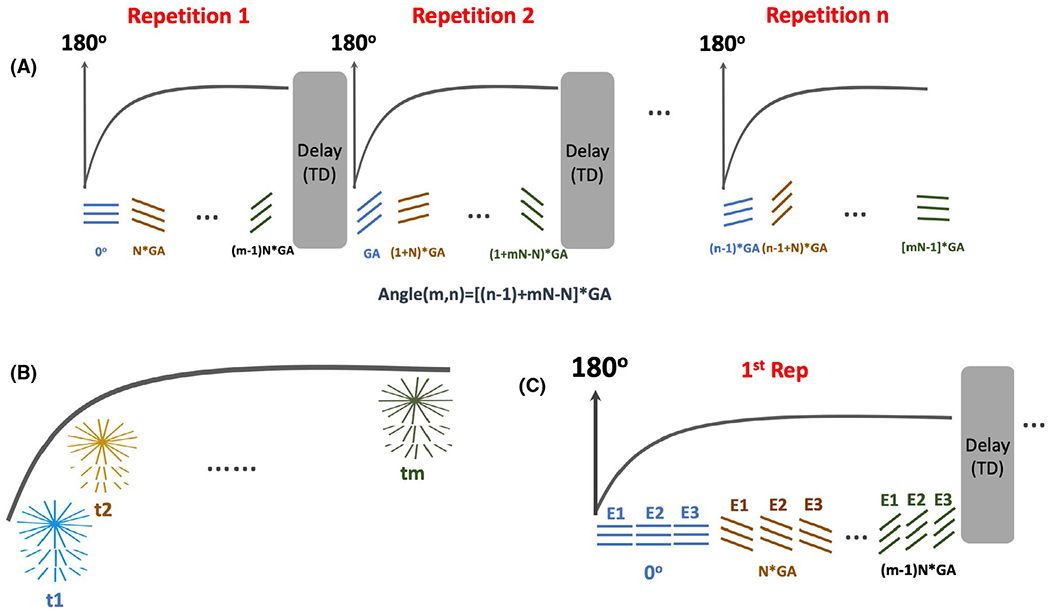
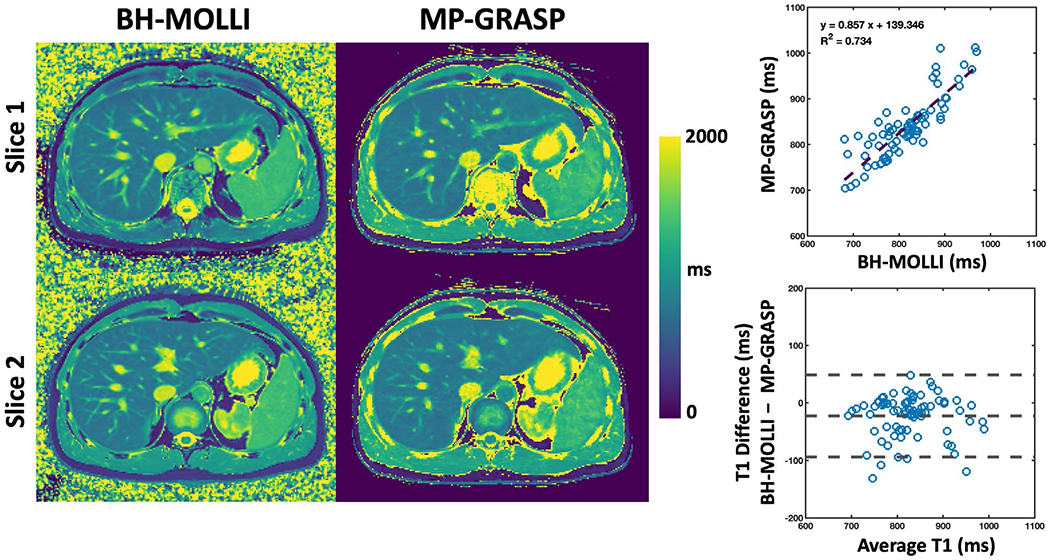
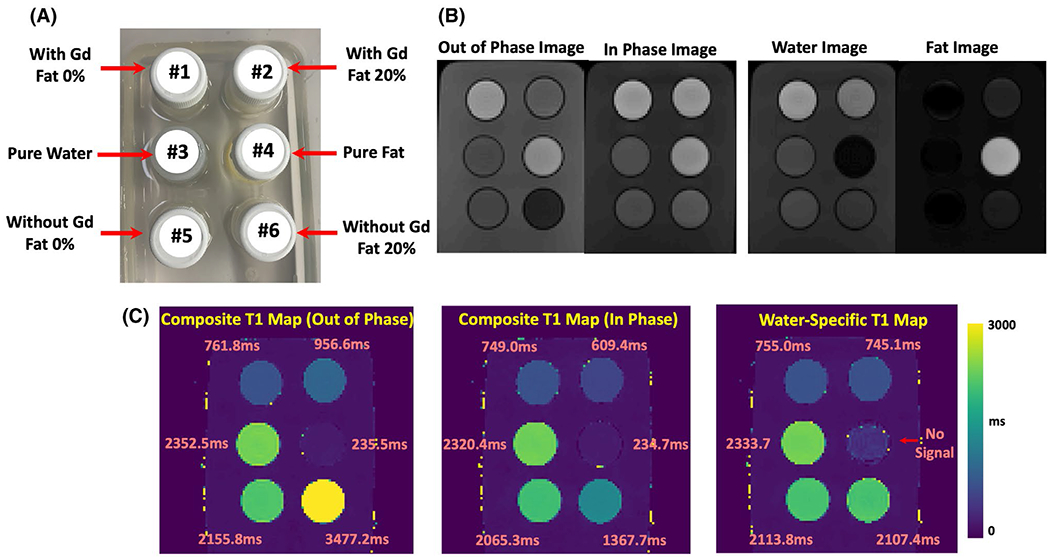
Purpose: This study aimed to (i) develop Magnetization-Prepared Golden-angle RAdial Sparse Parallel (MP-GRASP) MRI using a stack-of-stars trajectory for rapid free-breathing T1 mapping and (ii) extend MP-GRASP to multi-echo acquisition (MP-Dixon-GRASP) for fat/water-separated (water-specific) T1 mapping.

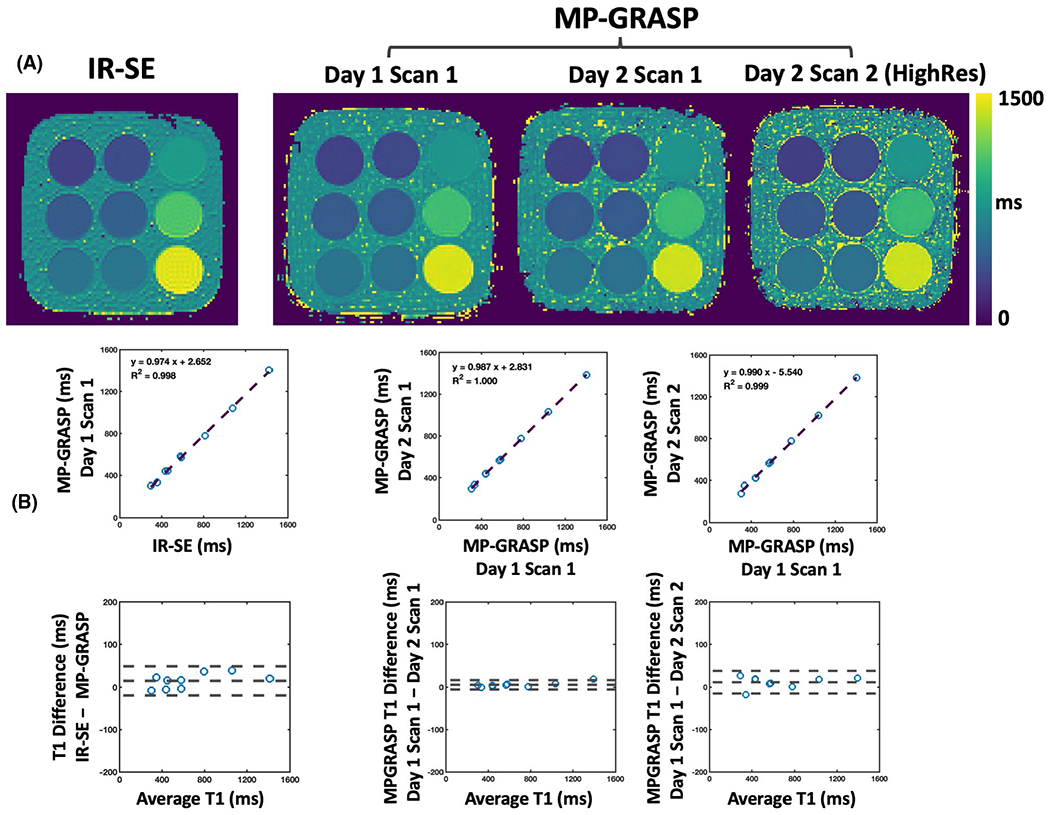
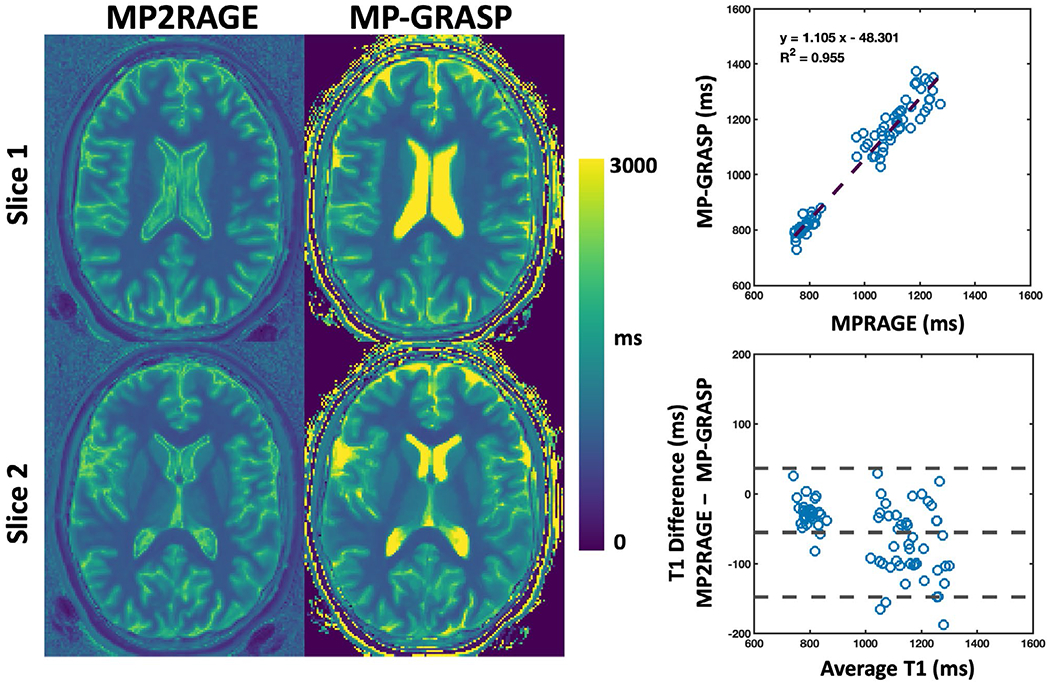
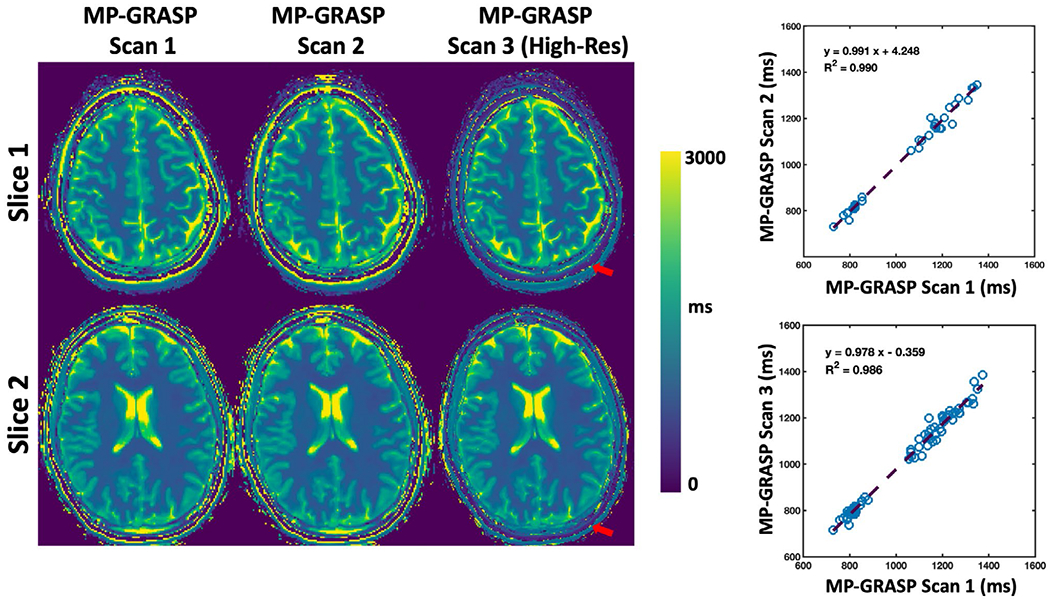
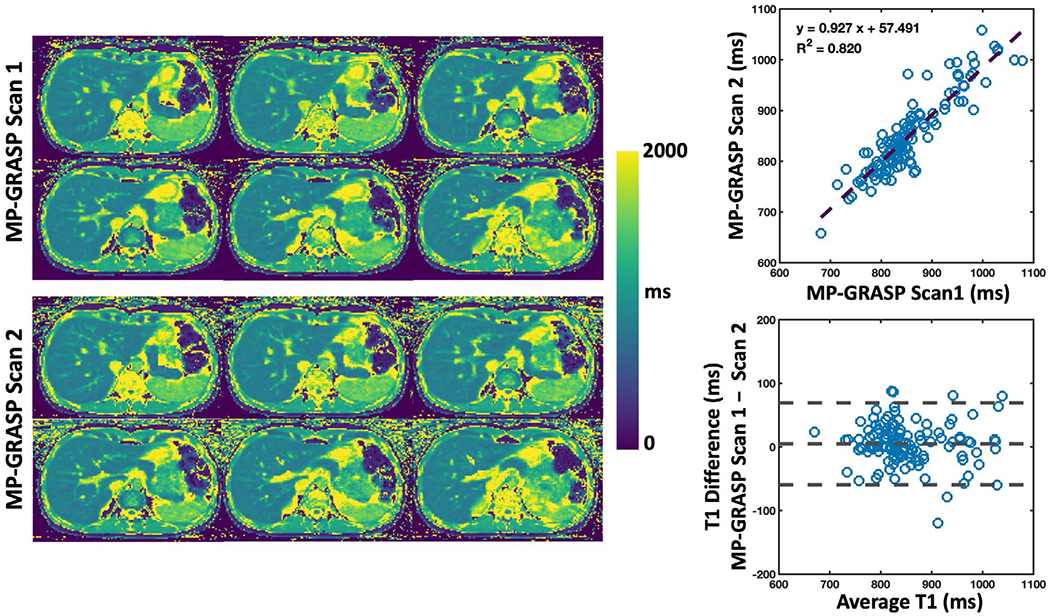
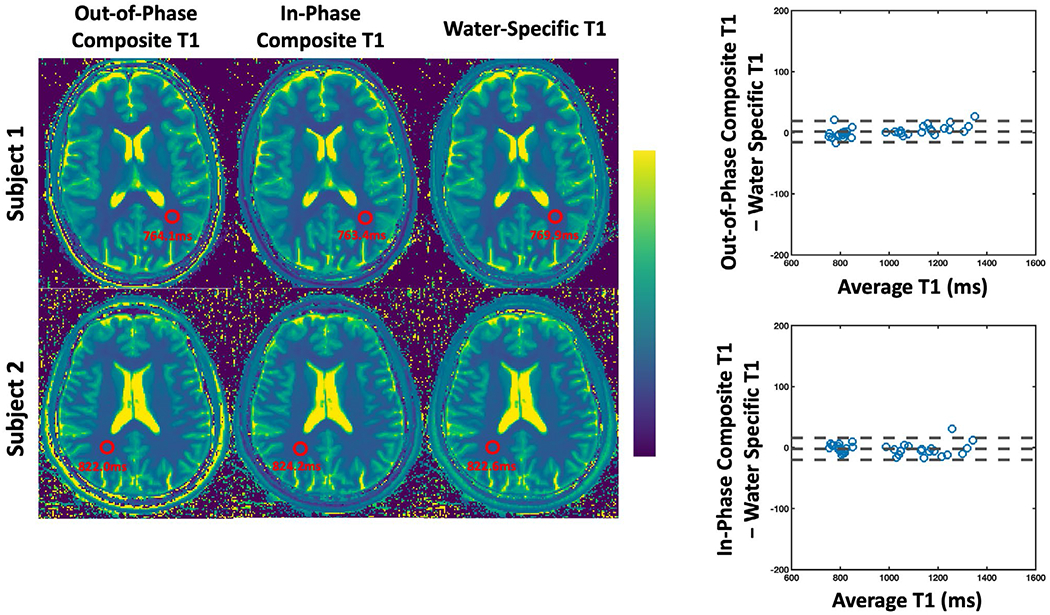
Methods: An adiabatic non-selective 180° inversion-recovery pulse was added to a gradient-echo-based golden-angle stack-of-stars sequence for magnetization-prepared 3D single-echo or 3D multi-echo acquisition. In combination with subspace-based GRASP-Pro reconstruction, the sequence allows for standard T1 mapping (MP-GRASP) or fat/water-separated T1 mapping (MP-Dixon-GRASP), respectively. The accuracy of T1 mapping using MP-GRASP was evaluated in a phantom and volunteers (brain and liver) against clinically accepted reference methods. The repeatability of T1 estimation was also assessed in the phantom and volunteers. The performance of MP-Dixon-GRASP for water-specific T1 mapping was evaluated in a fat/water phantom and volunteers (brain and liver).

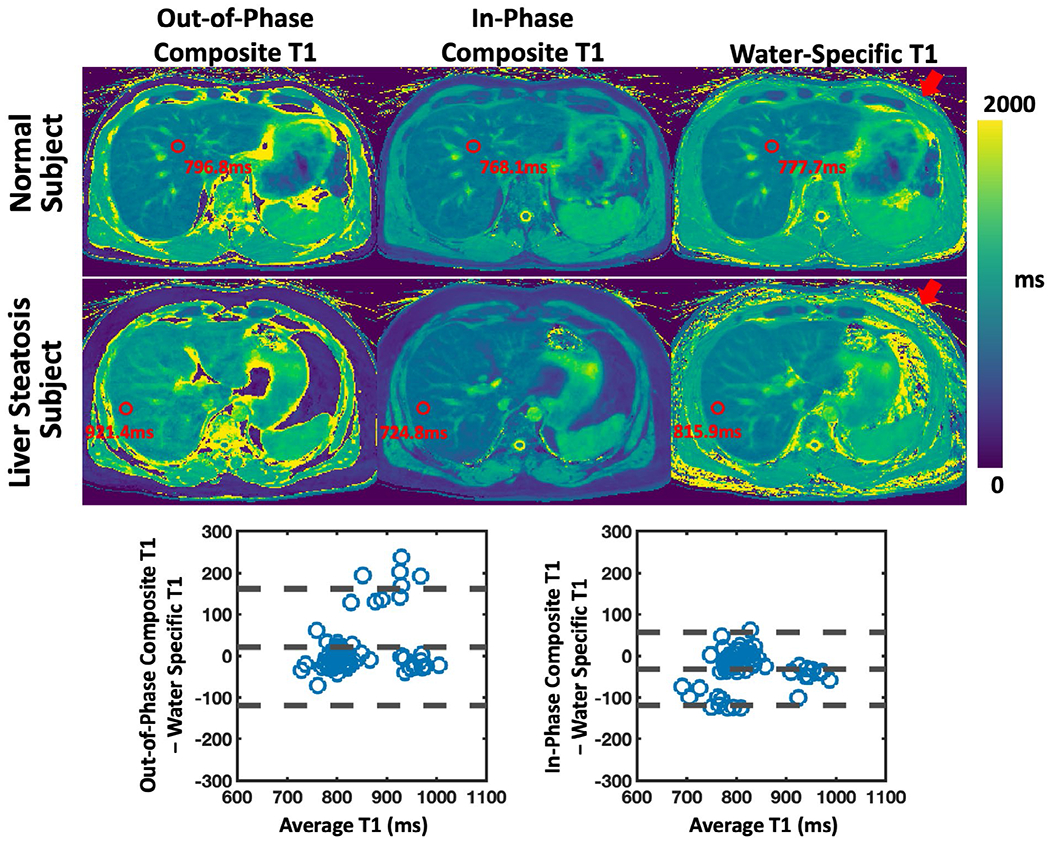
Results: ROI-based mean T1 values are correlated between the references and MP-GRASP in the phantom (R2 = 1.0), brain (R2 = 0.96), and liver (R2 = 0.73). MP-GRASP achieved good repeatability of T1 estimation in the phantom (R2 = 1.0), brain (R2 = 0.99), and liver (R2 = 0.82). Water-specific T1 is different from in-phase and out-of-phase composite T1 (composite T1 when fat and water signal are mixed in phase or out of phase) both in the phantom and volunteers.

Conclusion: This work demonstrated the initial performance of MP-GRASP and MP-Dixon-GRASP MRI for rapid 3D T1 mapping and 3D fat/water-separated T1 mapping in the brain (without motion) and in the liver (during free breathing). With fat/water-separated T1 estimation, MP-Dixon-GRASP could be potentially useful for imaging patients with fatty-liver diseases.

Keywords: MP-Dixon-GRASP; MP-GRASP; T1 mapping; fat/water separation; free-breathing; golden-angle radial.


Conflict of interest statement

CONFLICT OF INTEREST

Li Feng and Kai Tobias Block are named co-inventors of a patent (Patent number 9921285) on the GRASP imaging technique. Kai Tobias Block and Thomas Benkert are employees of Siemens Healthcare GmbH, Germany.

Figures

FIGURE 1
FIGURE 1
IR-prepared stack-of-stars acquisitions. Imaging sequence was developed based upon a stack-of-stars 3D GRE sequence (RAVE). A, An adiabatic non-selective 180° IR pulse is periodically played-out to achieve magnetization preparation. After each IR pulse, a series of radial stacks rotated by a pre-defined rotation scheme (Equation 1) are acquired until the magnetization reaches steady state. B, After synchronization of all the acquired repetitions, a composite IR-prepared dynamic image series can be generated where k-space at each time point is formed by N consecutive golden-angle rotations to ensure uniform coverage. C, The IR-prepared stack-of-stars sequence can also be performed for multi-echo acquisitions, where rotating angle for different echoes are the same and the number of echoes can be selected by the user
FIGURE 2
FIGURE 2
Comparisons of T1 maps obtained from IR-SE and different MP-GRASP scans in phantom imaging. A, All imaging methods show similar T1 maps in different phantom vials. B, Corresponding linear regression and Bland-Altman plots. T1 values from different phantom tubes are highly correlated between IR-SE and MP-GRASP (R2 = 0.998) and do not show significant bias for T1 estimation. MP-GRASP T1 values obtained at different time points and different spatial resolutions are also highly correlated (R2 = 1.0 between MP-GRASP Day 1 Scan 1 and MP-GRASP Day 2 Scan 1 with the same spatial resolution; R2 = 0.999 between MP-GRASP Day 1 Scan 1 and MP-GRASP Day 2 Scan 2 with different spatial resolutions) without significant bias
FIGURE 3
FIGURE 3
Comparison of brain T1 maps obtained from MP2RAGE and MP-GRASP in one volunteer. The T1 maps are visually comparable except for the CSF and the skull region. The linear regression shows that mean T1 values across all the subjects exhibit a good correlation (R2 = 0.955). The Bland-Altman plot suggests that MP2RAGE yielded lower T1 values compared to those from MP-GRASP
FIGURE 4
FIGURE 4
Comparison of brain T1 maps from MP-GRASP Scan 1 (MP-GRASP protocol 1), MP-GRASP Scan 2 (repeated MP-GRASP protocol 1), and MP-GRASP Scan 3 (MP-GRASP protocol 2, higher spatial resolution). The maps are visually comparable except for the finer structure display in MP-GRASP Scan 3 due to increased spatial resolution. The linear regression plots indicate that the mean T1 values from the selected ROIs obtained from the scan and rescan are high-correlated (R2 = 0.99). These results demonstrated good repeatability of T1 estimation using MP-GRASP even at different spatial resolutions
FIGURE 5
FIGURE 5
Comparison of liver T1 maps from BH-MOLLI and MP-GRASP for two different slices from one volunteer. The T1 maps are visually comparable and the linear regression plot indicates moderate T1 correlation (R2 = 0.734). T1 values estimated from BH-MOLLI are lower compared to those from MP-GRASP based on the Bland-Altman plot
FIGURE 6
FIGURE 6
Comparison of liver T1 maps between MP-GRASP Scan 1 and MP-GRASP Scan 2 in one volunteer. Despite respiratory motion that may be different during the two scans, the resulting T1 maps are comparable as confirmed by the linear regression and Bland-Altman plots
FIGURE 7
FIGURE 7
Phantom evaluation of MP-Dixon-GRASP. A, A picture of the fat/water phantom structure. B, In the out-of-phase image, vials 1 is brighter than vial 2 and vial 5 is brighter than vial 6. Vial 4 (pure oil) is brighter than vial 3 (pure water) in both out-of-phase and in-phase images. C, Comparison of the composite T1 maps with the water-specific T1 map from the phantom. When fat and water are not mixed, vials 1, 3, 4, and 5 have similar T1 values across different T1 maps. Vial 4 (pure oil) does not contain signal in the water-specific T1 map as confirmed in the water image. When fat and water are mixed (vial 2 and vial 6), larger out-of-phase composite T1 and smaller in-phase composite T1 were obtained compared to corresponding vials without fat (vial 1 and vial 5, respectively). The water-specific T1 map indicates that the influence of fat can be removed, and similar underlying T1 values for [vial 1, vial 2] and [vial 5, vial 6] can be obtained despite different fat fractions
FIGURE 8
FIGURE 8
Comparison of out-of-phase and in-phase composite T1 maps with water-specific T1 map generated from MP-Dixon-GRASP in two brain volunteers. No difference was found between out-of-phase composite T1 and water-specific T1 (P > .1) except for the Caudate (P < .05). No difference was found between in-phase composite T1 and water-specific T1 in all the tissue types (P > .1)
FIGURE 9
FIGURE 9
Comparison of out-of-phase and in-phase composite T1 maps with water-specific T1 map generated from MP-Dixon-GRASP in two liver subjects. One subject was confirmed to have liver stenosis. Water-specific T1 is significantly higher than in-phase composite T1 in the liver (P < .001) and is significantly lower than out-of-phase composite T1 in the liver (P < .05). The differences were found to be larger in the subject with liver steatosis compared to others. The red arrows show that the fat signal was removed in the water-specific T1 maps. This finding is consistent with the fat/water phantom results

Similar articles

Cited by

References

    1. Block KT, Uecker M, Frahm J. Undersampled radial MRI with multiple coils. Iterative image reconstruction using a total variation constraint. Magn Reson Med. 2007;57:1086–1098. - PubMed
    1. Adluru G, McGann C, Speier P, Kholmovski EG, Shaaban A, Dibella EVR. Acquisition and reconstruction of undersampled radial data for myocardial perfusion magnetic resonance imaging. J Magn Reson Imaging. 2009;29:466–473. - PMC - PubMed
    1. Feng L, Grimm R, Block KT, et al. Golden-angle radial sparse parallel MRI: combination of compressed sensing, parallel imaging, and golden-angle radial sampling for fast and flexible dynamic volumetric MRI. Magn Reson Med. 2014;72:707–717. - PMC - PubMed
    1. Glover GH, Pauly JM. Projection reconstruction techniques for reduction of motion effects in MRI. Magn Reson Med. 1992;28:275–289. - PubMed
    1. Block KT, Chandarana H, Milla S, et al. Towards routine clinical use of radial stack-of-stars 3D gradient-echo sequences for reducing motion sensitivity. J Korean Soc Magn Reson Med. 2014;18:87.