. 2021 Mar 9;54(3):484-498.e8.
doi: 10.1016/j.immuni.2021.01.004. Epub 2021 Feb 12.

Dectin-1 limits autoimmune neuroinflammation and promotes myeloid cell-astrocyte crosstalk via Card9-independent expression of Oncostatin M

Affiliations

Dectin-1 limits autoimmune neuroinflammation and promotes myeloid cell-astrocyte crosstalk via Card9-independent expression of Oncostatin M

M Elizabeth Deerhake et al. Immunity. .

Abstract

Pathologic roles of innate immunity in neurologic disorders are well described, but their beneficial aspects are less understood. Dectin-1, a C-type lectin receptor (CLR), is largely known to induce inflammation. Here, we report that Dectin-1 limited experimental autoimmune encephalomyelitis (EAE), while its downstream signaling molecule, Card9, promoted the disease. Myeloid cells mediated the pro-resolution function of Dectin-1 in EAE with enhanced gene expression of the neuroprotective molecule, Oncostatin M (Osm), through a Card9-independent pathway, mediated by the transcription factor NFAT. Furthermore, we find that the Osm receptor (OsmR) functioned specifically in astrocytes to reduce EAE severity. Notably, Dectin-1 did not respond to heat-killed Mycobacteria, an adjuvant to induce EAE. Instead, endogenous Dectin-1 ligands, including galectin-9, in the central nervous system (CNS) were involved to limit EAE. Our study reveals a mechanism of beneficial myeloid cell-astrocyte crosstalk regulated by a Dectin-1 pathway and identifies potential therapeutic targets for autoimmune neuroinflammation.

Keywords: C-type lectin receptors; CLRs; Card9; Dectin-1/Clec7a; Gal-9; Galectin-9; MS; OSMR; Oncostatin M; Osm; astrocytes; innate immunity; multiple sclerosis; neuroimmunology.


Conflict of interest statement

Declaration of Interests R.-R.J. is a consultant of Boston Scientific and received a research grant from the company. This activity is not related to the current study. The remaining authors declare no competing interests.

Figures

Figure 1.
Figure 1.. Dectin-1 limits neuroinflammation in EAE.
(A-C) EAE clinical scores (left panels) and AUC (right panels) for statistical analysis. Comparison between WT and Clec7a−/− mice using standard immunization (200 μg hkMtb/mouse) with n=7 mice/group (A) or reduced adjuvant immunization (50 μg hkMtb/mouse) with n=4 WT and n=5 Clec7a−/− mice/group (B). Comparison of WT mice receiving either hot alkali-depleted zymosan (dz) (500μg/mouse)(n=10) or PBS (n=9) i.v. at 1-dpi with standard immunization (C). Data representative of >3 independent experiments (A) or 2 independent experiments each (B, C). (D) Numbers of Th cell subsets in ILN between WT and Clec7a−/− mice at 9-dpi. Data representative of 3 independent experiments. (E, F) Total cell numbers (E) and numbers of indicated cell types (F) in spinal cord at 9-dpi. The main effect of genotype (WT < Clec7a−/−) (**) by 2-factor RM-ANOVA indicated in (F). Data are combined from three independent experiments. One datapoint denotes a result from one mouse (D-F). (G) LFB-PAS staining of lumbar SC in WT and Clec7a−/− mice at EAE 17-dpi. Scale 100 μm. Representative images from 10 mice/group combined from two independent experiments. Please also see Figures S1, 2.
Figure 2.
Figure 2.. Card9 exacerbates EAE and promotes a Th17 response.
(A) EAE clinical scores (left panel) and AUC (right panel) for statistical analysis. Comparison between WT (n=9) and Card9−/− (n=8) mice. Data are combined from two independent experiments. (B) EAE clinical scores from BM chimeras. WT BM cells were transferred to irradiated WT (white) or Card9−/−(gray) recipients. Another group is Card9−/− BM transferred to WT recipients (orange). n=7–13 mice/group, combined from three independent experiments. (C-G) Leukocytes in peripheral lymphoid organs at 9-dpi EAE. Representative flow cytometry plots for intracellular cytokine staining (C) and frequency of Th cell subsets in ILN (D, E). Numbers of indicated cell types in spleen (F, G). One datapoint denotes a result from one mouse. Data are combined from three independent experiments. Please also see Figure S3.
Figure 3.
Figure 3.. Cell type-specific Dectin-1 expression and function.
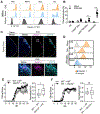
(A) Flow cytometry histograms, indicating Dectin-1 expression in splenic neutrophils (CD11b+Ly6G+), monocytes (CD11b+Ly6C+Ly6G), macrophages (CD11b+F4/80hi), and DCs (CD11b+CD11c+) from naïve and EAE 9-dpi WT mice. (B) Frequency of myeloid cell subsets in total splenocytes in naïve (n=7) and EAE 9-dpi (n=8) mice. Data are combined from 2 independent experiments. (C) Localization of Dectin-1 expressing cells with CD11b counter-staining in the lumbar SC of naïve and EAE 17-dpi mice. Bottom panels are enlarged images of regions indicated with squares in top panels. Scale 100 μm in upper panels and 25 μm in lower panels. (D) Flow cytometry histograms of Dectin-1 expression in microglia (CD11bloCD45loTmem119+), neutrophils (CD11b+Ly6G+), and monocytes (CD11b+Ly6GLy6C+) in SC from naïve and EAE 16-dpi mice. Representative data from two independent experiments. (E, F) EAE scores (left panels) and AUC for statistical analysis (right panels) of irradiation BM chimeras. WT or Clec7a−/− BM cells into irradiated WT recipients (n=9 for both groups) (E). WT BM into WT or Clec7a−/− recipients using (n=13 for both groups) (F). Data are combined from two independent experiments each. Please also see Figure S4.
Figure 4.
Figure 4.. Dectin-1 promotes expression of Oncostatin M (Osm).
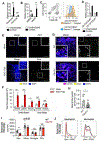
(A, B) Osm mRNA expression in indicated myeloid cell types with ex vivo curdlan (100 μg/ml) stimulation for 3 hrs. Evaluated are flow-cytometry sorted BM monocytes (CD11b+Ly6ChiLy6G) and neutrophils (CD11b+Ly6G+) (A), as well as GM-CSF-derived BMDCs and M-CSF-derived BMDM (B). Post-hoc Sidak test following 2-factor ANOVA indicated in (A, B). Mean ± SEM shown. Data are combined from two independent experiments. (C, D) Analyses of myeloid cells from SC and brain of EAE mice at 30-dpi. Gating of CD11bloCD45lo and CD11bhiCD45hi cells from and evaluation for Dectin-1 expression by flow cytometry (C). Gated cells in (C) were flow cytometry sorted, stimulated with curdlan (100μg/ml) for 3 hr ex vivo, and amounts of Osm mRNA were evaluated by RT-qPCR (D). Samples pooled from 2 mice each. Representative of 2 independent experiments. (E) Representative images from two independent experiments of RNAscope in situ hybridization (ISH) of Osm mRNA in the lumbar SC of WT naïve and EAE 17-dpi mice. Scale bars, 100 μm in main panels, 10 μm in inset. (F) Region-specific quantification of Osm mRNA signal per hpf (sum of integrated density) in lumbar SC regions from WT naïve and EAE 17-dpi mice using n=4 mice/group, analyzed by 2-factor ANOVA of log-transformed data with post-hoc Sidak test shown. Representative of two independent experiments. (G) Representative images from two independent experiments of combined ISH of Osm mRNA and CD11b staining in the ventrolateral white matter of lumbar SC from WT and Clec7a−/− mice at 17-dpi EAE. Scale bars, 100 μm in main panels, 10 μm in inset. (H) Quantification of mean Osm mRNA puncta per CD11b+ cell. One datapoint denotes a result from one mouse. Mean ± SEM. Data from two independent experiments. (I, J) Evaluation of Osm mRNA expression in CNS myeloid cell subsets at 20-dpi EAE by PrimeFlow. Quantification of Osm MFI (I) and representative histograms of Osm expression (J). One datapoint denotes a result from one mouse. Data from two independent experiments. Please also see Figure S4.
Figure 5.
Figure 5.. Defining the Card9-independent Dectin-1 transcriptional program.
(A) Osm mRNA expression in BM neutrophils from WT, Clec7a−/−, and Card9−/− mice. Neutrophils were treated with or without curdlan (100 μg/ml) ex vivo for 3 hrs. Mean ± SEM, n=3 mice/group. Representative of 3 independent experiments. (B-G) RNAseq analyses of BM neutrophils from WT and Card9−/− mice (n=3 mice/group) treated with or without curdlan (100 μg/ml) ex vivo for 3 hrs. Proportions of genes which are up- or down-regulated in a Card9-dependent manner, in WT neutrophils with curdlan stimulation (B). Ratio of gene expression fold-change, comparing WT and Card9−/− (KO) neutrophils, with curdlan stimulation (points indicate individual genes) (C). Gene-concept network based on RNAseq results, showing pathway enrichment analysis (D, F). Heatmaps of selected genes with indicated associated pathways (E, G). Card9-dependent and -independent candidate genes are indicated in (D, E) and (F, G), respectively. (H, I) Plots of adjusted p-values for TF binding site enrichment near Card9-dependent genes (H) or Card9-independent genes (I). NFAT family and NFκB family TFs are indicated in turquoise and orange, respectively. (J) Venn diagram of genes with at least 3 predicted NFκB or NFAT binding sites in OCRs within 100 kb of each gene. (K) Schematic of Dectin-1 signaling with small molecule inhibitors. (L) RT-qPCR evaluation of Osm mRNA in WT BM neutrophils pre-treated with inhibitors at the indicated doses for 1 hr before curdlan stimulation (100 μg/ml) for 3 hrs. Data representative of 2 independent experiments. (M) Schematic of small molecule targets. (N, O) Osm mRNA in WT BM neutrophils stimulated with curdlan (100 μg/ml) for 3hrs after 1 hr pretreatment indicated small molecules (N), or with ionomycin (O). Data representative of two independent experiments (L, N, O). Please also see Figure S5.
Figure 6.
Figure 6.. OsmR expression in astrocytes limits EAE severity.
(A-F) OsmR expression in ventro-lateral white matter of lumbar SC from naïve and EAE 17-dpi mice along with counter-staining for GFAP (A, inset in B), Neurofilament (C), MBP (D), CD45 (E), or Tmem119 (F). Scale bar, 25μm. Representative images from two independent experiments (total n=5 mice/group). (G, H) EAE scores of Osmrfl/fl and Osmrfl/fl;Gfapcre littermates (n=8 mice/group). Data quantified by total AUC (H). Representative of 3 independent experiments. (I, J) EAE scores of Osmrfl/fl and Osmrfl/fl;Gfapcre littermates (n=8–11 mice/group) administered PBS or d-zymosan i.v. at 1-dpi EAE. Data quantified by total AUC (J). Data combined from 2 independent experiments. Please also see Figure S6.
Figure 7.
Figure 7.. Dectin-1 responds to Gal-9 but not to hkMtb, EAE adjuvant.
(A) Schematic of the Dectin-1 stimulation reporter cell line. Extracellular and trans-membrane domains of mouse Dectin-1 were fused to the cytoplasmic domain of CD3ζ. Activation of Dectin-1 was detected by a GFP reporter. (B) Representative flow cytometry results from two independent experiments, showing Dectin-1-GFP reporter at 20-hrs with or without curdlan (200 μg/ml) or hkMtb (200 μg/ml) stimulation in tissue culture. Values indicate percentages of GFP+Dectin-1+ cells. (C) Proportions of GFP+Dectin1+ mDectin-1/mCD3ζ-GFP reporter cells with titrated concentrations of hkMtb, zymosan, or curdlan with indicated concentrations. (D, E) RT-qPCR analysis of Il6 normalized to unstimulated control (D) and heatmap of Il1b, Il6, and Tnf expression normalized to unstimulated control (E). WT, Clec7a−/−, and Card9−/− BMDCs stimulated with 200 μg/ml hkMtb in tissue culture for 3 hrs. Mean ± SEM of duplicate wells shown, with data representative of two independent experiments. (F) Lgals9 and Vim mRNA in total SC homogenates from naïve and EAE 14-dpi WT mice. Mean ± SEM, n=3 mice/group. (G) EAE scores of WT mice administered anti-Gal9 antibody or isotype control intrathecally on day 9, 11, 13, 15. n=5 mice/group), quantified by AUC (right panel). (H) EAE scores of WT mice and Clec7a−/− mice administered anti-Gal9 antibody or isotype control intrathecally on day 9, 11, 13, 15. Mean ± SEM shown, n=5 mice/group. Data quantified by AUC (right panel). (I, J) Representative images from two independent experiments of astrocytes vs. Dectin-1-expressing cells (I) or neutrophils (J). Samples were obtained from SC of WT mice at 17-dpi EAE. Please also see Figure S7.

Comment in

References

    1. Baldwin KT, Carbajal KS, Segal BM, and Giger RJ (2015). Neuroinflammation triggered by beta-glucan/dectin-1 signaling enables CNS axon regeneration. Proc Natl Acad Sci U S A 112, 2581–2586. - PMC - PubMed
    1. Bode K, Bujupi F, Link C, Hein T, Zimmermann S, Peiris D, Jaquet V, Lepenies B, Weyd H, and Krammer PH (2019). Dectin-1 Binding to Annexins on Apoptotic Cells Induces Peripheral Immune Tolerance via NADPH Oxidase-2. Cell Rep 29, 4435–4446 e4439. - PubMed
    1. Brown BR, Lee EJ, Snow PE, Vance EE, Iwakura Y, Ohno N, Miura N, Lin X, Brown GD, Wells CA, et al. (2017). Fungal-derived cues promote ocular autoimmunity through a Dectin-2/Card9-mediated mechanism. Clin Exp Immunol 190, 293–303. - PMC - PubMed
    1. Caravagna C, Jaouen A, Desplat-Jego S, Fenrich KK, Bergot E, Luche H, Grenot P, Rougon G, Malissen M, and Debarbieux F (2018). Diversity of innate immune cell subsets across spatial and temporal scales in an EAE mouse model. Sci Rep 8, 5146. - PMC - PubMed
    1. Carlson T, Kroenke M, Rao P, Lane TE, and Segal B (2008). The Th17-ELR+ CXC chemokine pathway is essential for the development of central nervous system autoimmune disease. The Journal of experimental medicine 205, 811–823. - PMC - PubMed

Publication types

MeSH terms