. 2021 May 6;28(5):863-876.e6.
doi: 10.1016/j.stem.2021.01.003. Epub 2021 Feb 12.

Coordinated changes in cellular behavior ensure the lifelong maintenance of the hippocampal stem cell population

Affiliations

Coordinated changes in cellular behavior ensure the lifelong maintenance of the hippocampal stem cell population

Lachlan Harris et al. Cell Stem Cell. .

Abstract

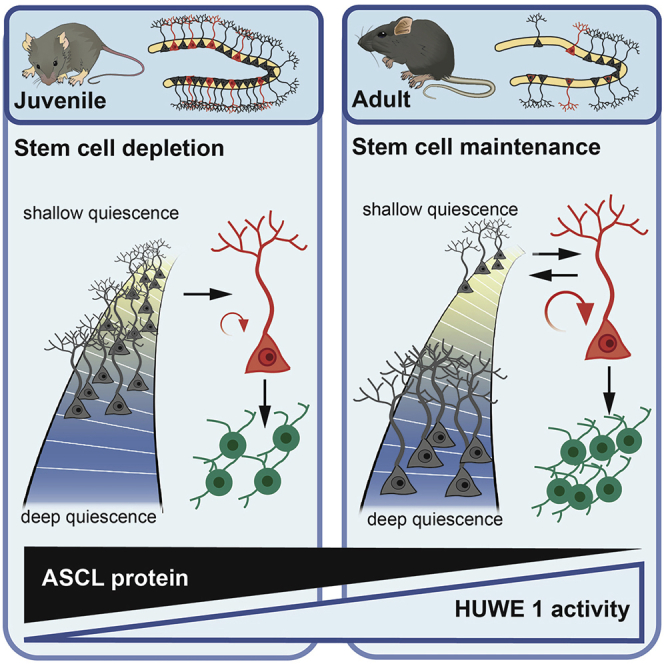
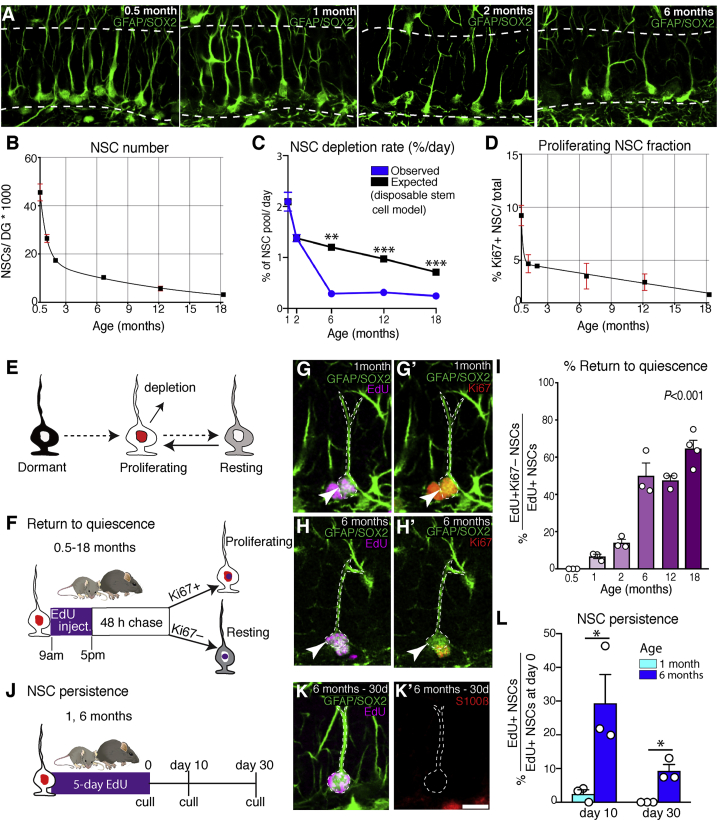
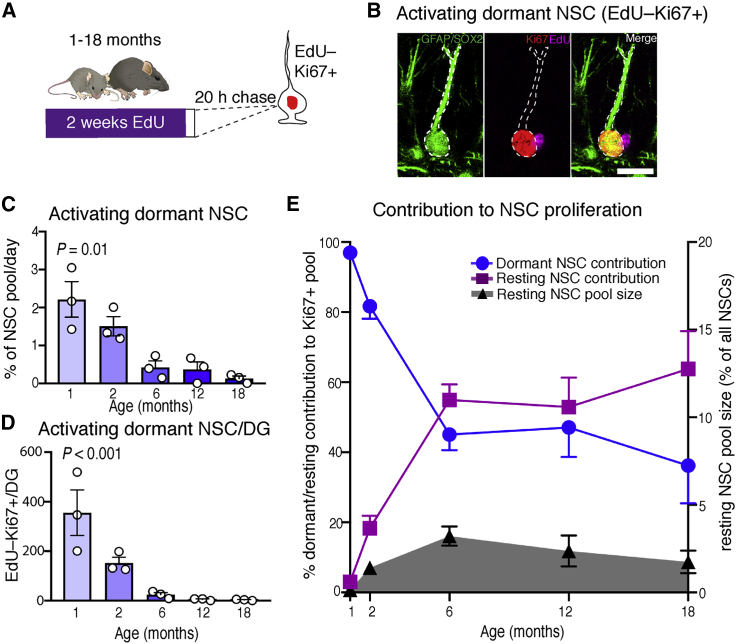
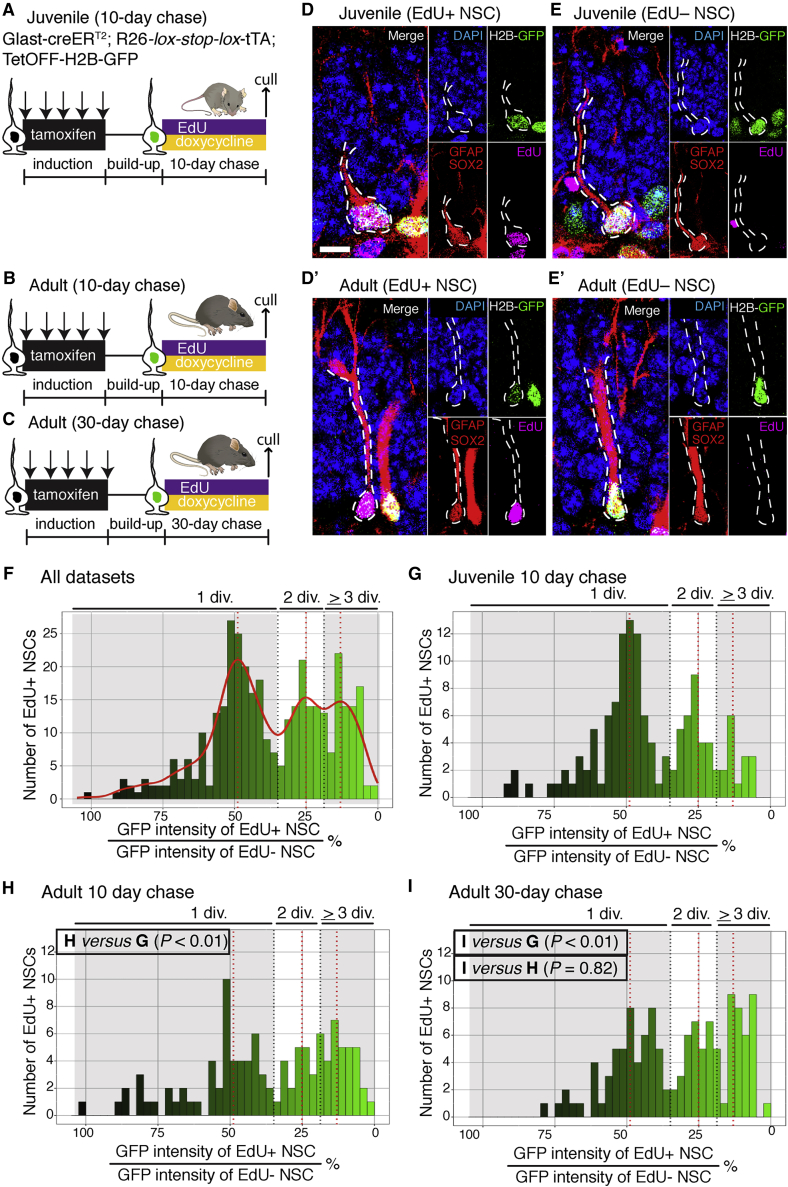
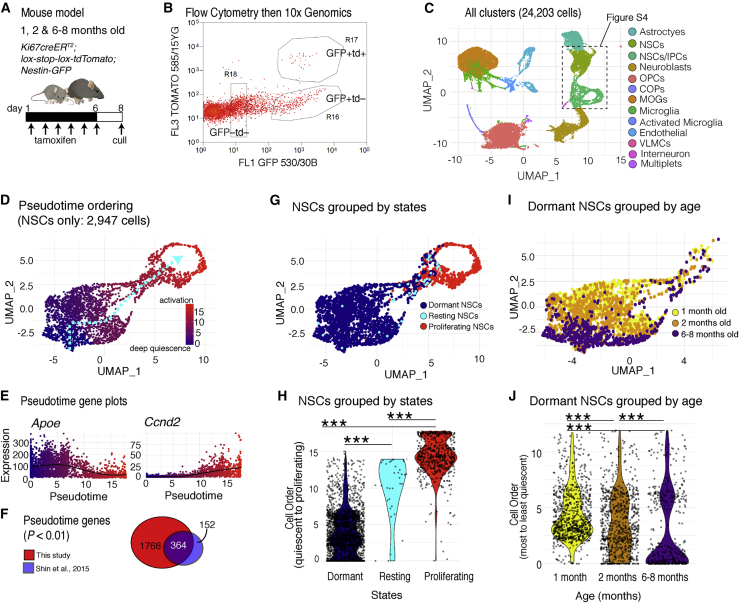
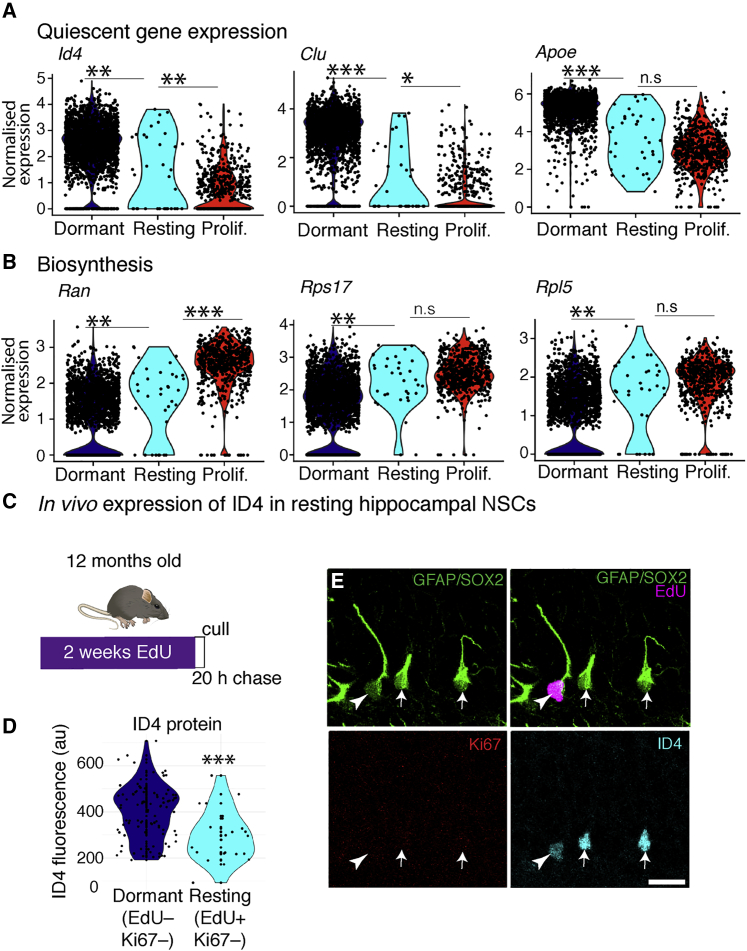
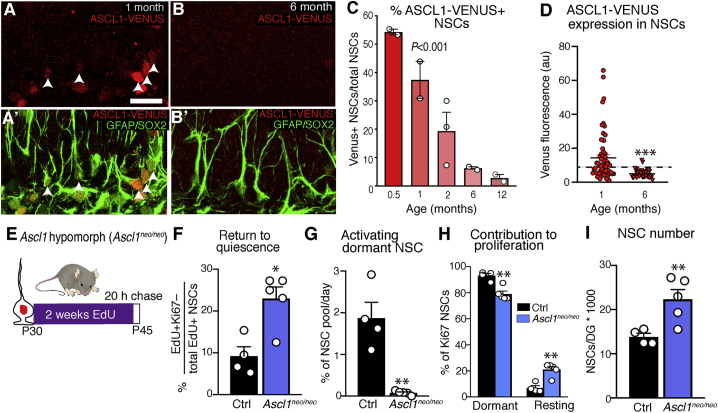
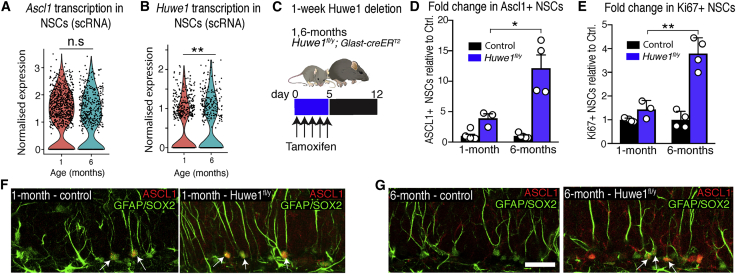
Neural stem cell numbers fall rapidly in the hippocampus of juvenile mice but stabilize during adulthood, ensuring lifelong hippocampal neurogenesis. We show that this stabilization of stem cell numbers in young adults is the result of coordinated changes in stem cell behavior. Although proliferating neural stem cells in juveniles differentiate rapidly, they increasingly return to a resting state of shallow quiescence and progress through additional self-renewing divisions in adulthood. Single-cell transcriptomics, modeling, and label retention analyses indicate that resting cells have a higher activation rate and greater contribution to neurogenesis than dormant cells, which have not left quiescence. These changes in stem cell behavior result from a progressive reduction in expression of the pro-activation protein ASCL1 because of increased post-translational degradation. These cellular mechanisms help reconcile current contradictory models of hippocampal neural stem cell (NSC) dynamics and may contribute to the different rates of decline of hippocampal neurogenesis in mammalian species, including humans.

Keywords: Ascl1; Huwe1; age; dormant; hippocampus; neural stem cell; neurogenesis; quiescence; resting.


Conflict of interest statement

Declaration of interests The authors declare no competing interests.

Figures

None
Graphical abstract
Figure 1
Figure 1
Proliferating NSCs increasingly return to quiescence with time (A) Images demonstrating that loss of hippocampal NSCs is rapid in young mice (0.5–2 months) but more gradual in adults (>2 months of age). (B) Quantification of NSC numbers from 0.5–18 months of age. (C) The rate of NSC depletion is lower than predicted by the disposable stem cell model after 2 months of age. (D) Quantification of the fraction of proliferating NSCs from 0.5–18 months of age. (E) Schematic of the different hippocampal NSC states. Dormant NSCs have never proliferated, whereas resting NSCs have returned to quiescence from a proliferating state. (F) Proliferating NSCs were labeled via EdU injections followed by a 48-h chase. (G) In young mice, EdU+ NSCs rarely returned to quiescence; most were Ki67+. (H) Return to quiescence increased in frequency with age (Ki67–). (I) Quantification of return to quiescence at different ages. (J) The ability of EdU-incorporating NSCs in 1- and 6-month-old mice to persist in the hippocampal niche was determined by measuring the fraction of EdU+ NSCs that remained as NSCs 10 and 30 days after a 5-day EdU labeling protocol. (K) Representative image of an EdU+ NSC that persisted for 30 days after labeling in a 6-month-old mouse. (L) Quantification of NSC persistence. Graphs show mean ± SEM. In (B)–(D), 3 mice were analyzed per time point, except at 12 months, where 8 mice were analyzed. Dots represent individual mice in (I) and (L). Statistics: t test in (C) and (L), and one-way ANOVA in (I). p < 0.05, ∗∗p < 0.01, ∗∗∗p < 0.001. Scale bar (located in K'): 19 μm in (A), 10 μm in (G), (G'), (H), and (H'), and 11.25 μm in (K) and (K’).
Figure 2
Figure 2
Resting NSCs increasingly contribute to the proliferative NSC pool with time (A) Mice received EdU via drinking water for 2 weeks to label proliferating and resting NSCs, followed by a 20-h chase. (B) Dormant NSCs that proliferated during the 20-h chase period were identified as EdU–Ki67+ NSCs. (C) The activation rate of dormant NSCs, normalized to the total size of the NSC pool, decreased with age, indicating deepening quiescence of this population. (D) The absolute numbers of EdU–Ki67+ cells also decreased with age. (E) The contribution of dormant NSCs to the proliferative NSC pool decreased with age, whereas the contribution of resting NSCs increased despite the resting NSC pool remaining relatively small even at advanced ages. Graphs show mean ± SEM. Dots represent individual mice in (C) and (D); in (E), 3 mice were analyzed per time point. Statistics: one-way ANOVA in (C) and (D). Scale bar in (B), 10 μm.
Figure 3
Figure 3
NSCs perform more self-renewing divisions with time (A) A juvenile cohort (P14) of H2B-GFP mice was injected with tamoxifen to induce GFP expression in NSCs. The mice received Dox for 10 days to stop label incorporation and EdU to mark dividing cells. (B) An adult cohort (5 months old) received the same treatment. (C) A second cohort of adult mice (4.5 months old) received Dox for 30 days to control for the increased time a proliferating NSC persists before depleting in adult mice. (D) The H2B-GFP label becomes diluted in EdU+ NSCs. (E) In quiescent EdU– NSCs, the label remained undiluted. (F) The GFP signal from EdU+ NSCs was categorized into discrete bins through automated analysis. These bins corresponded to the numbers of self-renewing divisions. (G) Label dilution profile of EdU+ NSCs from juvenile mice (10-day chase). (H) The label dilution profile of EdU+ NSCs from adult mice (10-day chase) showed increased self-renewal compared with juveniles. (I) Label dilution profile of EdU+ NSCs from adult mice (30-day chase) also showed increased self-renewal compared with juveniles. Statistics: Fisher’s exact test in (G)–(I). Scale bar (located in D): 15 μm in (D) and (E) and 10 μm in the subset panels in (D) and (E). div, divisions.
Figure 4
Figure 4
The quiescence depth of hippocampal NSCs is dependent on the proliferation history of the stem cell and the age of the mouse (A) Cohorts of 1-, 2-, and 6- to 8-month-old Ki67TD-NES mice were given tamoxifen and culled after 8 days, and then the DG was dissociated. (B) GFP+tdTomato+ and GFP+tdTomato− cells were collected by flow cytometry and sequenced using a 10x Genomics platform. (C) Uniform Manifold Approximation and Projection (UMAP) plot showing the 24,203 cells sequenced from 8 experiments. (D) After two iterations of subsetting and re-clustering, a dataset of 2,947 NSCs was ordered using Slingshot, revealing a pseudotime trajectory from the most quiescent NSCs (blue) to proliferating NSCs (red). (E) Pseudotime progression is correlated negatively with Apoe expression and positively with Ccnd2 expression. (F) Strong concordance between genes associated with this pseudotime trajectory and those from Shin et al. (2015). (G) UMAP plot showing the locations of dormant (quiescent and GFP+tdTomato–), resting (quiescent and GFP+tdTomato+), and proliferating NSCs (cell cycle gene expression and GFP+tdTomato+/–). (H) Plotting pseudotime positions reveals that resting NSCs are in a shallower state of quiescence than dormant NSCs. (I) UMAP plot showing the location of dormant cells according to mouse age. (J) Plotting pseudotime positions of dormant NSCs grouped by age reveals a progressive increase in quiescence depth. Dots in UMAP and violin plots represent individual cells. Statistics: Mann-Whitney U test in (H) and (J). ∗∗∗p < 0.001.
Figure 5
Figure 5
Resting NSCs display a distinct transcriptional profile indicative of a shallow quiescent state (A) Resting NSCs exhibit lower expression of quiescence marker genes than dormant NSCs (scRNA-seq). (B) Resting NSCs have increased expression of genes involved in biosynthesis compared with dormant NSCs (scRNA-seq). (C) To validate the differential gene expression analysis, 12-month-old mice received EdU for 2 weeks and were culled after a 20-h chase. (D) Resting NSCs had reduced staining intensity for ID4 than dormant NSCs. (E) Image of resting NSC (EdU+Ki67–, arrowheads) and dormant NSCs (EdU–Ki67–, arrows) with ID4 co-staining. Graphs are violin plots. Dots in violin plots represent individual cells. Statistics: t test performed on Pearson’s residuals with false discovery rate (FDR)-corrected p value in (A) and (B) and t test in (D). p < 0.05, ∗∗p < 0.01, ∗∗∗p < 0.001. Scale bar in (E), 15 μm. a.u., arbitrary units.
Figure 6
Figure 6
Ascl1 protein levels decrease with time and cause progressive changes in NSC behavior (A) ASCL1-VENUS staining in hippocampal NSCs from 1-month-old mice (arrowheads indicate positive cells) using an anti-GFP antibody. (B) ASCL1-VENUS staining in NSCs from 6-month-old mice. (C) Fewer NSCs are positive for ASCL1-VENUS with age. (D) The expression intensity of the ASCL1-VENUS protein also decreases with age. (E) Ascl1neo/neo and control mice were given EdU to label proliferating and resting NSCs and were culled following a 20-h chase. (F) Hippocampal NSCs were returning more to quiescence after proliferating (EdU+Ki67−) in Ascl1neo/neo mice than in controls. (G) Dormant NSCs activated less frequently in Ascl1neo/neo mice. (H) Resting NSCs contributed more to the proliferative NSC pool in Ascl1neo/neo mice than in controls. (I) Ascl1neo/neo mice had more NSCs than controls. Graphs represent the mean ± SEM. Dots represent individual mice, except in (D), where dots represent individual cells (minimum of 20 cells analyzed per mouse, 2 mice per age). Statistics: one-way ANOVA in (C) and t test in (D) and (F)–(I). p < 0.05, ∗∗p < 0.01, ∗∗∗p < 0.001. Scale bar (located in A): 21.9 μm in (A) and (B). a.u., arbitrary units.
Figure 7
Figure 7
Expression and activity of Huwe1 increases with time (A) Ascl1 transcript levels in NSCs are largely unchanged between young and adult mice (scRNA-seq). (B) The expression of the ubiquitin-ligase Huwe1 increases in older mice (scRNA-seq). (C) 1- and 6-month-old Huwe1fl/y and control mice were culled 1 week after receiving tamoxifen. (D) The fold change increase in ASCL1+ NSCs in Huwe1fl/y mice (relative to controls) was larger in the older cohort. (E) The fold change increase in Ki67+ NSCs in Huwe1fl/y mice (relative to controls) was also larger in the older cohort. (F) Images of control and Huwe1fl/y mice at 1 month of age; arrows indicate ASCL1+ NSCs. (G) Images of control and Huwe1fl/y mice at 6 months of age; arrows indicate ASCL1+ NSCs. Graphs represent mean ± SEM or are violin plots in (A) and (B). Dots represent single cells in (A) and (B) and individual mice in (D) and (E). Statistics: t test performed on Pearson’s residuals with FDR-corrected p value in (A) and (B) and t test in (D) and (E). p < 0.05, ∗∗p < 0.01. Scale bar (located in G): 28 μm in (F) and (G).

Comment in

References

    1. Ali F.R., Cheng K., Kirwan P., Metcalfe S., Livesey F.J., Barker R.A., Philpott A. The phosphorylation status of Ascl1 is a key determinant of neuronal differentiation and maturation in vivo and in vitro. Development. 2014;141:2216–2224. - PubMed
    1. Ameijeiras-Alonso J., Crujeiras R.M., Rodríguez-Casal A. Multimode: An R Package for Mode Assessment. arXiv. 2018 https://arxiv.org/abs/1803.00472 arXiv:1803.00472.
    1. Amrein I. Adult hippocampal neurogenesis in natural populations of mammals. Cold Spring Harb. Perspect. Biol. 2015;7:a021295. - PMC - PubMed
    1. Andersen J., Urbán N., Achimastou A., Ito A., Simic M., Ullom K., Martynoga B., Lebel M., Göritz C., Frisén J. A transcriptional mechanism integrating inputs from extracellular signals to activate hippocampal stem cells. Neuron. 2014;83:1085–1097. - PMC - PubMed
    1. Barker N., Bartfeld S., Clevers H. Tissue-resident adult stem cell populations of rapidly self-renewing organs. Cell Stem Cell. 2010;7:656–670. - PubMed

Publication types