. 2021 Jan-Jun:296:100409.
doi: 10.1016/j.jbc.2021.100409. Epub 2021 Feb 10.

DGCR8-dependent efficient pri-miRNA processing of human pri-miR-9-2

Affiliations

DGCR8-dependent efficient pri-miRNA processing of human pri-miR-9-2

Masahiro Nogami et al. J Biol Chem. 2021 Jan-Jun.

Abstract

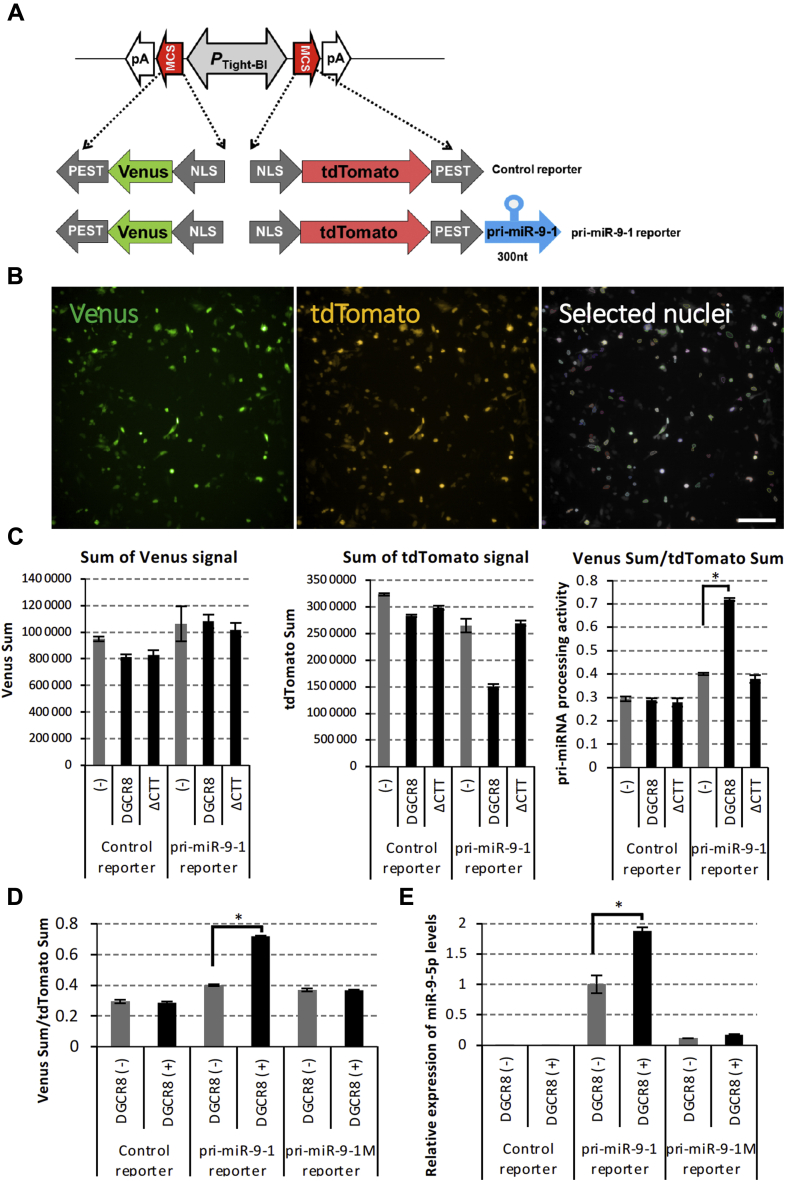
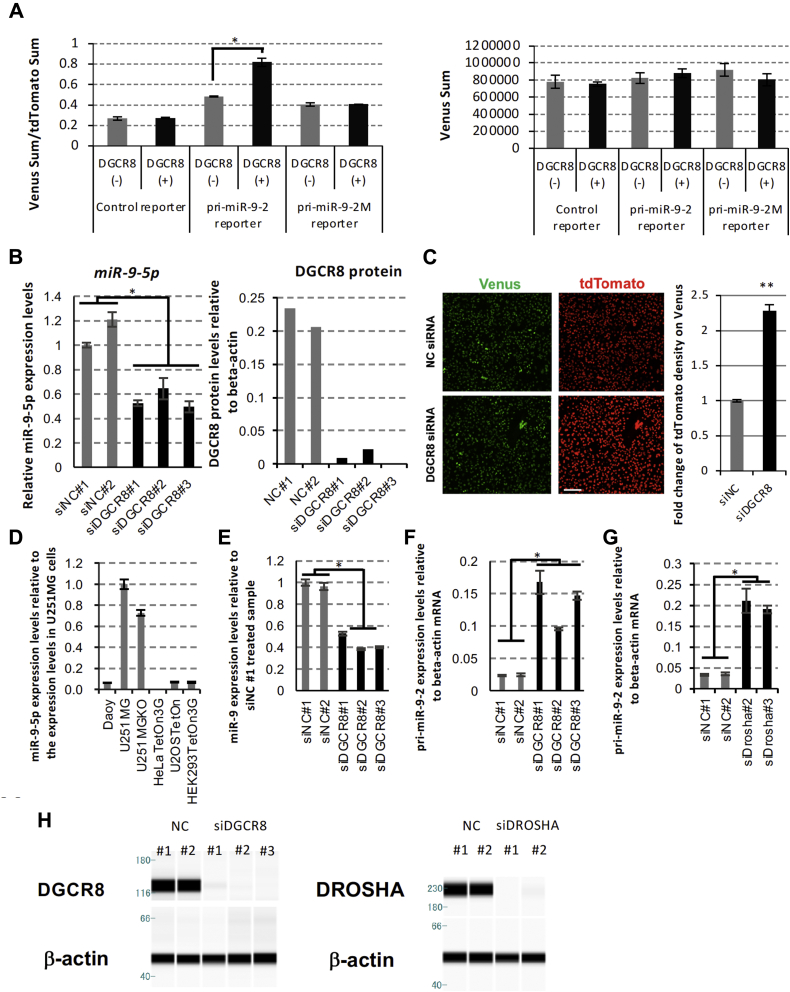
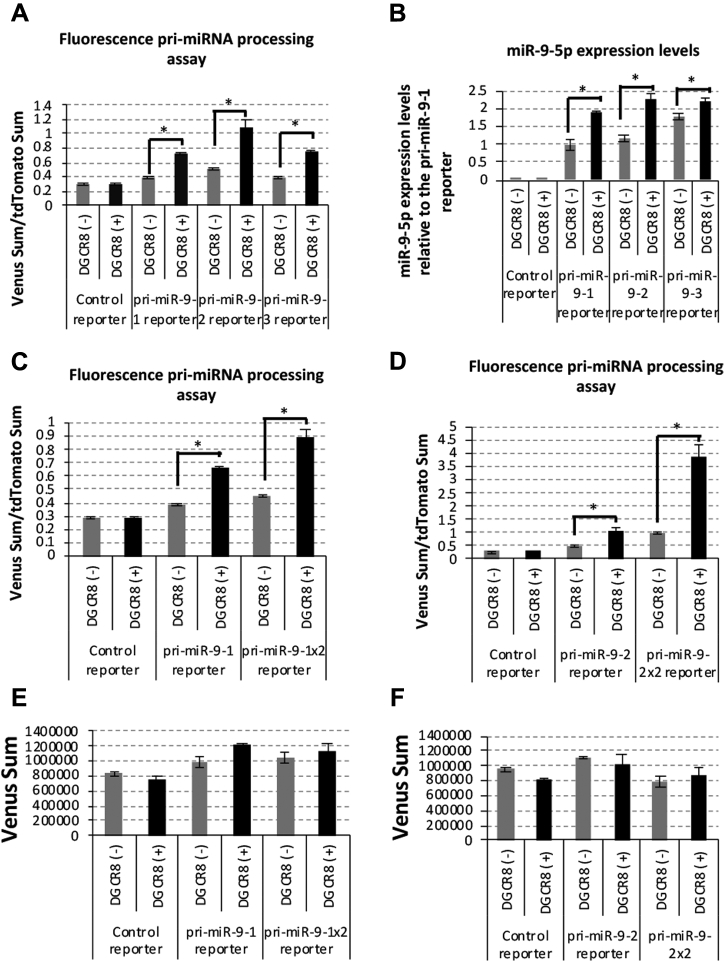
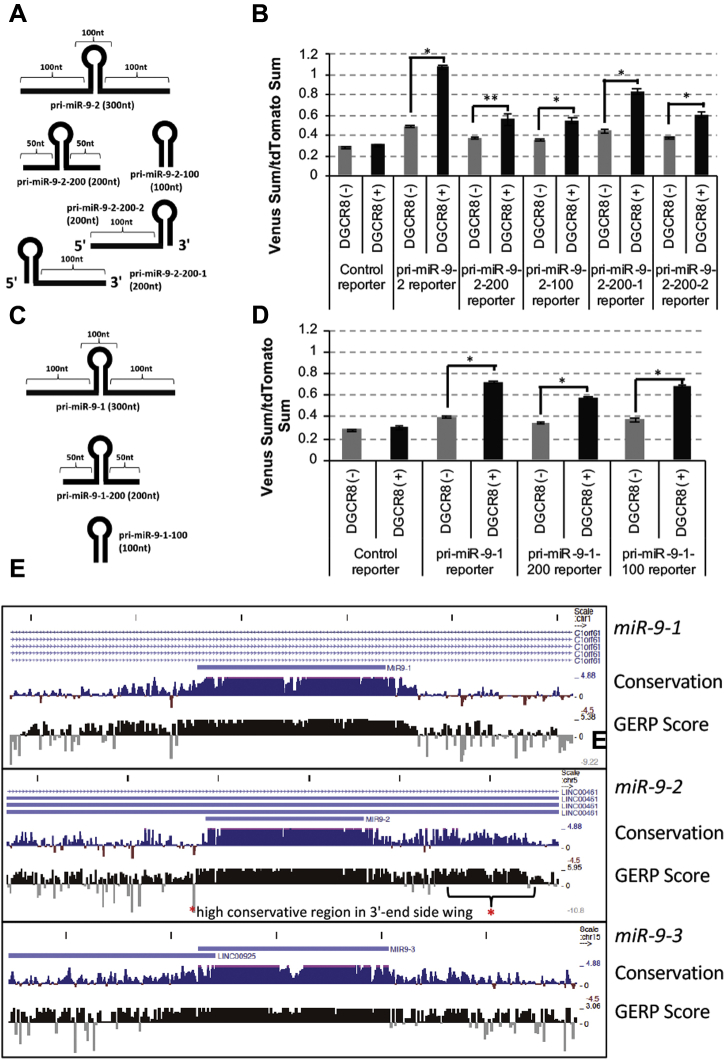
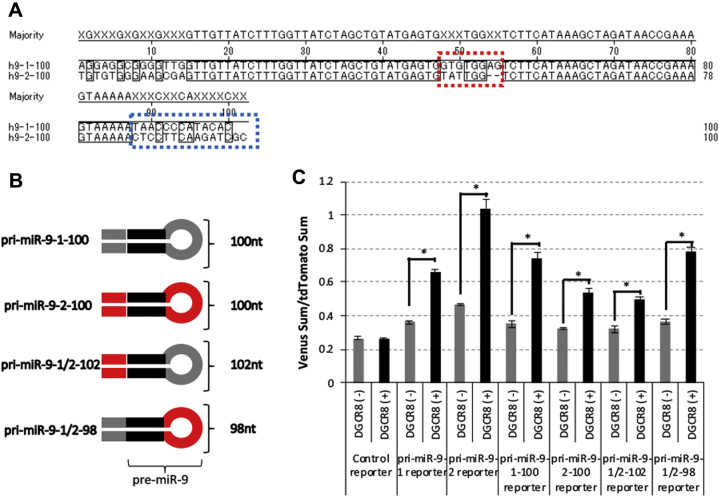
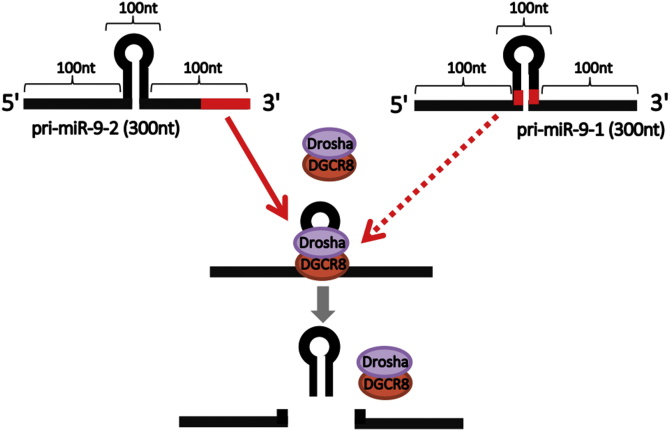
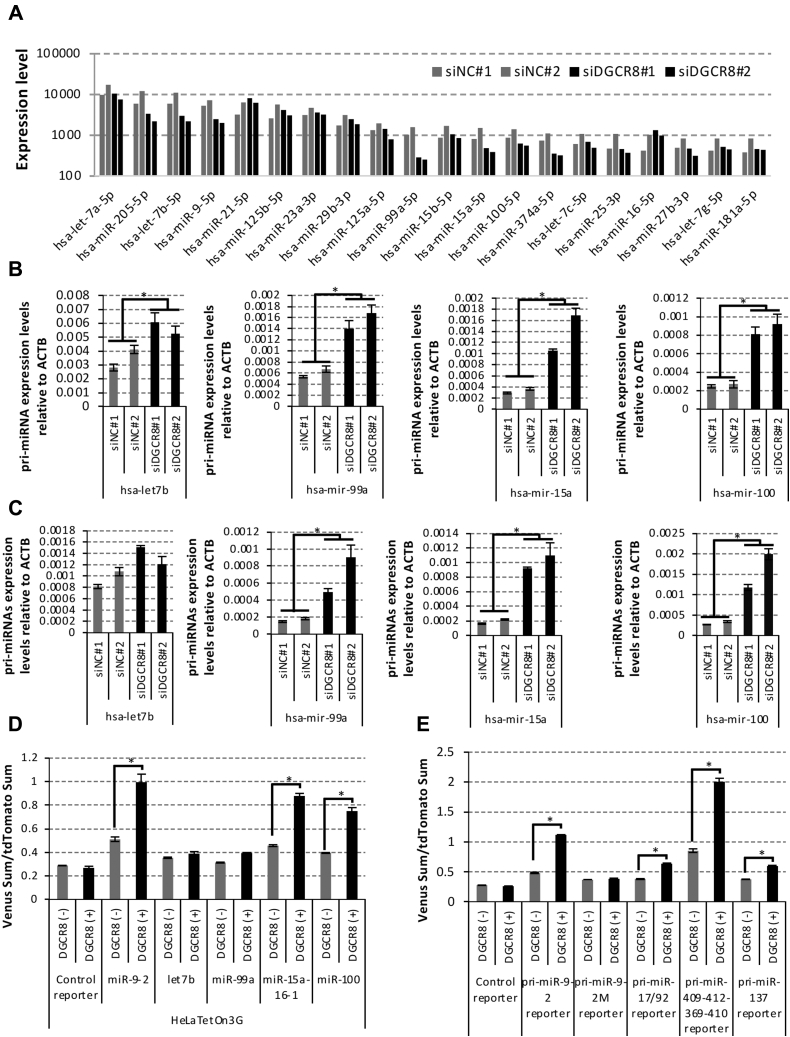
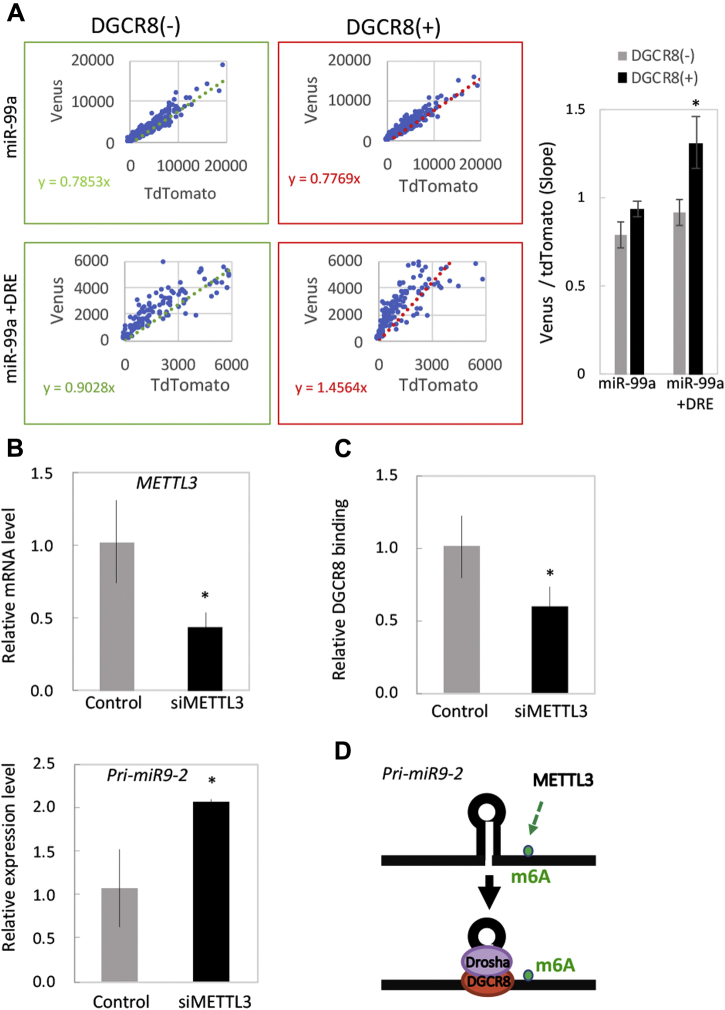
Microprocessor complex, including DiGeorge syndrome critical region gene 8 (DGCR8) and DROSHA, recognizes and cleaves primary transcripts of microRNAs (pri-miRNAs) in the maturation of canonical miRNAs. The study of DGCR8 haploinsufficiency reveals that the efficiency of this activity varies for different miRNA species. It is thought that this variation might be associated with the risk of schizophrenia with 22q11 deletion syndrome caused by disruption of the DGCR8 gene. However, the underlying mechanism for varying action of DGCR8 with each miRNA remains largely unknown. Here, we used in vivo monitoring to measure the efficiency of DGCR8-dependent microprocessor activity in cultured cells. We confirmed that this system recapitulates the microprocessor activity of endogenous pri-miRNA with expression of a ratiometric fluorescence reporter. Using this system, we detected mir-9-2 as one of the most efficient targets. We also identified a novel DGCR8-responsive RNA element, which is highly conserved among mammalian species and could be regulated at the epi-transcriptome (RNA modification) level. This unique feature between DGCR8 and pri-miR-9-2 processing may suggest a link to the risk of schizophrenia.

Keywords: DGCR8; DiGeorge syndrome; and fluorescence; miRNA; neurogenesis; pri-miR-9-2; pri-miRNA processing; ribonuclease; schizophrenia.


Conflict of interest statement

Conflict of interest H. O. is a paid member of the Scientific Advisory Board of San Bio Co, Ltd and K Pharma, Inc M. Y. is a scientific advisor of K Pharma, Inc.

Figures

Figure 1
Figure 1
Live-cell pri-miRNA processing reporter assay.A, schematic of fluorescent reporter vector construction. Venus and tdTomato mRNAs were transcribed under the Tet-On-responsive bidirectional promoter (PTight-BI). The 300-nt cDNA coding human pri-miR-9-1 was subcloned into a multicloning site (MCS) in the 3′-UTR of tdTomato mRNA. A microprocessor complex including Drosha and DGCR8 cleaves pri-miRNA to produce pre-miRNA from the 3′-UTR of tdTomato mRNA, which is destabilized because the poly(A) sequence is removed from the 3′-UTR. pA, poly(A) signal sequence. B, After transfecting the fluorescent reporter vector into HeLa Tet-On 3G cells, nuclear expression of Venus and tdTomato was observed by Opera Phenix, a high content cell imaging analyzer. The scale bar represents 200 μm. C, After transfecting the fluorescent reporter control, the pri-miRNA or pri-miR-9-1 reporter vector was transfected with pcDNA3.1 or the FLAG-DGCR8 expression vector into HeLa Tet-On 3G cells. The sums of the Venus fluorescent signal intensity and tdTomato fluorescent signal intensity in selected nuclei were shown in the graph. The relative sum of the Venus signal intensity to the sum of the tdTomato signal intensity was calculated for each well and relative values are shown. Error bars show the standard deviation (n = 3). D, fluorescence pri-miRNA processing reporter assay. Control, pri-miR-9-1, and pri-miR-9-1M were transfected with pcDNA3.1 or FLAG-DGCR8 expression vectors into HeLa Tet-On 3G and fluorescent signals were monitored from each cell. The relative sum of the Venus signal intensity to the sum of the tdTomato signal intensity was calculated in each well and shown. The error bar shows the standard deviation (n = 3). E, has-miR-9-5p was quantified by qRT-PCR with total RNA purified from HeLa Tet-On 3G cells transiently transfected with control, pri-miR-9-1, pri-miR-9-1M reporter, and FLAG-DGCR8 expression vectors. The error bar shows the standard deviation (n = 3). The asterisk indicates significant change (t-test p < 0.001); NLS, nuclear localization signal; PEST, a peptide sequence that acts as a signal peptide for protein degradation.
Figure 2
Figure 2
pri-miR-9-2 is processed by the microprocessor complex.A, the HeLa Tet On 3G clone stably expressing the pri-miR-9-2 reporter can monitor the cellular microprocessor complex activity. Venus and tdTomato proteins were induced by doxycycline treatment in a dose-dependent manner. Negative control siRNA (siNC#1) and DGCR8 siRNA (siDGCR8#1) were transfected into the cells, and nuclear expression of Venus and tdTomato was observed by the cell imaging analyzer. B, negative control siRNAs (siNC#1 and #2) and DGCR8 siRNAs (siDGCR8#1–#3) were transfected into HeLa Tet On 3G cells with pri-miR-9-2 reporter or control reporter vectors. The amount of endogenous miR-9-5p was quantified with the specific TaqMan qRT-PCR system. miR-9-5p production was suppressed by transfecting DGCR8 siRNAs. DGCR8 proteins were knocked down by DGCR8 siRNAs. C, HeLa Tet On 3G cells stably expressing the pri-miR-9-2 reporter were treated with siNC and siDGCR8, and Venus and tdTomato expression was observed by the cell imaging analyzer (left). The scale bar represents 500 μm. The fold-change of the tdTomato fluorescence signal intensity is shown in the graph. D, hsa-miR-9-5p was quantified by qRT-PCR with total RNA purified from human cell lines Daoy, U251MG, U251MG(KO), HeLa Tet-On 3G,U2OSTteOn, and HEK293TetOn3G. The error bar shows the standard deviation (n = 3). E, negative control siRNAs (siNC#1 and #2) and DGCR8 siRNAs (siDGCR8#1, #2, and #3) were transfected into U251MGKO cells, and the amount of endogenous miR-9-5p was quantified. F and G, the amount of endogenous pri-miR-9-2 was quantified in U251MGKO cells treated with DGCR8 siRNAs (F) and Drosha siRNAs (G). H, negative control siRNAs (siNC#1 and #2), DGCR8 siRNAs (siDGCR8#1, #2, and #3), and Drosha siRNAs (siDrosha#2 and #3) were transfected into U251MGKO cells, and DGCR8 and β-actin protein expression was analyzed with the Wes protein analysis system. The asterisk indicates significant change (∗ p < 0.001, ∗∗ p < 0.01)
Figure 3
Figure 3
Higher DGCR8 sensitivity of pri-miR-9-2 processing.A, fluorescent pri-miRNA processing reporter assay. Control, pri-miR-9-1, pri-miR-9-2, and pri-miR-9-3 were transfected with pcDNA3.1 or FLAG-DGCR8 expression vectors into HeLa Tet-On 3G cells, and fluorescent signals were monitored. The relative sum of the Venus signal intensity to the sum of the tdTomato signal intensity was calculated and shown in the graph. The error bar shows the standard deviation (n = 3). B, has-miR-9-5p was quantified by qRT-PCR with total RNA purified from HeLa Tet-On 3G cells transiently transfected with control, pri-miR-9-1, pri-miR-9-2, pri-miR-9-3 reporter, and FLAG-DGCR8 expression vectors. The error bar shows the standard deviation (n = 3). C, control, pri-miR-9-1, and pri-miR-9-1x2 (containing twice tandem repeat of pri-miR-9-1) reporter vectors were transfected with pcDNA3.1 control or DGCR8 expression vectors into HeLa Tet-On 3G cells and fluorescent signals monitored. The relative sum of the Venus signal intensity to the sum of the tdTomato signal intensity was calculated and is shown in the graph. The error bar shows the standard deviation (n = 3). D, control, pri-miR-9-2, and pri-miR-9-2x2 (containing twice tandem repeat of pri-miR-9-2) reporter vectors were transfected with pcDNA3.1 control or DGCR8 expression vectors into HeLa Tet-On 3G cells and fluorescent signals were monitored. The relative sum of the Venus signal intensity to the sum of the tdTomato signal intensity was calculated and is shown in the graph. The error bar shows the standard deviation (n = 3). E and F, the sum of the Venus fluorescent signal intensity in selected nuclei was calculated and is shown in the graph. The error bar shows the standard deviation (n = 3). The asterisk indicates significant change (t-test ∗p < 0.001).
Figure 4
Figure 4
pri-miR-9-2 has a DGCR8-responsive element in the 3’ wing region of pri-miR-9-2.A, schematic of deletion mutant reporters used in this study. The wing region around the stem–loop structures coding pre-miRNA was removed in the deletion mutant reporters. B, fluorescent pri-miRNA processing reporter assay. Control, pri-miR-9-2, pri-miR-9-2-200, pri-miR-9-2-100, pri-miR-9-2-200-1, and pri-miR-9-2-200-2 reporter vectors were transfected with pcDNA3.1 or FLAG-DGCR8 expression vectors into HeLa Tet-On 3G cells and fluorescent signals were monitored. The relative sum of the Venus signal intensity to the sum of the tdTomato signal intensity was calculated and is shown in the graph. The error bar shows the standard deviation (n = 3). C, schematic of deletion mutant reporters used in this study. The wing region around the stem–loop structures coding pre-miRNA was removed in the deletion mutant reporters. D, fluorescent pri-miRNA processing reporter assay. Control, pri-miR-9-1, pri-miR-9-1-200, and pri-miR-9-1-100 reporter vectors were transfected with pcDNA3.1 or FLAG-DGCR8 expression vectors into HeLa Tet-On 3G cells and fluorescent signals were monitored. The relative sum of the Venus signal intensity to the sum of the tdTomato signal intensity was calculated and is shown in the graph. The error bar shows the standard deviation (n = 3). E, alignment of human pri-miR-9-1 (300 nt) and pri-miR-9-2 (300 nt) to 35 other mammalian species by Genomic Evolutionary Rate Profiling on the UCSC Human Genome Browser. The red asterisk indicates the highly conserved region in the 3’-end wing of pri-miR-9-2. The asterisk indicates significant change (∗ p < 0.001 ∗∗ p < 0.005).
Figure 5
Figure 5
pri-miR-9-1 also has a DGCR8-responsive element in the region near the pre-miR-9-1.A, alignment analysis of human pri-miR-9-1-100 and human pri-miR-9-2-100 by the Clustal W method. The 5′-end (black dashed box), 3′-end (blue dashed box), and loop between miR-9-5p and miR-9-3p (red dashed box) are unique. The box residues match the consensus/majority exactly. B, schematic of chimera reporters used in this study. Unique sequences of pri-miR-9-1-100 and pri-miR-9-2-100 are shown in gray and red, respectively. pri-miR-9-1/2-102 (including pre-miR-9-1, and 5′- and 3′-ends of pri-miR-9-2-100) and pri-miR-9-1/2-98 (including pre-miR-9-2, and 5′- and 3′-ends of pri-miR-9-1-100) were constructed. C, fluorescence pri-miRNA processing reporter assay. Control, pri-miR-9-1, pri-miR-9-2, pri-miR-9-1-100, pri-miR-9-2-100, pri-miR-9-1/2-102, and pri-miR-9-1/2-98 reporter vectors were transfected with pcDNA3.1 or FLAG-DGCR8 expression vectors and fluorescent signals were monitored. The relative sum of the Venus signal intensity to the sum of the tdTomato signal intensity was calculated and is shown in the graph. The error bar shows the standard deviation (n = 4). The asterisk indicates significant change (t-test p < 0.001).
Figure 6
Figure 6
DGCR8-responsive RNA elements in human pri-miR9-1 and pri-miR9-2. DGCR8-responsive RNA elements (DREs) were identified in this study. The DRE of pri-miR-9-1 is in the vicinity of pre-miR-9-1, and the DRE of pri-miR-9-2 is in the 3’ wing region. DRE promotes pri-miR-9 processing activity in an ectopically expressed DGCR8-dependent manner.
Figure 7
Figure 7
Exploration of pri-miRNA candidates possessing DRE.A, miRNA profiling of U251 MG (KO) cells treated with siNC#1, siNC#2 siDGCR8#1, and siDGCR8#2 was performed with the nCounter miRNA analysis system. Expression levels of top20 ranked miRNAs are shown in the graph. The bar graph indicates the average in each two technical replicates (n = 1). B, pri-miRNA expression levels of hsa-let-7b-5p, hsa-miR-99a-5p, hsa-miR-15a-5p, and hsa-miR-100-5p in U251 MG (KO) cells treated with siNC#1, siNC#2 siDGCR8#1, and siDGCR8#2 were quantified by qRT-PCR. The error bar represents SD using four biological replicates. C, pri-miRNA expression levels of hsa-let-7b-5p, hsa-miR-99a-5p, hsa-miR-15a-5p, and hsa-miR-100-5p in HeLa Tet-On 3G cells treated with siNC#1, siNC#2 siDGCR8#1, and siDGCR8#2 were quantified by qRT-PCR. The error bar represents SD using four biological replicates. D, pri-miRNA processing reporters containing pri-miR-9-2 (300 nt), pri-let-7b (300 nt), pri-miR-99a (300 nt), pri-miR-15a-16-1 (400 nt), and pri-miR-100 (300 nt) were constructed and the processing assay was performed with HeLa Tet-On 3G cells. The error bar represents SD using three biological replicates. E, pri-miRNA processing reporters containing pri-miR-9-2 (300 nt), pri-miR-9-2M (300 nt), pri-miR-17/92 (887 nt), pri-miR-409-412-369-410 (800 nt), and pri-miR-137 (500 nt) were constructed, and the processing assay was performed with HeLa Tet-On 3G cells. The error bar represents SD using three biological replicates. Asterisks indicate significant change (∗p < 0.01).
Figure 8
Figure 8
Role of DRE in DGCR8-dependent microprocessor activity.A, pri-miRNA processing reporters containing pri-miR-99a (300 nt) and pri-miR-99a+DRE (300 nt) were constructed, and the processing assay was performed with HeLa Tet-On 3G cells. The graph indicates plots for each cell obtained from Venus and tdTomato fluorescence signals. Slopes from linear regression are shown in each graph. The bar graph indicates slopes with or without DGCR8. The asterisk indicates significant change (t-test p = 0.026). B, RNA expression levels of METTL3 and unprocessed pri-miR-9-2 in U251 MG (KO) cells treated with siNC#1, siNC#2 siMETTL3#1, and siMETTL3#2 were quantified by qRT-PCR. The asterisk indicates significant change (t-test p < 0.01) C, Quantification of DGCR8-bound pri-miRNA was analyzed by CLIP-qRT-PCR assay. The asterisk indicates significant change (t-test p < 0.05). D, Model of DRE in DGCR8-dependent microprocessor activity. DRE, DGCR8-responsive RNA element; CLIP, UV cross-linking and immunoprecipitatio.

Similar articles

Cited by

References

    1. Ambros V. MicroRNAs and developmental timing. Curr. Opin. Genet. Dev. 2011;21:511–517. - PMC - PubMed
    1. Guo H., Ingolia N.T., Weissman J.S., Bartel D.P. Mammalian microRNAs predominantly act to decrease target mRNA levels. Nature. 2010;466:835–840. - PMC - PubMed
    1. Fabian M.R., Sonenberg N., Filipowicz W. Regulation of mRNA translation and stability by microRNAs. Annu. Rev. Biochem. 2010;79:351–379. - PubMed
    1. Kim V.N., Han J., Siomi M.C. Biogenesis of small RNAs in animals. Nat. Rev. Mol. Cell Biol. 2009;10:126–139. - PubMed
    1. Lee Y., Jeon K., Lee J.T., Kim S., Kim V.N. MicroRNA maturation: Stepwise processing and subcellular localization. EMBO J. 2002;21:4663–4670. - PMC - PubMed

Publication types

LinkOut - more resources