. 2021 Apr:115:105166.
doi: 10.1016/j.oraloncology.2020.105166. Epub 2021 Feb 11.

Synergistic efficacy of combined EGFR and HDAC inhibitors overcomes tolerance to EGFR monotherapy in salivary mucoepidermoid carcinoma

Affiliations

Synergistic efficacy of combined EGFR and HDAC inhibitors overcomes tolerance to EGFR monotherapy in salivary mucoepidermoid carcinoma

Kshitij Parag-Sharma et al. Oral Oncol. 2021 Apr.

Abstract

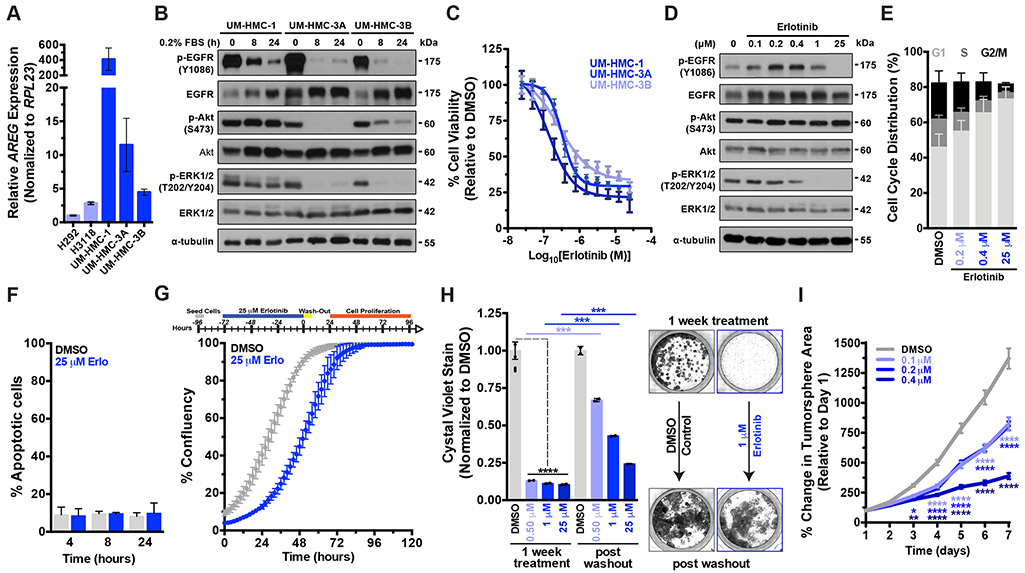
Objectives: Mucoepidermoid carcinoma (MEC) is the most common type of salivary gland malignancy. Advanced or high-grade MECs are refractory to chemotherapy, often leading to tumor recurrence/metastasis and abysmal ~35% 5-year survival. Causal links have been established between Epithelial Growth Factor Receptor (EGFR) activation and poor outcome. Herein we investigated the therapeutic efficacy of EGFR inhibition against MEC using in vitro pre-clinical models.

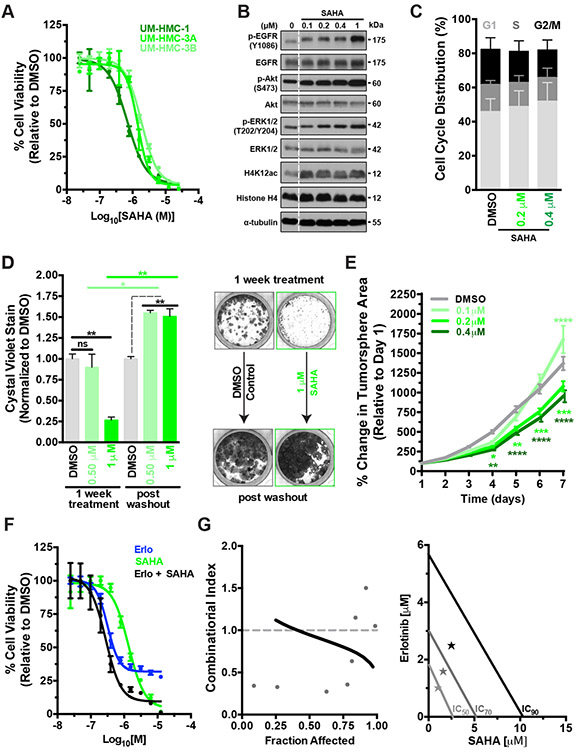
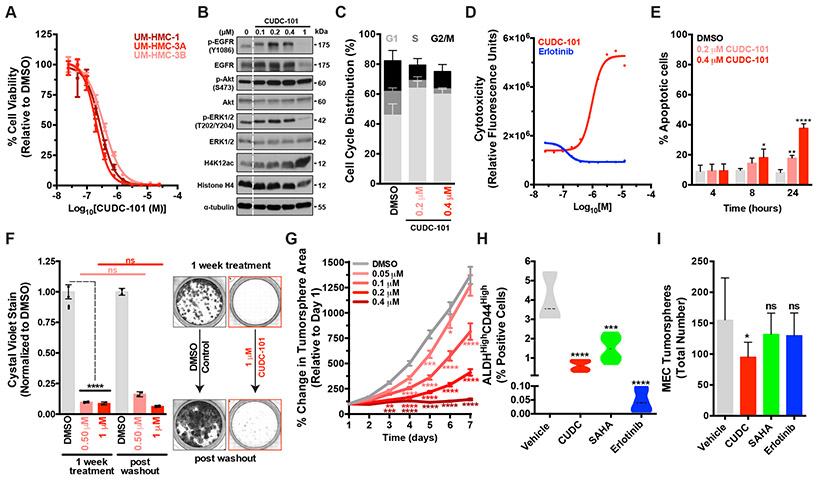
Materials and methods: Five human MEC cell lines were used in cell viability, cytotoxicity, apoptosis, cell cycle, 2D-clonogenicity, and 3D-spheroid formation assays following treatment with Erlotinib (EGFR inhibitor), SAHA (Histone Deacetylase inhibitor; HDAC) and CUDC-101 (dual EGFR-HDAC inhibitor). Effects on MEC cancer stem cells were evaluated using flow cytometry. Gene expression and pathway regulation were evaluated via qPCR and Western blot, respectively.

Results: MEC cells enter a quiescent, non-proliferative yet rapidly reversible drug tolerant state upon EGFR inhibition. Despite robust suppression of MEC cell proliferation, no discernable apoptosis is detected. Combination of EGFR and HDAC inhibitors exhibits synergistic effects, exerting ~5-fold more potent cell cytotoxicity compared to HDAC or EGFR monotherapy. CUDC-101, a single molecule with dual EGFR-HDAC inhibitor moieties, exerts irreversible and potent cytotoxic activity against MEC cells and blunts MEC cancer stem-cell tumorigenicity.

Conclusion: MEC cells are intrinsically tolerant to EGFR inhibition. Combining EGFR and HDAC inhibitors exerts synergistic and potent cytotoxic effects, suggesting that EGFR inhibitors still hold significant promise against MEC. Future studies are needed to assess the applicability and efficacy of dual EGFR-HDAC inhibitors for the clinical management of MEC.

Keywords: CUDC-101; Drug synergy; Drug tolerance; EGFR; HDAC; Head and neck cancer; Mucoepidermoid carcinoma; Salivary cancer.


Conflict of interest statement

DECLARATION OF COMPETING INTERESTS

The authors declare no potential conflicts of interest.

Figures

Figure 1.
Figure 1.. Continuous EGFR activation is required for proliferation but is not necessary for MEC cell survival.
A) Real-time qPCR was performed to quantify relative AREG mRNA expression in five C1/M2 fusion positive MEC cell lines (n = 3, mean ± SEM) under normal culture conditions. B) Western blot analysis of EGFR signaling activation status as assessed by p-EGFR (Y1086) and downstream p-AKT (S473) and p-ERK1/2 (T202/Y204) levels under serum starvation. C) Dose-response curves were performed using concentrations ranging from 25 nM to 25 μM and cell viability was assayed 72 hours post drug addition (mean ± SEM). D) Erlotinib treatment of UM-HMC-3A cells causes a dose dependent decrease in p-EGFR and p-ERK1/2 See Supplementary Fig. 3B for full blots. E) Erlotinib treatment causes robust and dose dependent cell cycle arrest in UM-HMC-3A cells (n = 3, mean ± SEM). G1 phase- DMSO vs 0.2 μM (**), vs 0.4 μM (****), vs 25 μM (****). S phase- DMSO vs 0.2 μM (ns), vs 0.4 μM (**), vs 25 μM (***). G2/M phase- DMSO vs 0.2 μM (ns), vs 0.4 μM (**), vs 25 μM (****). p values were determined by 2way ANOVA multiple comparisons test (Sidak); ns = p > 0.05, *= p ≤ 0.05, **= p ≤ 0.01, ***= p ≤ 0.001, ****= p ≤ 0.0001. F) UM-HMC-3A cells were treated with 25 μM Erlotinib and activated caspase 3/7 levels measured (n = 3, mean ± SEM). 8 hr- DMSO vs Erlotinib, and 24 hr- DMSO vs Erlotinib, all not significant (p>0.05). P values were determined using Student’s t-test, comparing DMSO vs Erlotinib for each time point. Also see Supplementary Fig. 1A. G) top, Schematic for drug withdrawal experiment. Erlotinib-treated MEC cells rapidly proliferate upon drug withdrawal (n = 2, mean ± SEM). Also see Supplementary Fig. 1B-C. H) left, 2D clonogenic growth capacity of UM-HMC-3A cells (n = 2, mean ± SEM). Cells were treated with drug and then allowed to form colonies for 7 days, at which point cells were fixed and stained with crystal violet and colonies quantified. For the drug withdrawal condition, 7 Days post drug addition, drug was washed out and cells were allowed to outgrow for an additional 7 days and colonies quantified. P values were determined by 2-way ANOVA multiple comparisons test (Sidak); ***= p ≤ 0.001, ****= p ≤ 0.0001. Also see Supplementary Fig. 1D. right, Representative images of the 2D colony formation assays. I) Quantification of 3D tumor spheroid growth, ≥100 individual UM-HMC-3A cell spheroids was monitored daily over a period of 7 days per experiment (mean ± SEM). P values were determined by 2way ANOVA multiple comparisons test (Dunnett); *= p ≤ 0.05, **= p ≤ 0.01, ****= p ≤ 0.0001. Also see Supplementary Fig. 1E
Figure 2.
Figure 2.. The HDAC inhibitor SAHA displays potent yet transient cytotoxicity in MEC cells but synergizes with EGFR inhibition.
A) Dose-response curves were performed using concentrations ranging from 25 nM to 25 μM and cell viability was assayed 72 hours post drug addition (mean ± SEM). B) SAHA treatment of UM-HMC-3A leads to a dose dependent accumulation of acetylated-histones and causes upregulation of p-EGFR and p-ERK. C) UM-HMC-3A cells were treated with SAHA for 24 hours and cell cycle profiles evaluated (n = 3, mean ± SEM). G1 phase- DMSO vs 0.2 μM (ns), vs 0.4 μM (ns). S phase- DMSO vs 0.2 μM (ns), vs 0.4 μM (ns). G2/M phase- DMSO vs 0.2 μM (ns), vs 0.4 μM (ns). P values were determined by 2way ANOVA multiple comparisons test (Sidak); ns = p > 0.05. D) 2D colony formation capacity of UM-HMC-3A cells (n = 2, mean ± SEM). Cells were treated with drug and then allowed to form colonies for 7 days, at which point cells were fixed and stained with crystal violet and colonies quantified. For the drug withdrawal condition, 7 Days post drug addition, drug was washed out and cells were allowed to outgrow for an additional 7 days and colonies quantified. P values were determined by 2-Way ANOVA multiple comparisons test (Sidak); ns = p > 0.05, *= p ≤ 0.05, **= p ≤ 0.01. Also see Supplementary Fig. 2A. right, Representative images of the 2D colony formation assays. E) SAHA has minimal effects on MEC cell 3D tumor spheroid growth. ≥100 individual UM-HMC-3A cell spheroids were monitored daily over a period of 7 days per experiment (mean ± SEM). P values were determined by 2way ANOVA multiple comparisons test (Dunnett); *= p ≤ 0.05, **= p ≤ 0.01, ****= p ≤ 0.0001. Also see Supplementary Fig. 1E. F) Dose-response curves were performed using combinatorial equimolar SAHA + Erlotinib [1:1] treatment ranging from 12.5 nM to 12.5 μM, cell viability was assayed 72 hours post drug addition (n = 2, mean ± SEM). center, Synergism curves generated using CompuSyn software analysis tool (Chou-Talay method). Data for Erlotinib, SAHA and SAHA+Erlotinib from Figures 1B, 2A and 2C were used for modeling synergism, respectively. A combinatorial index of <1 represents synergistic interactions. G) Data from Figure 2C, center graphed as an Isobologram plot. SAHA+Erlotinib exhibits robust synergism relative to clinically-relevant IC70 and IC90 efficacies.
Figure 3.
Figure 3.. The multi-target EGFR-HDAC inhibitor CUDC-101 exerts robust and irreversible cytotoxicity in MEC cells and blunts CSC-mediated tumorigenic capacity.
A) Dose-response curves were performed using concentrations ranging from 25 nM to 25 μM and cell viability was assayed 72 hours post drug addition (mean ± SEM). B) CUDC-101 treatment of UM-HMC-3A leads to a dose dependent accumulation of acetylated-histones and downregulation of p-EGFR and p-ERK. C) UM-HMC-3A cells were treated with CUDC-101 for 24 hours and cell cycle profiles were evaluated (n = 3, mean ± SEM). G1 phase- DMSO vs 0.2 μM (**), vs 0.4 μM (****), vs 25 μM (****). S phase- DMSO vs 0.2 μM (ns), vs 0.4 μM (**), vs 25 μM (***). G2/M phase- DMSO vs 0.2 μM (ns), vs 0.4 μM (**), vs 25 μM (****). p values were determined by 2-way ANOVA multiple comparisons test (Sidak); ns = p > 0.05, *= p ≤ 0.05, **= p ≤ 0.01, ***= p ≤ 0.001, ****= p ≤ 0.0001. D) Dose-response curves were performed using the indicated drugs at concentrations ranging from 25 nM to 25 μM and cell toxicity/death was assayed 72 hours post drug addition (mean ± SEM). Also see Supplementary Fig. 1A and 2C. E) UM-HMC-3A cells were treated with CUDC-101 for 24 hours and assayed for apoptosis. Experiment is representative of biologic triplicate (mean ± SEM). P values were determined using Student’s t-test, comparing DMSO vs Erlotinib for each timepoint. Also see Supplementary Fig. 2C. F) 2D colony formation capacity of UM-HMC-3A cells and (n = 2, mean ± SEM). Cells were treated with drug and then allowed to form colonies for 7 days, at which point cells were fixed and stained with crystal violet and colonies were quantified. For the drug withdrawal condition, 7 Days post drug addition, drug was washed out and cells were allowed to outgrow for an additional 7 days and colonies quantified. P values were determined by 2-Way ANOVA multiple comparisons test (Sidak); ns = p > 0.05, *= p ≤ 0.05, **= p ≤ 0.01. Also see Supplementary Fig. 3D. right, Representative images of the 2D colony formation assays. G) 3D tumor spheroid growth, ≥100 individual UM-HMC-3A cell spheroids were monitored daily over a period of 7 days per experiment (mean ± SEM). P values were determined by 2-way ANOVA multiple comparisons test (Dunnett); *= p ≤ 0.05, **= p ≤ 0.01, ****= p ≤ 0.0001. Also see Supplementary Fig. 1E. H) MEC cells were treated with sub-IC50 doses of each respective drug (50 nM) for 7 days and flow cytometry was performed to quantify the ALDHhighCD44high CSC population. I) MEC tumorsphere formation capacity was assessed using ultra-low adhesion conditions and measured 7 days post seeding.

Similar articles

Cited by

References

    1. El-Naggar AKCJ, Grandis JR, Takata TSP. WHO Classification of Head and Neck Tumours. 4th Editio. IARC Press; 2016.
    1. Jacob PK, McCoy JM. Diagnostic Imaging of Salivary Gland Pathology. 2nd Edition ed.-Chapter 2. Wiley-Blackwell; 2015.
    1. Seethala RR. An update on grading of salivary gland carcinomas. Head Neck Pathol 2009;3:69–77. 10.1007/s12105-009-0102-9. - DOI - PMC - PubMed
    1. Becker C, Pfeiffer J, Lange K DK. Health-related quality of life in patients with major salivary gland carcinoma. Eur Arch Otorhinolaryngol 2018;275:997–1003. 10.1007/s00405-018-4914-7. - DOI - PubMed
    1. Wax MKTY. Quality of Life after Salivary Gland Surgery. Adv Otorhinolaryngol 2016;78:189–97. 10.1159/000442140. - DOI - PubMed

Publication types

MeSH terms