

Regional variation in outcomes and healthcare resources utilization in, emergency department visits for syncope
- PMID: 33581602
- PMCID: PMC11290478
- DOI: 10.1016/j.ajem.2021.01.042
Regional variation in outcomes and healthcare resources utilization in, emergency department visits for syncope
Abstract
Background: Management of patients with syncope lacks standardization. We sought to assess regional variation in hospitalization rates and resource utilization of patients with syncope.
Methods: We identified adults with syncope using the Nationwide Emergency Department Sample from years 2006 to 2014. Demographics and comorbidity characteristics were compared across geographic regions in the US. Multiple regression was conducted to compare outcomes.
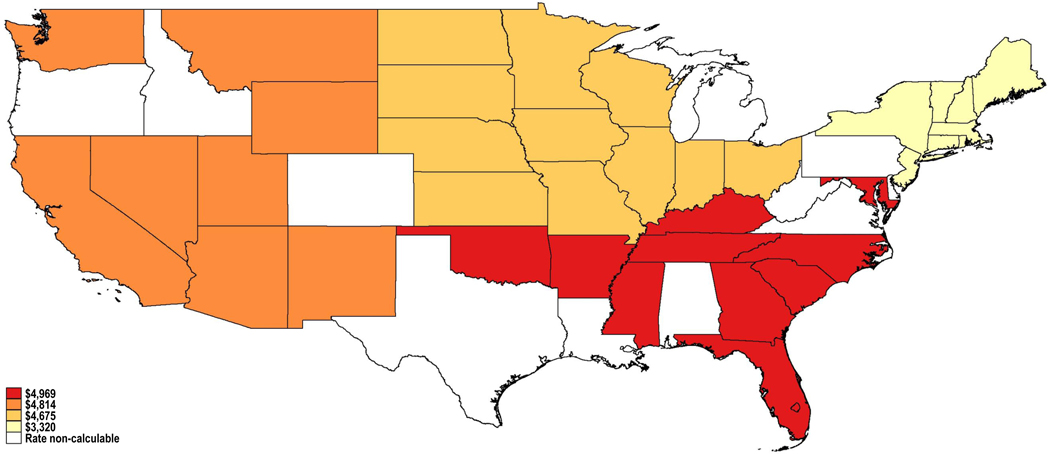
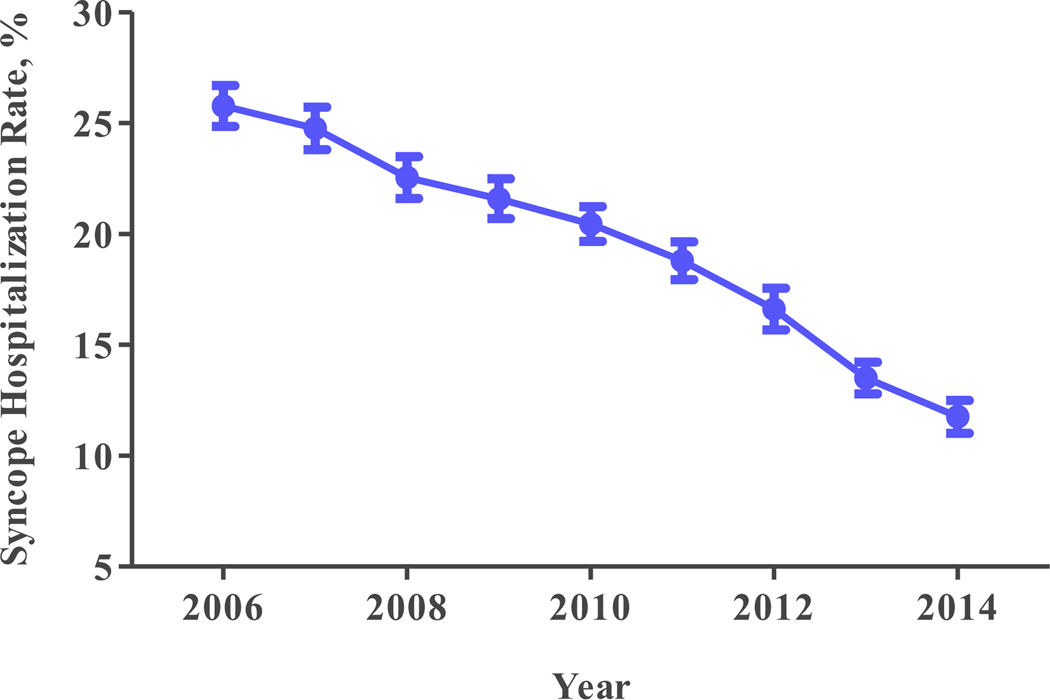
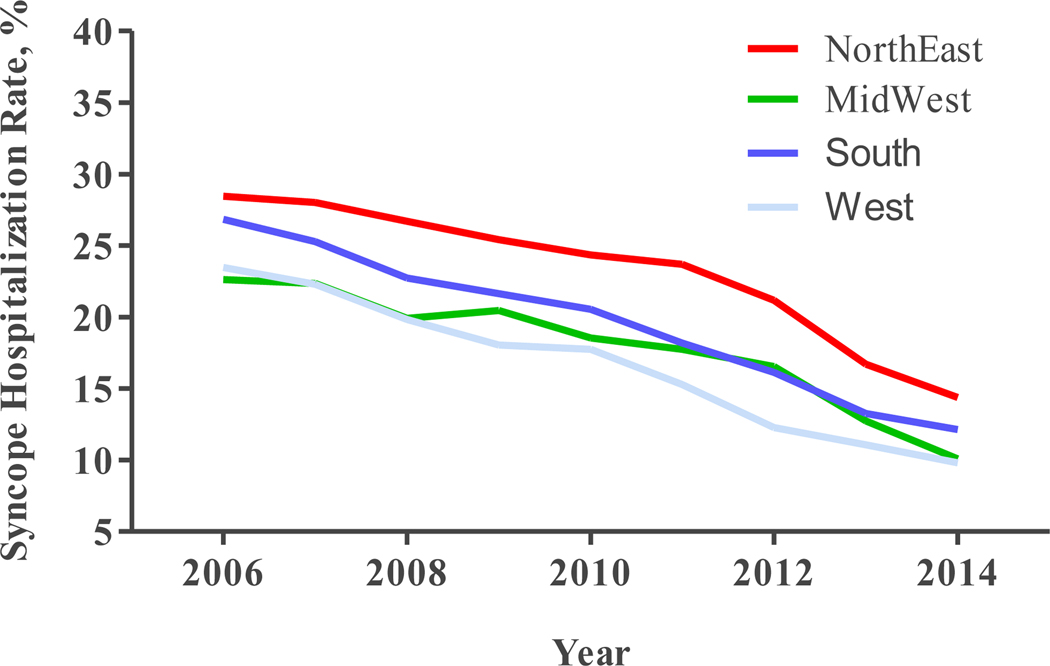
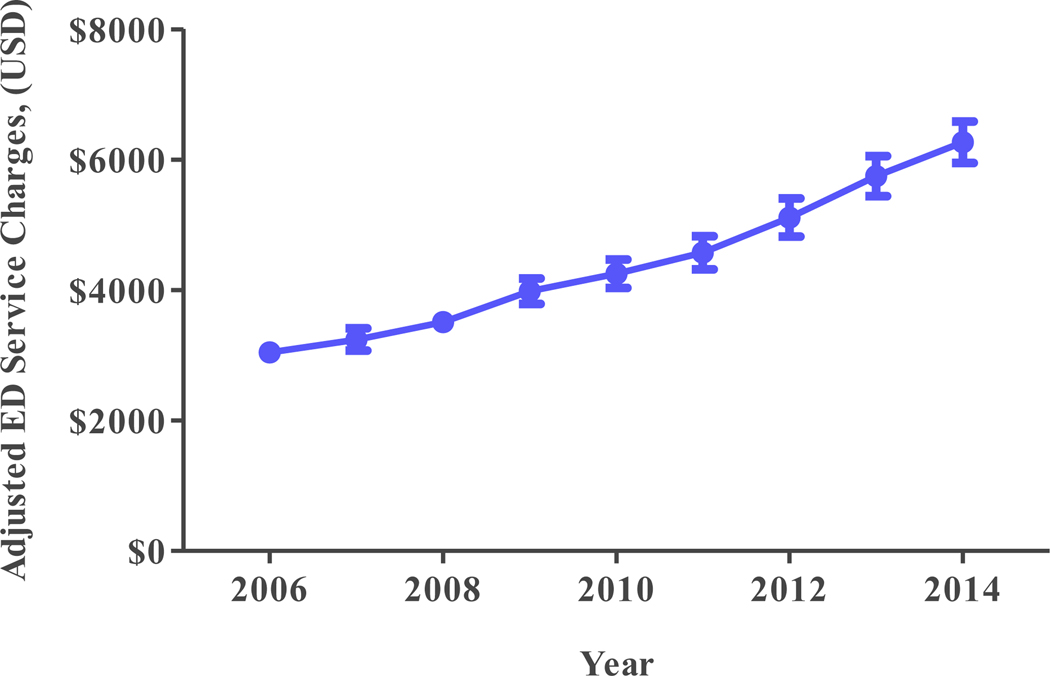
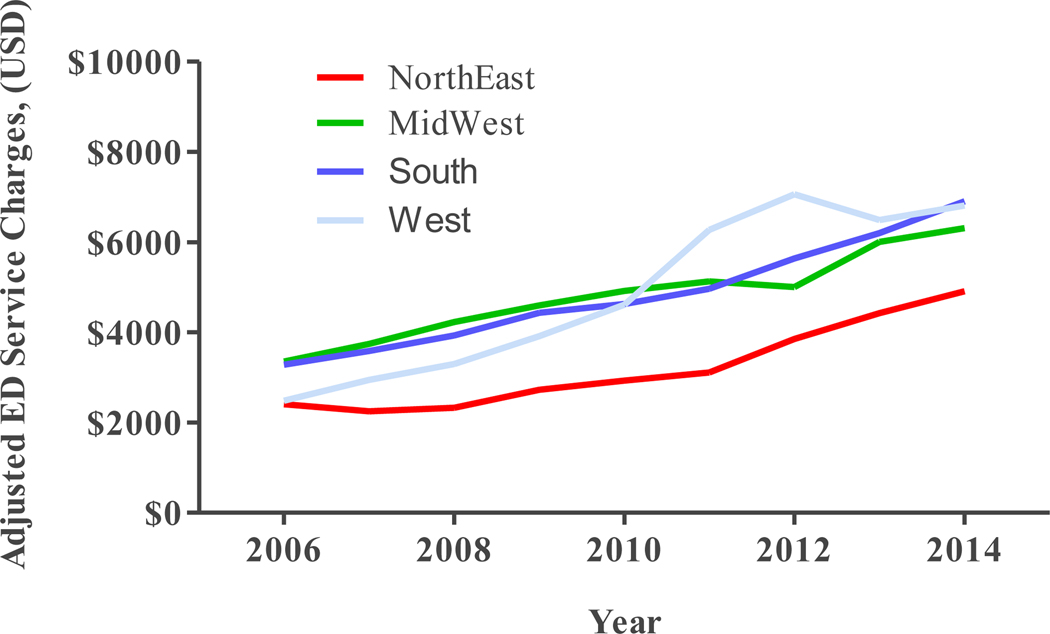
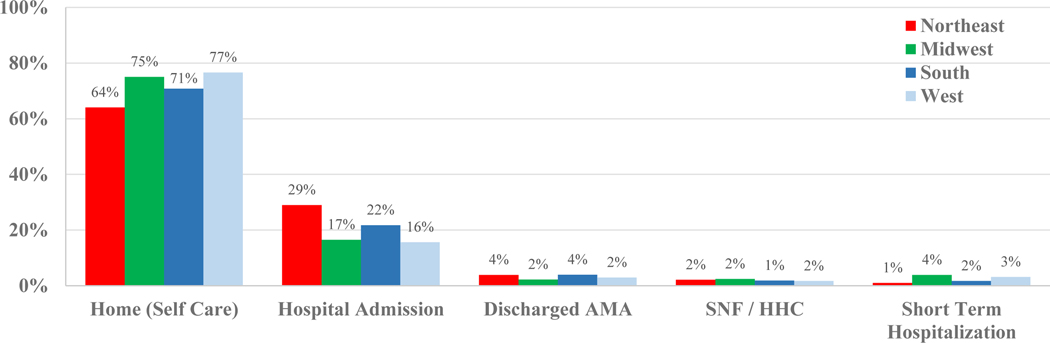
Results: 9,132,176 adults presented with syncope. Syncope in the Northeast (n = 1,831,889) accounted for 20.1% of visits; 22.6% in the Midwest (n = 2,060,940), 38.5% in the South (n = 3,527,814) and 18.7% in the West (n = 1,711,533). Mean age was 56 years with 57.7% being female. The Northeast had the highest risk-adjusted hospitalization rate (24.5%) followed by the South (18.6%, ORadj 0.58; 95% CI 0.52-0.65, p < 0.001), the Midwest (17.2%, ORadj 0.51; 95% CI 0.46-0.58, p < 0.001) and West (15.8%, ORadj 0.45; 95% CI 0.39-0.51, p < 0.001). Risk-adjusted rates of syncope hospitalizations significantly declined from 25.8% (95% CI 24.8%-26.7%) in 2006 to 11.7% (95% CI 11.0%-12.5%) in 2014 (Ptrend < 0.001). The Northeast had the lowest risk-adjusted ED (Emergency Department) service charges per visit ($3320) followed by the Midwest ($4675, IRRadj 1.41; 95% CI 1.30-1.52, p < 0.001), the West ($4814, IRRadj 1.45; 95% CI 1.31-1.60, p < 0.001) and South ($4969, IRRadj 1.50; 95% CI 1.38-1.62, p < 0.001). Service charges increased from $3047/visit (95% CI $2912-$3182) in 2006 to $6267/visit (95% CI $5947-$6586) in 2014 (Ptrend < 0.001).
Conclusions: Significant regional variability in hospitalization rates and ED service charges exist among patients with syncope. Standardizing practices may be needed to reduce variability.
Keywords: Emergency department; Large database; Regional variation; Syncope.
Copyright © 2021 Elsevier Inc. All rights reserved.
Conflict of interest statement
Figures

Similar articles
-
Emergency Department and Inpatient Healthcare utilization due to Hypertension.BMC Health Serv Res. 2016 Jul 26;16:303. doi: 10.1186/s12913-016-1563-7. BMC Health Serv Res. 2016. PMID: 27461237 Free PMC article.
-
Trends in advanced imaging and hospitalization for emergency department syncope care before and after ACEP clinical policy.Am J Emerg Med. 2019 Jun;37(6):1037-1043. doi: 10.1016/j.ajem.2018.08.043. Epub 2018 Aug 22. Am J Emerg Med. 2019. PMID: 30177266 Free PMC article.
-
Association Between US Physician Malpractice Claims Rates and Hospital Admission Rates Among Patients With Lower-Risk Syncope.JAMA Netw Open. 2020 Dec 1;3(12):e2025860. doi: 10.1001/jamanetworkopen.2020.25860. JAMA Netw Open. 2020. PMID: 33320263 Free PMC article.
-
Utilization due to chronic obstructive pulmonary disease and its predictors: a study using the U.S. National Emergency Department Sample (NEDS).Respir Res. 2016 Jan 6;17:1. doi: 10.1186/s12931-015-0319-y. Respir Res. 2016. PMID: 26739476 Free PMC article.
-
Incidence, admission rates, and economic burden of pediatric emergency department visits for urinary tract infection: data from the nationwide emergency department sample, 2006 to 2011.J Pediatr Urol. 2015 Oct;11(5):246.e1-8. doi: 10.1016/j.jpurol.2014.10.005. Epub 2015 Feb 7. J Pediatr Urol. 2015. PMID: 26005017
Cited by
-
Interhospital variability in hospital admissions for patients with low-risk syncope presenting to the emergency department.Heart Rhythm O2. 2024 Jun 18;5(7):435-442. doi: 10.1016/j.hroo.2024.06.006. eCollection 2024 Jul. Heart Rhythm O2. 2024. PMID: 39119025 Free PMC article.
-
Development of a Novel Emergency Department Quality Measure to Reduce Very Low-Risk Syncope Hospitalizations.Ann Emerg Med. 2022 Jun;79(6):509-517. doi: 10.1016/j.annemergmed.2022.03.008. Epub 2022 Apr 27. Ann Emerg Med. 2022. PMID: 35487840 Free PMC article.
References
-
- Toarta C, Mukarram M, Diercks D, et al. Syncope Prognosis Based on Emergency Department Diagnosis: A Prospective Cohort Study. Academic Emergency Medicine (AEM)[serial online]. April 1, 2018;25(4):388–396. - PubMed
MeSH terms
Grants and funding
LinkOut - more resources
Full Text Sources
Other Literature Sources
Medical
