

Investigating connections between COVID-19 pandemic, air pollution and community interventions for Pakistan employing geoinformation technologies
- PMID: 33582510
- PMCID: PMC7846247
- DOI: 10.1016/j.chemosphere.2021.129809
Investigating connections between COVID-19 pandemic, air pollution and community interventions for Pakistan employing geoinformation technologies
Abstract
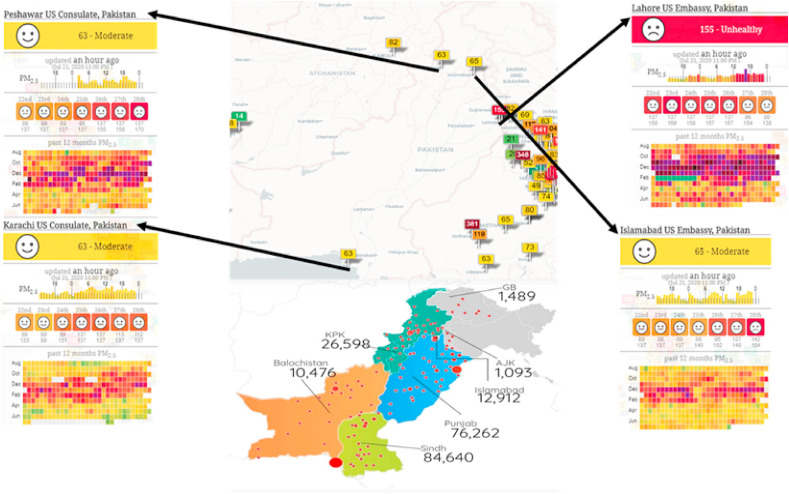
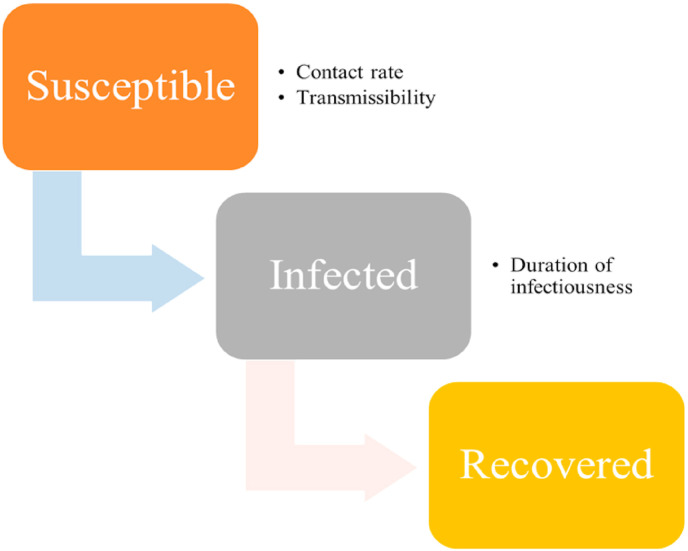
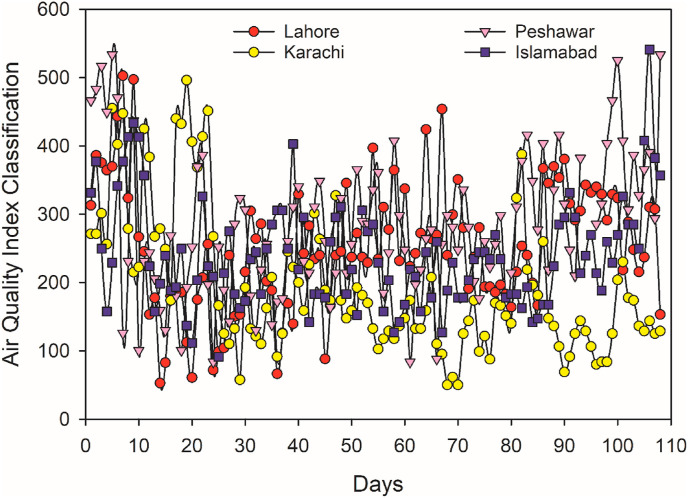
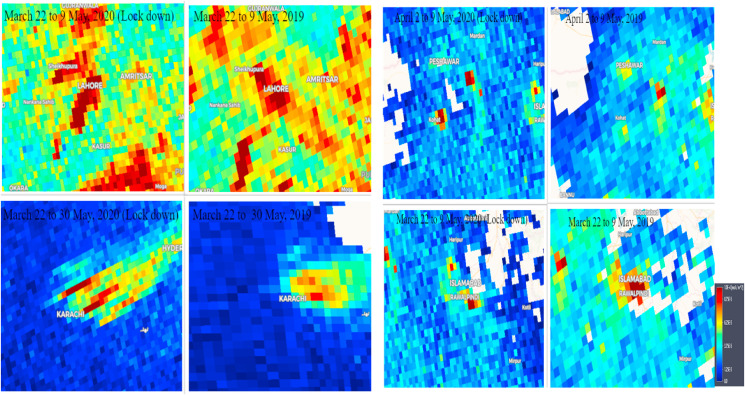
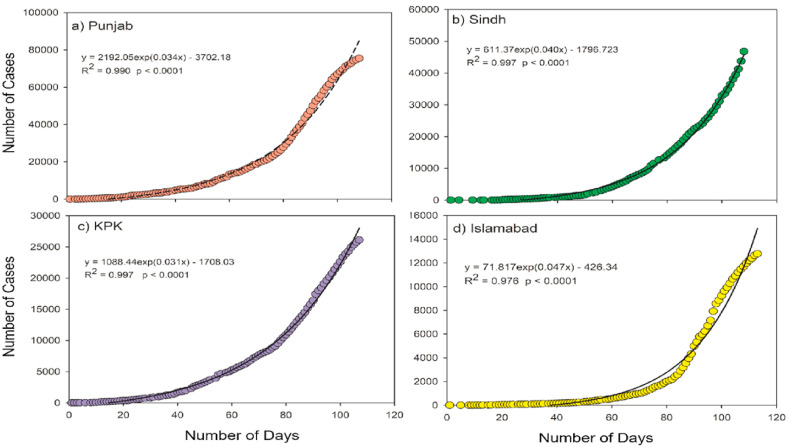
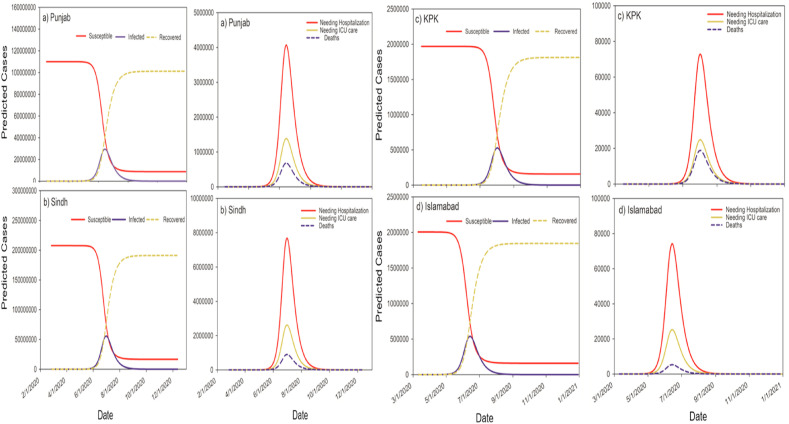
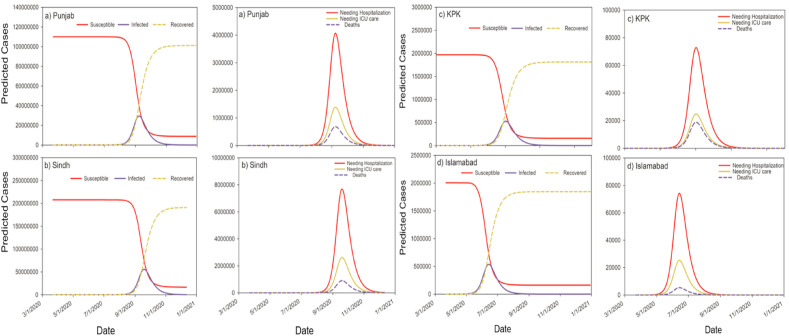
Several major cities that witnessed heavy air pollution by particulate matter (PM2.5) concentration and nitrogen dioxide (NO2) have contributed to high rate of infection and severity of the coronavirus disease (COVID-19) pandemic. Owing to the negative impact of COVID-19 on health and economy, it is imperative to predict the pandemic trend of the COVID-19 outbreak. Pakistan is one of the mostly affected countries by recent COVID-19 pandemic in terms of COVID-cases and economic crises. Like other several Asian countries to combat the virus impacts, Pakistan implemented non-pharmacological interventions (NPI), such as national lockdowns. The current study investigates the effect of major interventions across three out of four provinces of Pakistan for the period from the start of the COVID-19 in March 22, 2020 until June 30, 2020, when lockdowns were started to be eased. High-resolution data on NO2 was recorded from Sentinel-5's Precursor spacecraft with TROPOspheric Monitoring Instrument (Sentinel-5P TROPOMI). Similarly, PM2.5 data were collected from sampling sties to investigate possible correlation among these pollutants and COVID-19. In addition, growth and susceptible-infected-recovered (SIR) models utilizing time-series data of COVID-19 from February 26 to December 31, 2020, with- and without NPI that encompass the predicted number of infected cases, peak time, impact on the healthcare system and mortality in Pakistan. Maximum mean PM2.5 concentration of 108 μgm-3 was recorded for Lahore with the range from 51 to 215 μgm-3, during strict lockdown (L), condition. This is three times higher than Pak-EPA and US-EPA and four times for WHO guidelines, followed by Peshawar (97.2 and 58 ± 130), Islamabad (83 and 158 ± 58), and Karachi (78 and 50 ± 140). The majority of sampling sites in Lahore showed NO2 levels higher than 8.75E-5 (mol/m2) in 2020 compared to 2019 during "L" period. The susceptible-infected-recovered (SIR) model depicted a strong correlation (r) between the predicted and reported cases for Punjab (r = 0.79), Sindh (r = 0.91), Khyber Pakhtunkhwa (KPK) (r = 94) and Islamabad (r = 0.85). Findings showed that major NPI and lockdowns especially have had a large effect on minimizing transmission. Continued community intervention should be undertaken to keep transmission of SARS-CoV-2 under control in cities where higher incidence of COVID-19 cases until the vaccine is available. This study provides a methodological framework that if adopted can assist epidemiologist and policy makers to be well-prepared in advance in cities where PM2.5 concentration and NO2 levels are already high in order to minimize the potential risk of further spread of COVID-19 cases.
Keywords: COVID-19; Community interventions; Geoinformation; NO(2); PM(2.5); Pakistan; SIR model; Sentinel-5.
Copyright © 2021 Elsevier Ltd. All rights reserved.
Conflict of interest statement
Declaration of competing interest The authors declare that they have no known competing financial interests or personal relationships that could have appeared to influence the work reported in this paper.
Figures
Similar articles
-
Spatiotemporal variability of COVID-19 pandemic in relation to air pollution, climate and socioeconomic factors in Pakistan.Chemosphere. 2021 May;271:129584. doi: 10.1016/j.chemosphere.2021.129584. Epub 2021 Jan 10. Chemosphere. 2021. PMID: 33482526 Free PMC article.
-
Public health in Global South: effect of environmental pollutant PM2.5 on the incidence and mortality of SARS-CoV-2 in Karachi, Lahore, and Islamabad.Eur Rev Med Pharmacol Sci. 2022 Dec;26(23):9054-9060. doi: 10.26355/eurrev_202212_30581. Eur Rev Med Pharmacol Sci. 2022. PMID: 36524525
-
Exploring the linkage between PM2.5 levels and COVID-19 spread and its implications for socio-economic circles.Environ Res. 2021 Feb;193:110421. doi: 10.1016/j.envres.2020.110421. Epub 2020 Nov 6. Environ Res. 2021. PMID: 33160973 Free PMC article.
-
In-depth analysis of ambient air pollution changes due to the COVID-19 pandemic in the Asian Monsoon region.Sci Total Environ. 2024 Sep 1;941:173145. doi: 10.1016/j.scitotenv.2024.173145. Epub 2024 May 18. Sci Total Environ. 2024. PMID: 38768732 Review.
-
Geospatial analysis of COVID-19 lockdown effects on air quality in the South and Southeast Asian region.Sci Total Environ. 2021 Feb 20;756:144009. doi: 10.1016/j.scitotenv.2020.144009. Epub 2020 Nov 21. Sci Total Environ. 2021. PMID: 33250248 Free PMC article.
Cited by
-
Lockdown Amid COVID-19 Ascendancy over Ambient Particulate Matter Pollution Anomaly.Int J Environ Res Public Health. 2022 Oct 19;19(20):13540. doi: 10.3390/ijerph192013540. Int J Environ Res Public Health. 2022. PMID: 36294120 Free PMC article. Review.
-
Impacts of Covid-19 interventions on air quality: evidence from Brazilian metropolitan regions.Int J Environ Sci Technol (Tehran). 2023;20(3):2797-2818. doi: 10.1007/s13762-022-04189-6. Epub 2022 May 3. Int J Environ Sci Technol (Tehran). 2023. PMID: 35529589 Free PMC article.
-
Changes in temporal pattern and spatial distribution of environmental pollutants in 8 Asian countries owing to COVID-19 pandemic.Chemosphere. 2022 Dec;308(Pt 1):136075. doi: 10.1016/j.chemosphere.2022.136075. Epub 2022 Aug 22. Chemosphere. 2022. PMID: 36007741 Free PMC article.
-
Global trends and future prospects of COVID-19 and physical activity: Bibliometric analysis.Medicine (Baltimore). 2023 Sep 29;102(39):e35316. doi: 10.1097/MD.0000000000035316. Medicine (Baltimore). 2023. PMID: 37773796 Free PMC article.
-
"SARS-CoV-2 is transmitted by particulate air pollution": Misinterpretations of statistical data, skewed citation practices, and misuse of specific terminology spreading the misconception.Environ Res. 2022 Mar;204(Pt B):112116. doi: 10.1016/j.envres.2021.112116. Epub 2021 Sep 22. Environ Res. 2022. PMID: 34562486 Free PMC article.
References
-
- Aslam B., Khalil U., Azam U., Maqsoom A. A correlation study between weather and atmosphere with COVID-19 pandemic in Islamabad, Pakistan. Spat. Inf. Res. 2020 doi: 10.1007/s41324-020-00366-2. - DOI
-
- Z L., Ahmad S.S., Syed W.A.A. Temporal variations in nitrogen dioxide concentration due to vehicular emissions in Islamabad capital territory (ICT) & Rawalpindi. Sci. Int. 2013;24:265–268.
MeSH terms
Substances
LinkOut - more resources
Full Text Sources
Other Literature Sources
Medical
Research Materials
Miscellaneous
