. 2021 May;89(5):987-1000.
doi: 10.1002/ana.26048. Epub 2021 Mar 4.

Onset of Preclinical Alzheimer Disease in Monozygotic Twins

Affiliations

Onset of Preclinical Alzheimer Disease in Monozygotic Twins

Elles Konijnenberg et al. Ann Neurol. 2021 May.

Abstract

Objective: The present work was undertaken to study the genetic contribution to the start of Alzheimer's disease (AD) with amyloid and tau biomarkers in cognitively intact older identical twins.

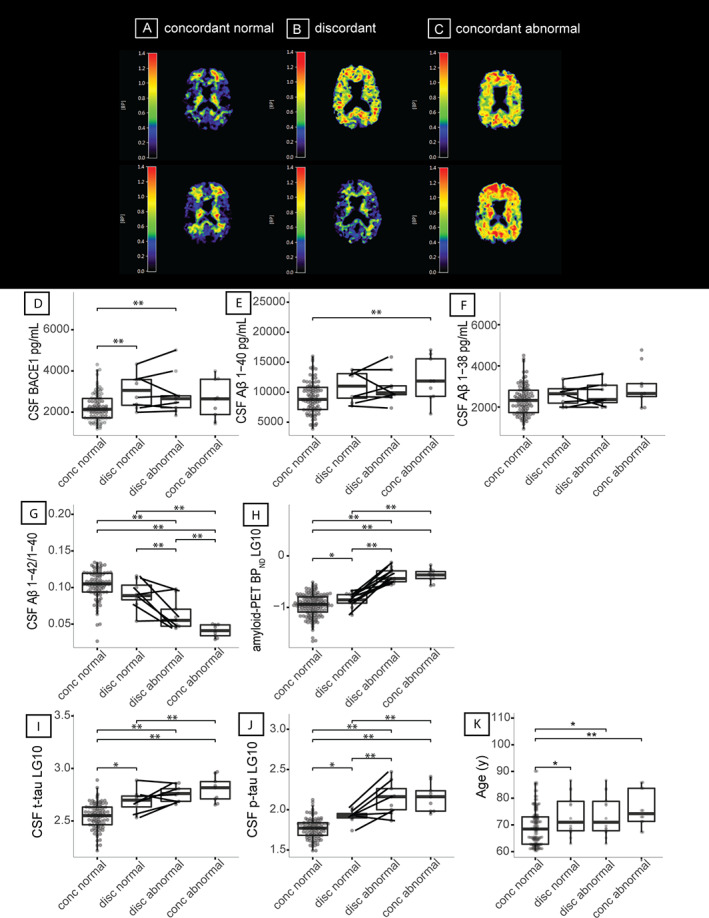
Methods: We studied in 96 monozygotic twin-pairs relationships between amyloid-beta (Aβ) aggregation as measured by the Aβ1-42/1-40 ratio in cerebrospinal fluid (CSF; n = 126) and positron emission tomography (PET, n = 194), and CSF markers for Aβ production (beta-secretase 1, Aβ1-40, and Aβ1-38) and CSF tau. Associations among markers were tested with generalized estimating equations including a random effect for twin status, adjusted for age, gender, and apolipoprotein E ε4 genotype. We used twin analyses to determine relative contributions of genetic and/or environmental factors to AD pathophysiological processes.

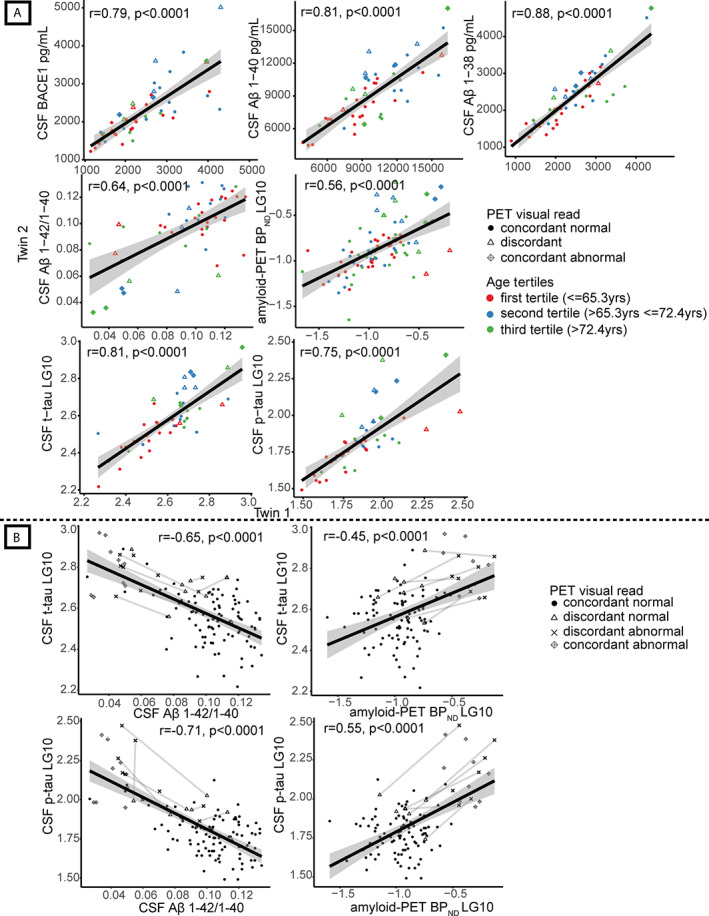
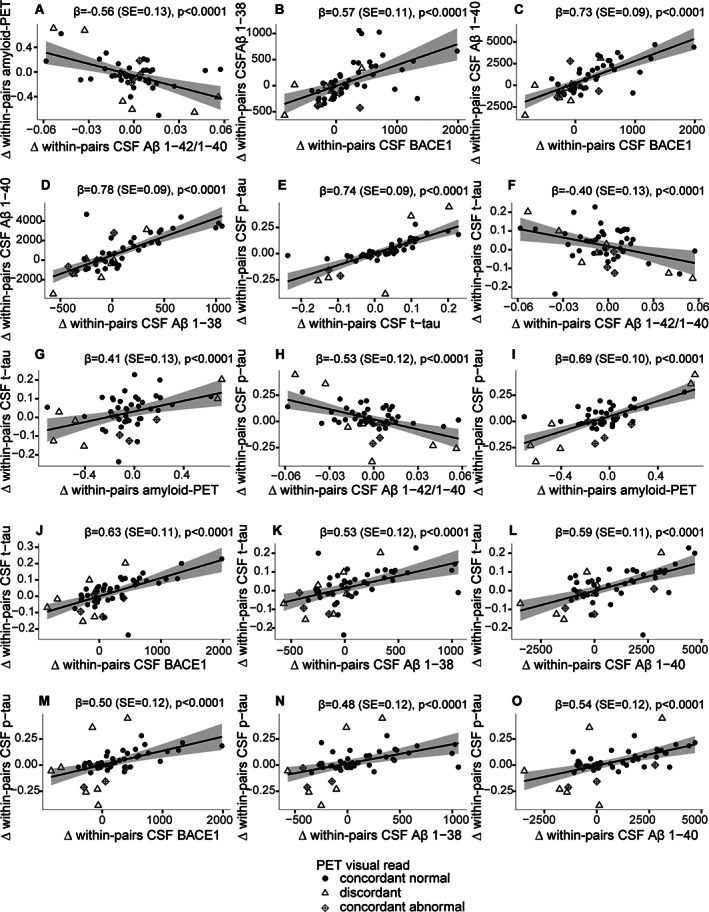
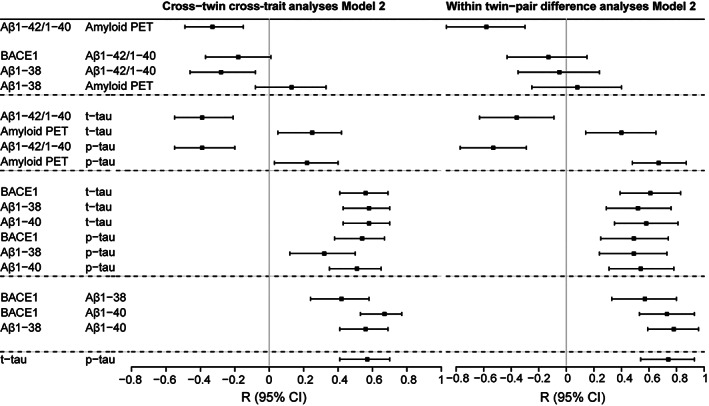
Results: Twenty-seven individuals (14%) had an abnormal amyloid PET, and 14 twin-pairs (15%) showed discordant amyloid PET scans. Within twin-pairs, Aβ production markers and total-tau (t-tau) levels strongly correlated (r range = 0.73-0.86, all p < 0.0001), and Aβ aggregation markers and 181-phosphorylated-tau (p-tau) levels correlated moderately strongly (r range = 0.50-0.64, all p < 0.0001). Cross-twin cross-trait analysis showed that Aβ1-38 in one twin correlated with Aβ1-42/1-40 ratios, and t-tau and p-tau levels in their cotwins (r range = -0.28 to 0.58, all p < .007). Within-pair differences in Aβ production markers related to differences in tau levels (r range = 0.49-0.61, all p < 0.0001). Twin discordance analyses suggest that Aβ production and tau levels show coordinated increases in very early AD.

Interpretation: Our results suggest a substantial genetic/shared environmental background contributes to both Aβ and tau increases, suggesting that modulation of environmental risk factors may aid in delaying the onset of AD pathophysiological processes. ANN NEUROL 2021;89:987-1000.


Conflict of interest statement

H.V. is the founder and director of Biomarkable and he is a cofounder of ADx NeuroSciences, where he worked as a consultant through Biomarkable. H.V. has shares in both companies. ADx NeuroSciences provided the enzyme‐linked immunosorbent assays used in this study. The other authors have nothing to report.

Figures

FIGURE 1
FIGURE 1
Patterns of amyloid production, amyloid aggregation, and tau for twin discordance and box plots for age and twin discordance. (A–C) [18F]Flutemetamol positron emission tomography (PET) images from a concordant twin‐pair with a normal scan (A), a discordant pair (B), and a concordant pair with an abnormal scan (C). (D–K) Box plots show beta‐secretase 1 (BACE1; D), amyloid‐beta (Aβ) 1–40 (E), Aβ1–38 (F), Aβ1–42/1–40 ratio (G), global cortical PET binding (nondisplaceable binding potential [BPND]) (H), total‐tau (t‐tau; I), 181‐phosphorylated‐tau (p‐tau; J), and age in years (K) for twins who both have a normal amyloid PET visual read (concordant normal, n = 148, of whom 93 have cerebrospinal fluid [CSF] markers), twins from a discordant pair with a normal amyloid PET visual read (discordant normal, n = 14, of whom 8 have CSF markers), twins from a discordant pair with abnormal amyloid PET visual read (discordant abnormal, n = 14, of whom 9 have CSF markers), and twin‐pairs who both have an abnormal amyloid PET vsiual read (concordant abnormal, n = 12, of whom 9 have CSF markers). Discordant twin‐pairs are connected with lines. All analyses for group comparisons were corrected for age, gender, and apolipoprotein E ε4 genotype. *p < 0.05; **p < 0.01. BPND = nondisplaceablebinding potential; conc = concordant; disc = discordant; LG10 = log‐transformed data.
FIGURE 2
FIGURE 2
Monozygotic twin‐pair correlations and correlations in amyloid‐beta (Aβ) and tau levels, with discordant pairs connected. (A) Pearson correlation values for association of amyloid markers between one twin and their cotwin (Model 1); all p < 0.0001. Absolute values are shown for cerebrospinal fluid (CSF) beta‐secretase 1 (BACE1), Aβ1–40, Aβ1–38, Aβ1–42/1–40 ratio, and log‐transformed data (LG10) for global cortical positron emission tomography (PET) binding (nondisplaceable binding potential [BPND]) and CSF total‐tau (t‐tau) and 181‐phosphorylated‐tau (p‐tau). Each dot represents one twin‐pair; twin‐pairs who are concordant normal on amyloid PET visual read are shown as dots, and twin‐pairs who are concordant abnormal on amyloid PET visual read are shown as diamonds with a cross inside. Discordant pairs on amyloid PET visual read are shown as open triangles. Age‐groups based on tertiles (60–65.3, 65.3–72.4, >72.4 years) are represented in colors. From left to right: CSF BACE1, CSF Aβ1–40, CSF Aβ1–38, CSF Aβ1–42/1–40 ratio, global cortical PET binding (BPND), CSF t‐tau, CSF p‐tau. (B) Correlations of CSF Aβ1–42/1–40 ratio and CSF t‐tau; global cortical amyloid PET binding (BPND) and CSF t‐tau; CSF Aβ1–42/1–40 ratio and CSF p‐tau; and global cortical amyloid PET binding (BPND) and CSF p‐tau for twins who both have a normal amyloid PET visual read (concordant normal, shown as dots), twins from a discordant pair with a normal amyloid PET visual read (discordant normal, shown as open triangles), twins from a discordant pair with abnormal amyloid PET visual read (discordant abnormal, shown as crosses), and twin‐pairs who both have an abnormal amyloid PET visual read (concordant abnormal, shown as diamonds with a cross inside). Discordant twin‐pairs are connected with lines. LG10 = log‐transformed data.
FIGURE 3
FIGURE 3
Monozygotic within‐pair difference associations between amyloid aggregation markers, amyloid production markers, and tau. Within‐pair differences of (A) cerebrospinal fluid (CSF) amyloid‐beta (Aβ) 1–42/1–40 ratio with global cortical positron emission tomography (PET) binding (nondisplaceable binding potential [BPND]), (B) CSF beta‐secretase 1 (BACE1) with CSF Aβ1–38, (C) CSF BACE1 with CSF Aβ1–40, (D) CSF Aβ1–38 with CSF Aβ1–40, (E) CSF total‐tau (t‐tau) with CSF 181‐phosphorylated‐tau (p‐tau), (F) CSF Aβ1–42/1–40 ratio with CSF t‐tau, (G) global cortical PET binding (BPND) with CSF t‐tau, (H) CSF Aβ1–42/1–40 ratio with CSF p‐tau, (I) global cortical PET binding (BPND) with CSF p‐tau, (J) CSF BACE1 with CSF t‐tau, (K) CSF Aβ1–38 with CSF t‐tau, (L) CSF Aβ1–40 with CSF t‐tau, (M) CSF BACE1 with CSF p‐tau, (N) CSF Aβ1–38 with CSF p‐tau, (O) CSF Aβ1–40 with CSF p‐tau. Each dot represents one twin‐pair; twin‐pairs who are concordant normal on amyloid PET visual read are shown as black dots, and twin‐pairs who are concordant abnormal on amyloid PET visual read are shown as diamonds with a cross inside. Discordant pairs on amyloid PET visual read are shown as open triangles. Lower CSF Aβ1–42/1–40 ratio and higher global cortical PET binding indicate more amyloid aggregation. SE = standard error.
FIGURE 4
FIGURE 4
Forest plot of cross‐twin cross‐trait and within–twin‐pair difference analyses. For cross‐twin cross‐trait analyses, data are displayed as correlation coefficient (standard error), comparable to standardized betas given in generalized estimating equations results. Calculated residuals adjusted for age, apolipoprotein E (APOE) ε4, and gender (Model 2). Correlation coefficient indicates the correlation of the production marker in one twin with the aggregation marker in their cotwin. Cross‐twin cross‐trait analyses are shown for variables that had a statistically significant association in the whole cohort (see Table 3). For within–twin‐pair difference analyses, linear regression results are shown for the relation between the standardized difference scores (z scores) within a twin‐pair per amyloid marker adjusted for age, APOE ε4, and gender (Model 2). Beta indicates the association between the within‐pair difference in the production marker and the within‐pair difference in the aggregation marker. Within‐pair difference analyses are shown for variables that had a statistically significant association in the whole cohort (see Table 3). For exact numbers, see Supplementary Table S1. Aβ = amyloid‐beta; Aβ1–38 = CSF Aβ1–38; Aβ1–40 = CSF Aβ1–40; Aβ1–42/1–40 = CSF Aβ1–42/1–40 ratio; Amyloid PET = positron emission tomography global [18F]flutemetamol binding; BACE1 = beta‐secretase 1; CI = confidence interval; CSF = cerebrospinal fluid; p‐tau = CSF 181‐phosphorylated‐tau; t‐tau = CSF total‐tau.

References

    1. Jansen WJ, Ossenkoppele R, Knol DL, et al. Prevalence of cerebral amyloid pathology in persons without dementia: a meta‐analysis. JAMA 2015;313:1924–1938. - PMC - PubMed
    1. Sato C, Barthélemy NR, Mawuenyega KG, et al. Tau kinetics in neurons and the human central nervous system. Neuron 2018;97:1284–1298. - PMC - PubMed
    1. Gatz M, Reynolds CA, Fratiglioni L, et al. Role of genes and environments for explaining Alzheimer disease. Arch Gen Psychiatry 2006;63:168–174. - PubMed
    1. Johansson V, Jakobsson J, Fortgang RG, et al. Cerebrospinal fluid microglia and neurodegenerative markers in twins concordant and discordant for psychotic disorders. Eur Arch Psychiatry Clin Neurosci 2017;267:391–402. - PMC - PubMed
    1. Mawuenyega KG, Sigurdson W, Ovod V, et al. Decreased clearance of CNS β‐amyloid in Alzheimer's disease. Science 2010;330:1774. - PMC - PubMed

Publication types

MeSH terms