

Ensemble bootstrap methodology for forecasting dynamic growth processes using differential equations: application to epidemic outbreaks
- PMID: 33583405
- PMCID: PMC7882252
- DOI: 10.1186/s12874-021-01226-9
Ensemble bootstrap methodology for forecasting dynamic growth processes using differential equations: application to epidemic outbreaks
Abstract
Background: Ensemble modeling aims to boost the forecasting performance by systematically integrating the predictive accuracy across individual models. Here we introduce a simple-yet-powerful ensemble methodology for forecasting the trajectory of dynamic growth processes that are defined by a system of non-linear differential equations with applications to infectious disease spread.
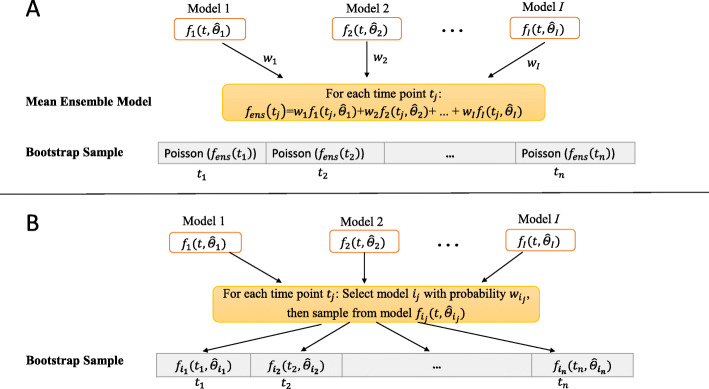
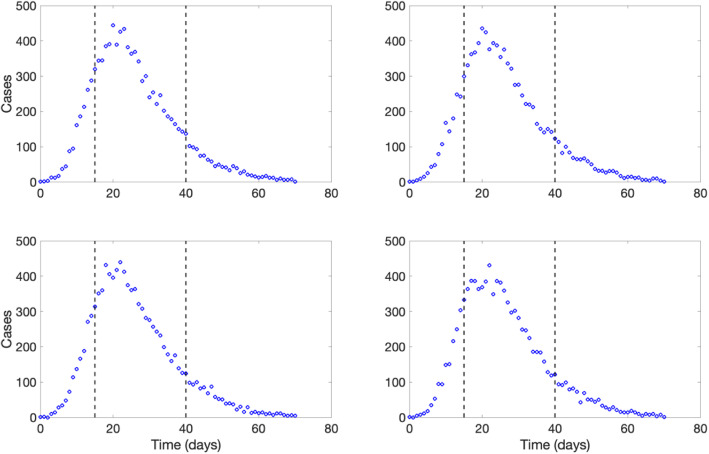
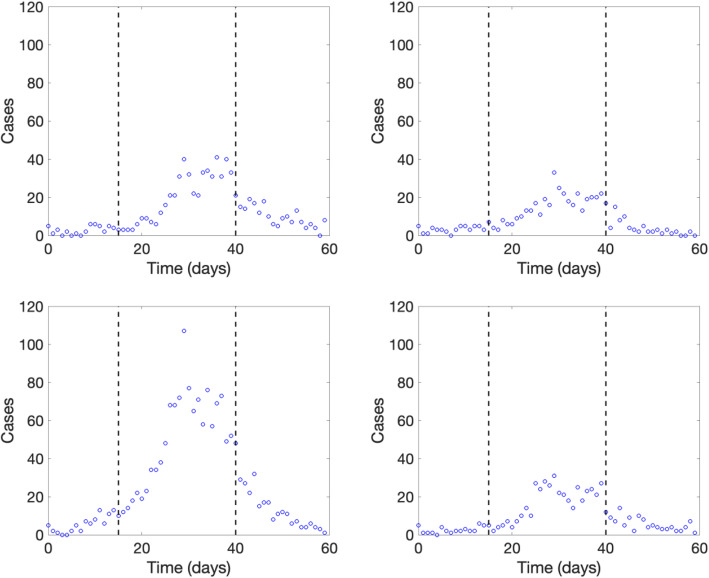
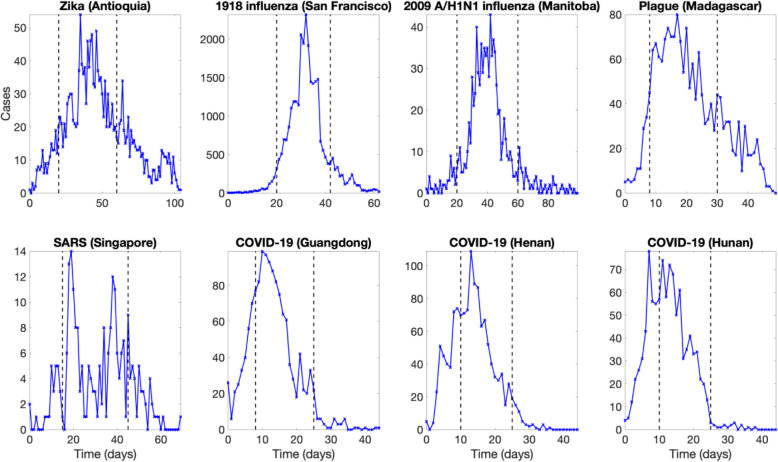
Methods: We propose and assess the performance of two ensemble modeling schemes with different parametric bootstrapping procedures for trajectory forecasting and uncertainty quantification. Specifically, we conduct sequential probabilistic forecasts to evaluate their forecasting performance using simple dynamical growth models with good track records including the Richards model, the generalized-logistic growth model, and the Gompertz model. We first test and verify the functionality of the method using simulated data from phenomenological models and a mechanistic transmission model. Next, the performance of the method is demonstrated using a diversity of epidemic datasets including scenario outbreak data of the Ebola Forecasting Challenge and real-world epidemic data outbreaks of including influenza, plague, Zika, and COVID-19.
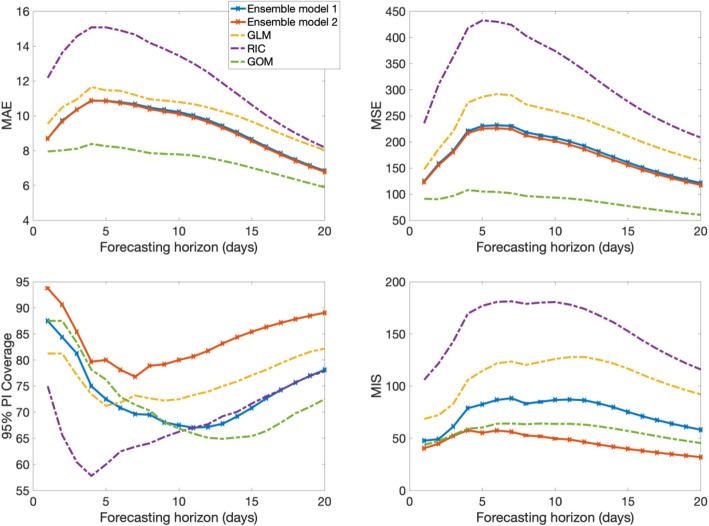
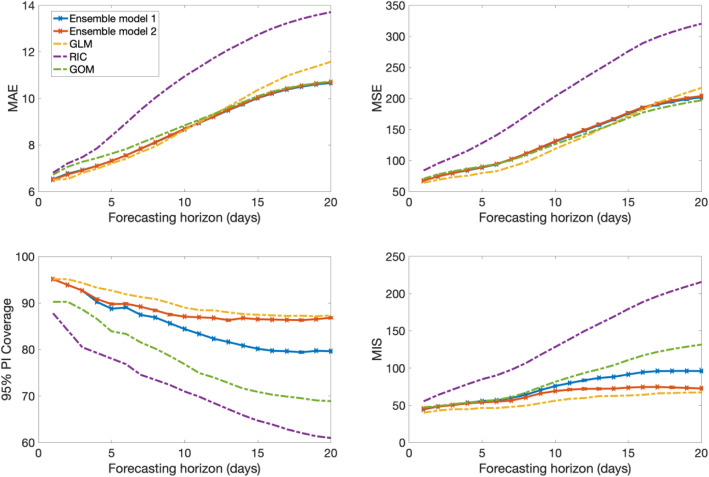
Results: We found that the ensemble method that randomly selects a model from the set of individual models for each time point of the trajectory of the epidemic frequently outcompeted the individual models as well as an alternative ensemble method based on the weighted combination of the individual models and yields broader and more realistic uncertainty bounds for the trajectory envelope, achieving not only better coverage rate of the 95% prediction interval but also improved mean interval scores across a diversity of epidemic datasets.
Conclusion: Our new methodology for ensemble forecasting outcompete component models and an alternative ensemble model that differ in how the variance is evaluated for the generation of the prediction intervals of the forecasts.
Keywords: Differential equations; Generalized logistic growth model; Gompertz model; Interval score; Model ensemble, parameter estimation, uncertainty quantification, phenomenological growth; Parametric bootstrapping; Richards model.
Conflict of interest statement
None.
Figures


Similar articles
-
SpatialWavePredict: a tutorial-based primer and toolbox for forecasting growth trajectories using the ensemble spatial wave sub-epidemic modeling framework.BMC Med Res Methodol. 2024 Jun 7;24(1):131. doi: 10.1186/s12874-024-02241-2. BMC Med Res Methodol. 2024. PMID: 38849766 Free PMC article.
-
Real-time forecasting of epidemic trajectories using computational dynamic ensembles.Epidemics. 2020 Mar;30:100379. doi: 10.1016/j.epidem.2019.100379. Epub 2019 Dec 21. Epidemics. 2020. PMID: 31887571
-
Using phenomenological models for forecasting the 2015 Ebola challenge.Epidemics. 2018 Mar;22:62-70. doi: 10.1016/j.epidem.2016.11.002. Epub 2016 Nov 19. Epidemics. 2018. PMID: 27913131
-
Investigating and forecasting infectious disease dynamics using epidemiological and molecular surveillance data.Phys Life Rev. 2024 Dec;51:294-327. doi: 10.1016/j.plrev.2024.10.011. Epub 2024 Oct 24. Phys Life Rev. 2024. PMID: 39488136 Review.
-
Application progress of ensemble forecast technology in influenza forecast based on infectious disease model.Front Public Health. 2023 Dec 15;11:1335499. doi: 10.3389/fpubh.2023.1335499. eCollection 2023. Front Public Health. 2023. PMID: 38162616 Free PMC article. Review.
Cited by
-
Prediction intervals of the COVID-19 cases by HAR models with growth rates and vaccination rates in top eight affected countries: Bootstrap improvement.Chaos Solitons Fractals. 2022 Feb;155:111789. doi: 10.1016/j.chaos.2021.111789. Epub 2022 Jan 3. Chaos Solitons Fractals. 2022. PMID: 35002103 Free PMC article.
-
Machine learning techniques to predict different levels of hospital care of CoVid-19.Appl Intell (Dordr). 2022;52(6):6413-6431. doi: 10.1007/s10489-021-02743-2. Epub 2021 Sep 10. Appl Intell (Dordr). 2022. PMID: 34764619 Free PMC article.
-
An ensemble n-sub-epidemic modeling framework for short-term forecasting epidemic trajectories: Application to the COVID-19 pandemic in the USA.PLoS Comput Biol. 2022 Oct 6;18(10):e1010602. doi: 10.1371/journal.pcbi.1010602. eCollection 2022 Oct. PLoS Comput Biol. 2022. PMID: 36201534 Free PMC article.
-
SubEpiPredict: A tutorial-based primer and toolbox for fitting and forecasting growth trajectories using the ensemble n-sub-epidemic modeling framework.Infect Dis Model. 2024 Feb 9;9(2):411-436. doi: 10.1016/j.idm.2024.02.001. eCollection 2024 Jun. Infect Dis Model. 2024. PMID: 38385022 Free PMC article.
-
Controlling Multiple COVID-19 Epidemic Waves: An Insight from a Multi-scale Model Linking the Behaviour Change Dynamics to the Disease Transmission Dynamics.Bull Math Biol. 2022 Aug 25;84(10):106. doi: 10.1007/s11538-022-01061-z. Bull Math Biol. 2022. PMID: 36008498 Free PMC article.
References
MeSH terms
LinkOut - more resources
Full Text Sources
Other Literature Sources
