. 2021:30:102569.
doi: 10.1016/j.nicl.2021.102569. Epub 2021 Jan 19.

EEG measures of sensorimotor processing and their development are abnormal in children with isolated dystonia and dystonic cerebral palsy

Affiliations

EEG measures of sensorimotor processing and their development are abnormal in children with isolated dystonia and dystonic cerebral palsy

Verity M McClelland et al. Neuroimage Clin. 2021.

Abstract

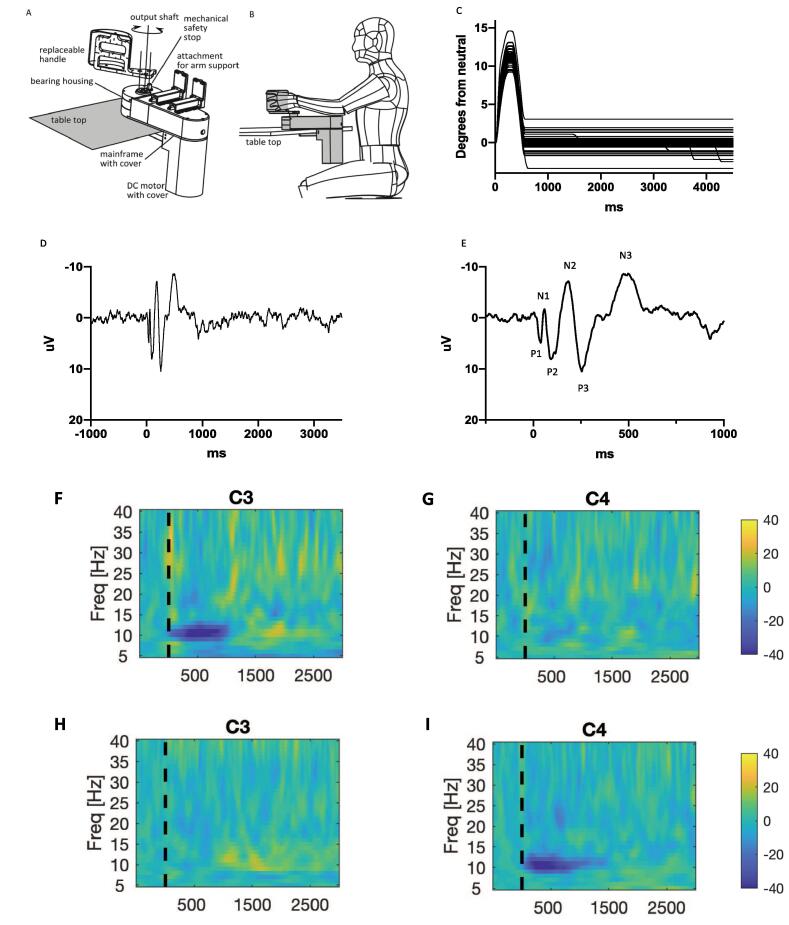
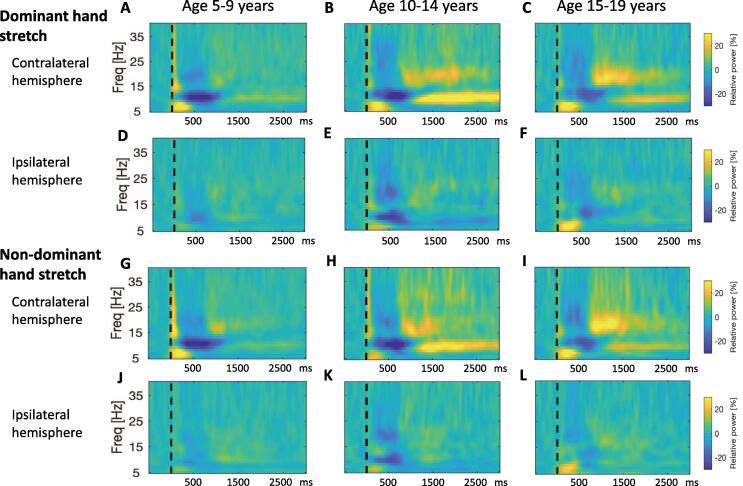
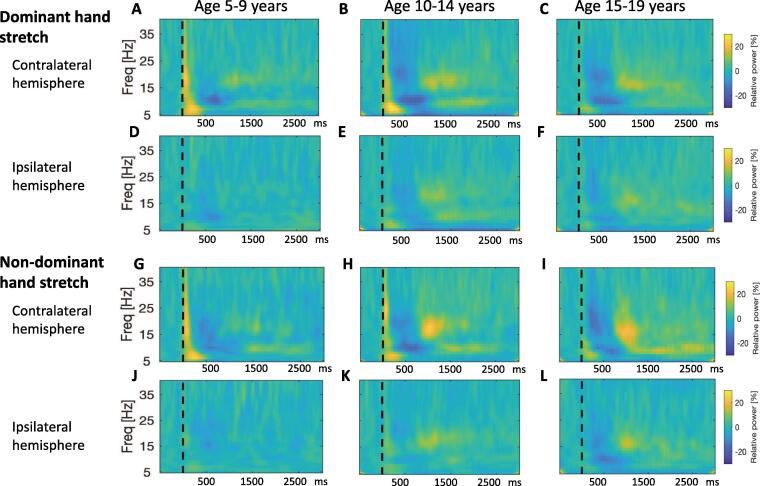
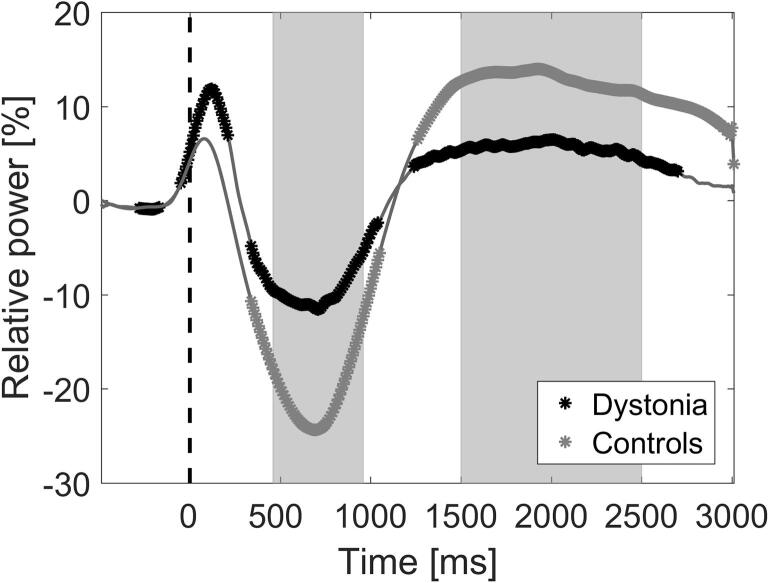
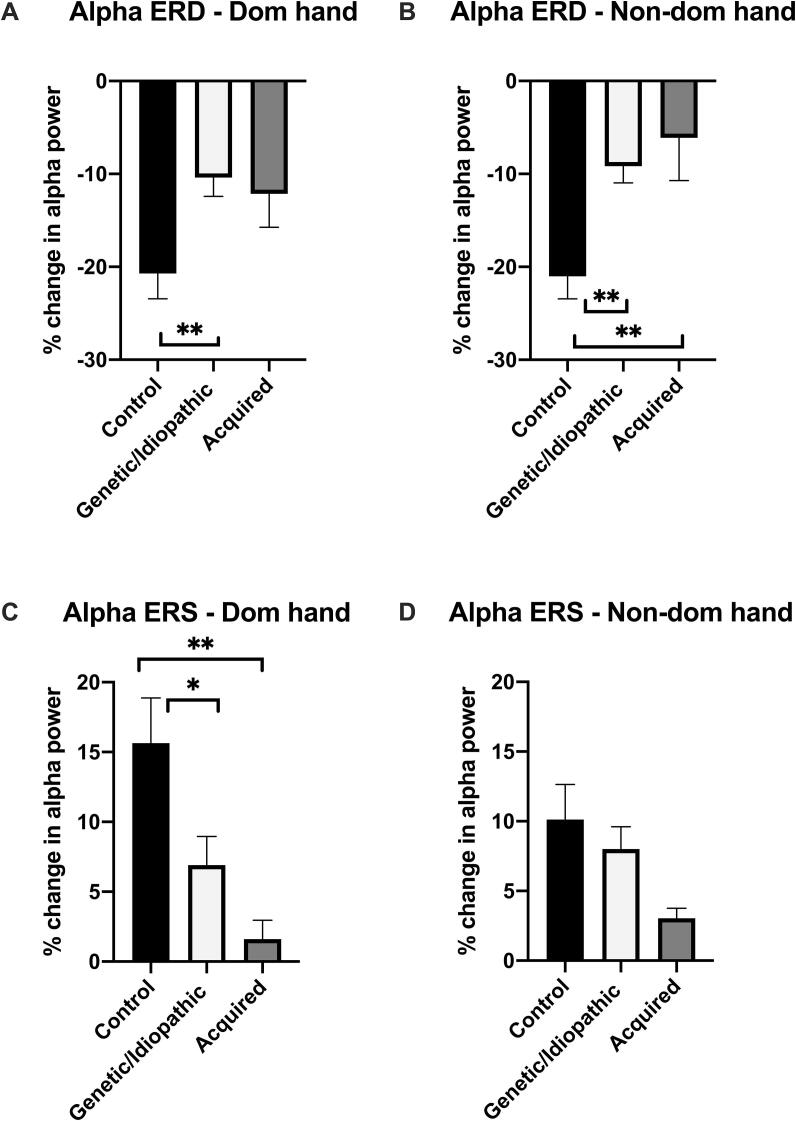
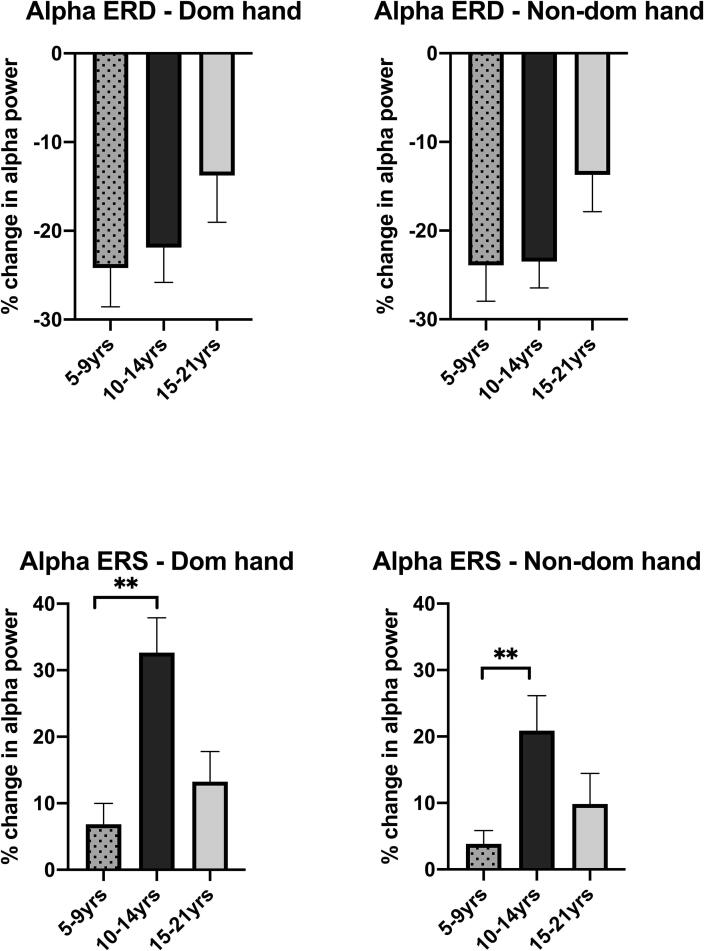
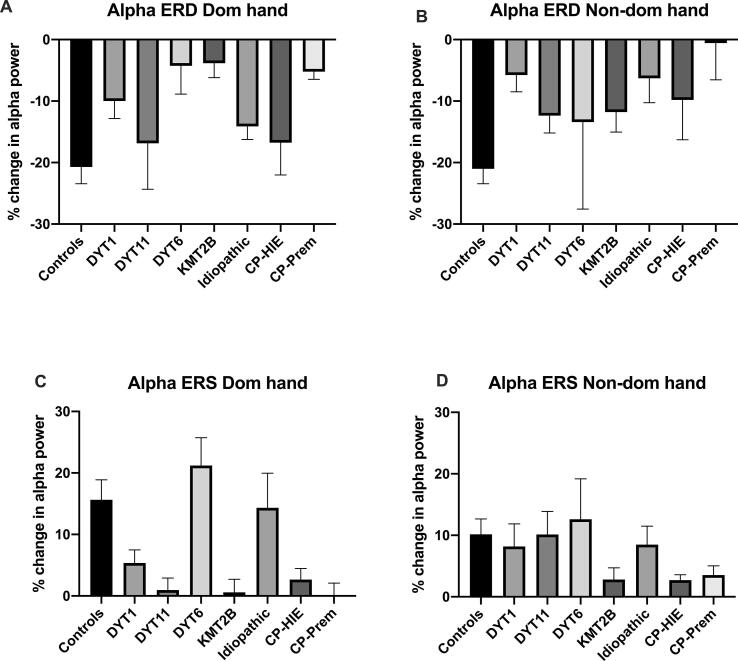
Dystonia is a disorder of sensorimotor integration associated with abnormal oscillatory activity within the basal ganglia-thalamo-cortical networks. Event-related changes in spectral EEG activity reflect cortical processing but are sparsely investigated in relation to sensorimotor processing in dystonia. This study investigates modulation of sensorimotor cortex EEG activity in response to a proprioceptive stimulus in children with dystonia and dystonic cerebral palsy (CP). Proprioceptive stimuli, comprising brief stretches of the wrist flexors, were delivered via a robotic wrist interface to 30 young people with dystonia (20 isolated genetic/idiopathic and 10 dystonic CP) and 22 controls (mean age 12.7 years). Scalp EEG was recorded using the 10-20 international system and the relative change in post-stimulus power with respect to baseline was calculated for the alpha (8-12 Hz) and beta (14-30 Hz) frequency bands. A clear developmental profile in event-related spectral changes was seen in controls. Controls showed a prominent early alpha/mu band event-related desynchronisation (ERD) followed by an event-related synchronisation (ERS) over the contralateral sensorimotor cortex following movement of either hand. The alpha ERD was significantly smaller in the dystonia groups for both dominant and non-dominant hand movement (ANCOVA across the 3 groups with age as covariate: dominant hand F(2,47) = 4.45 p = 0.017; non-dominant hand F(2,42) = 9.397 p < 0.001. Alpha ERS was significantly smaller in dystonia for the dominant hand (ANCOVA F(2,47) = 7.786 p = 0.001). There was no significant difference in ERD or ERS between genetic/idiopathic dystonia and dystonic CP. CONCLUSION: Modulation of alpha/mu activity by a proprioceptive stimulus is reduced in dystonia, demonstrating a developmental abnormality of sensorimotor processing which is common to isolated genetic/idiopathic and acquired dystonia/dystonic CP.

Keywords: Dystonia; Dystonic cerebral palsy; Event-related desynchronisation; Event-related synchronisation; Mu modulation; Sensorimotor integration.


Conflict of interest statement

Jean-Pierre Lin has received educational support and consultancy fees from Medtronic Ltd.

Peter Brown has also received consultancy fees from Medtronic Ltd.

Figures

Fig. 1
Fig. 1
Experimental paradigm and sample data Top row: Experimental set-up. A: Design overview of Portable Hi5 interface, which can be used with various handles and end effectors. B: User interacting with Hi5 attached to a table-top. Line drawings kindly provided by Ildar Farkhatdinov from (Sakellariou et al., 2020). C: Movement profile of wrist extension in degrees from neutral position over time (ms) in a single subject aged 8 years old. Each line shows the movement profile for an individual trial (N = 153 trials). D: Cortical evoked potential recorded over contralateral sensorimotor cortex in same subject as part C (in this case over C3 electrode during right wrist movement). Figure shows average of 139 epochs. E: Same as part D but with shorter time-scale to show the three positive and three negative primary components of the stretchEP. F-I. Time frequency plots from a single subject aged 6 years old. x-axis shows time in ms after the stimulus (dashed vertical line), y-axis shows frequency, colour scale shows relative power (%) at each frequency with respect to the pre-stimulus period such that dark blue indicates event-related desynchronisation and yellow-orange indicates event-related synchronization. F-G show results from right hand movement recorded over C3 (hemisphere contralateral to stretch) and C4 (hemisphere ipsilateral to stretch) respectively. H-I show results from left hand movement recorded over C3 (hemisphere ipsilateral to stretch) and C4 (hemisphere contralateral to stretch) respectively. (For interpretation of the references to colour in this figure legend, the reader is referred to the web version of this article.)
Fig. 2
Fig. 2
Developmental Sequence of event-related changes in EEG power in relation to a proprioceptive stimulus in typically developing children. Pooled time–frequency plots for control subjects, grouped by age. Left column: Young age group (5–9 years, n = 10), middle column: Intermediate age group (10–14 years, n = 6), right column: Older age group (15–21 years, n = 6). x-axis shows time in ms after the stimulus (dashed vertical line), y-axis shows frequency, colour scale shows relative power at each frequency with respect to the pre-stimulus period, such that dark blue indicates event-related desynchronisation and yellow-orange indicates event-related synchronization. A-C: Response over contralateral hemisphere to dominant hand stretch (ie right sensorimotor cortex for left hand movement, left sensorimotor cortex for right hand movement). D-F: Response over ipsilateral hemisphere to dominant hand stretch. G-I: Response over contralateral hemisphere to non-dominant hand stretch. J-L Response over ipsilateral hemisphere to non-dominant hand stretch. (Note the sharp increase in power with respect to baseline at time zero, extending up to 40 Hz, and the brief, early increase in theta range power from 0 to 300 ms are likely to reflect movement artefact and a contribution from the stretchEP, respectively). (For interpretation of the references to colour in this figure legend, the reader is referred to the web version of this article.)
Fig. 3
Fig. 3
Developmental Sequence of event-related changes in EEG power in relation to a proprioceptive stimulus in children with dystonia. Pooled time–frequency plots for individuals with dystonia, grouped by age: Left column: Young age group (5–9 years, n = 7), middle column: Intermediate age group (10–14 years, n = 11), right column: Older age group (15–21 years, n = 12). x-axis shows time in ms after the stimulus (dashed vertical line), y-axis shows frequency, colour scale shows relative power at each frequency with respect to the pre-stimulus period, such that dark blue indicates event-related desynchronisation and yellow-orange indicates event-related synchronization. A-C: Response over contralateral hemisphere to dominant hand stretch (ie right sensorimotor cortex for left hand movement, left sensorimotor cortex for right hand movement). D-F: Response over ipsilateral hemisphere to dominant hand stretch. G-I: Response over contralateral hemisphere to non-dominant hand stretch. J-L Response over ipsilateral hemisphere to non-dominant hand stretch. (Note for non-dominant hand, n = 9 for both intermediate and older age groups). (For interpretation of the references to colour in this figure legend, the reader is referred to the web version of this article.)
Fig. 4
Fig. 4
Time course of the event-related changes in the alpha range over contralateral sensorimotor cortex. Mean alpha (8–12 Hz) power at each time point as a percentage with respect to the baseline is shown separately for the dystonia and control groups. Points of significant departure from the baseline after false discovery rate correction for multiple comparisons are shown by black or grey* for dystonia and control groups respectively. The time windows for subsequent comparison between groups were derived to be centred around the peak ERD and ERS, as shown by shaded grey regions.
Fig. 5
Fig. 5
Comparison of contralateral hemisphere alpha ERD and alpha ERS between controls (n = 22), genetic/idiopathic dystonia (n = 20) and acquired dystonia (n = 10). Bars show mean + SEM of % change in alpha power over contralateral sensorimotor cortex (C3/C4) contralateral to the stretch in the defined time windows (0.3–0.8 s post stimulus for ERD and 1.5–2.5 s post-stimulus for ERS). The difference in mean levels of alpha ERD across groups is significant for the non-dominant hand (ANCOVA controlling for age and excursion: F(2,42) = 6.388, p = 0.004). The difference in mean levels of alpha ERS across groups is significant for the dominant hand (ANCOVA controlling for age and excursion: F(2,48) = 7.829, p = 0.001). Bars and asterisks show results of post-hoc comparisons, where these were significant *p < 0.05 ** p < 0.01 See text for absolute values.
Fig. 6
Fig. 6
Comparison of contralateral hemisphere alpha (812 Hz) ERD and alpha ERS across age-groups in typically developing children. Data are shown for the Young age group (5–9 years, n = 10), Intermediate age group (10–14 years, n = 6) and Older age group (15–21 years, n = 6). Bars show mean + SEM of % change in alpha power over sensorimotor cortex (C3/C4) contralateral to the stretch in the defined time windows (0.3–0.8 s post stimulus for ERD and 1.5–2.5 s post-stimulus for ERS). There was a significant difference across age groups for alpha ERS in response to both dominant and non-dominant hand stretch (ANCOVA F(2,18) = 6.144, p = 0.009 and F(2,18) = 6.064, p = 0.010 respectively). Bars and asterisks show results of post-hoc comparisons between young and intermediate age groups ** p < 0.01.
Fig. 7
Fig. 7
Comparison of alpha ERD and ERS across aetiological sub-groups. Comparison of alpha ERD (A and B) and alpha ERS (C and D) amplitudes between controls (n = 22) and aetiological sub-groups of dystonia: DYT1 (n = 6), DYT11 (n = 4), DYT6 (n = 2), KMT2B (n = 4), Idiopathic (n = 4), Dystonic Cerebral palsy due to term hypoxic ischaemic encephalopathy (CP-HIE) (n = 6 for dominant hand and n = 3 for non-dominant hand) and Dystonic Cerebral palsy due to prematurity (CP-Prem) (n = 4 for dominant hand and n = 2 for non-dominant hand). Bars show mean + SEM of % change in alpha power over contralateral sensorimotor cortex (C3/C4) in the defined time windows (0.3–0.8 s post stimulus for ERD and 1.5–2.5 s post-stimulus for ERS). Results of exploratory statistical analyses of sub-groups are reported in the supplementary information (Suppl Table S10).

Similar articles

Cited by

References

    1. Corp D.T., Joutsa J., Darby R.R. Network localization of cervical dystonia based on causal brain lesions. Brain. 2019;142:1660–1674. - PMC - PubMed
    1. Neychev V.K., Gross R.E., Lehericy S., Hess E.J., Jinnah H.A. The functional neuroanatomy of dystonia. Neurobiol. Dis. 2011;42:185–201. - PMC - PubMed
    1. Tinazzi M., Priori A., Bertolasi L., Frasson E., Mauguiere F., Fiaschi A. Abnormal central integration of a dual somatosensory input in dystonia. Evidence for sensory overflow. Brain. 2000;123(Pt 1):42–50. - PubMed
    1. Frasson E., Priori A., Bertolasi L., Mauguiere F., Fiaschi A., Tinazzi M. Somatosensory disinhibition in dystonia. Mov. Disord. 2001;16:674–682. - PubMed
    1. Nelson A.J., Blake D.T., Chen R. Digit-specific aberrations in the primary somatosensory cortex in Writer's cramp. Ann. Neurol. 2009;66:146–154. - PubMed

Publication types