

Induction of the Stringent Response Underlies the Antimicrobial Action of Aliphatic Isothiocyanates
- PMID: 33584562
- PMCID: PMC7874123
- DOI: 10.3389/fmicb.2020.591802
Induction of the Stringent Response Underlies the Antimicrobial Action of Aliphatic Isothiocyanates
Abstract
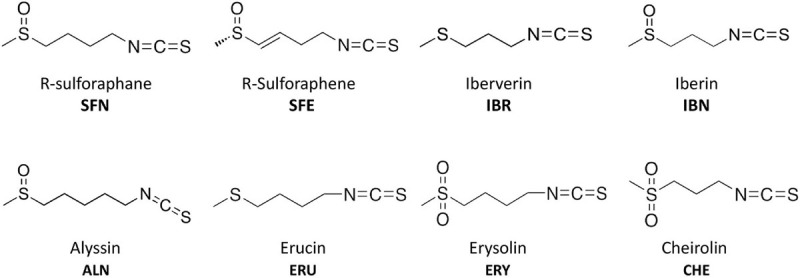
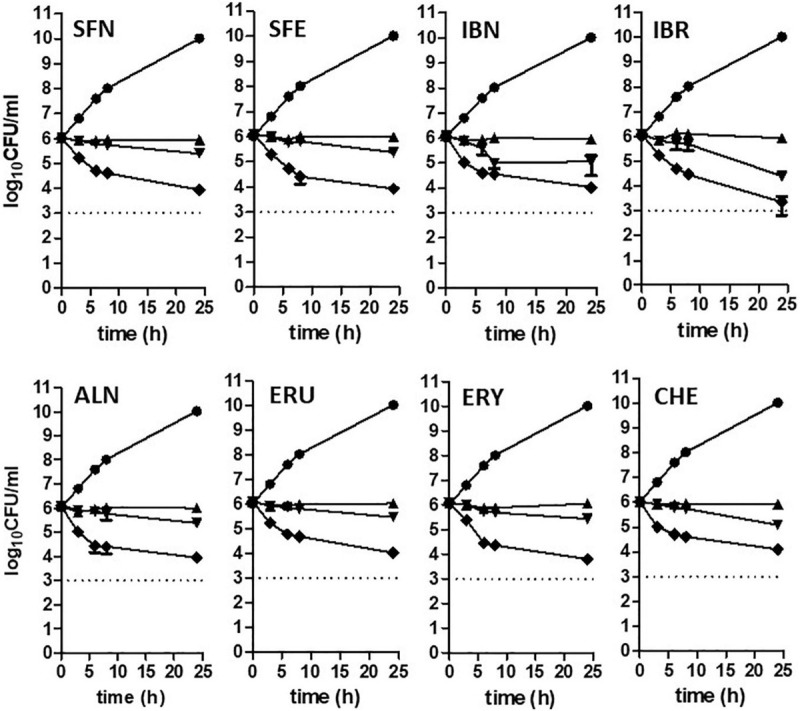
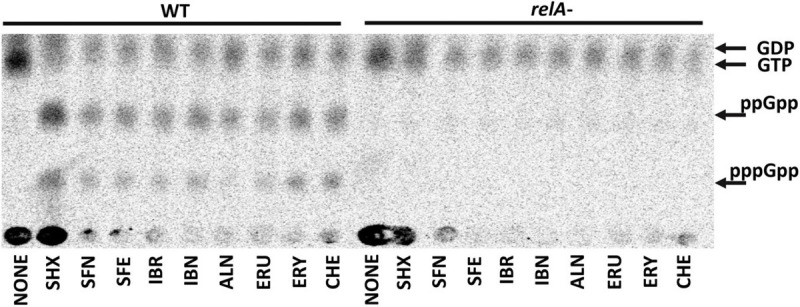
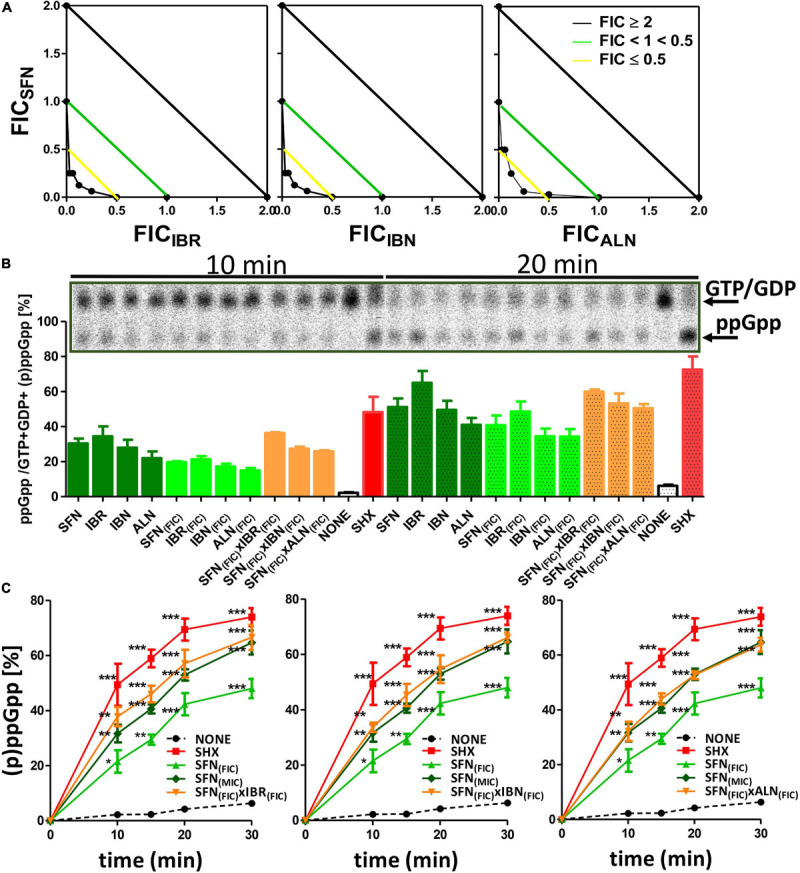
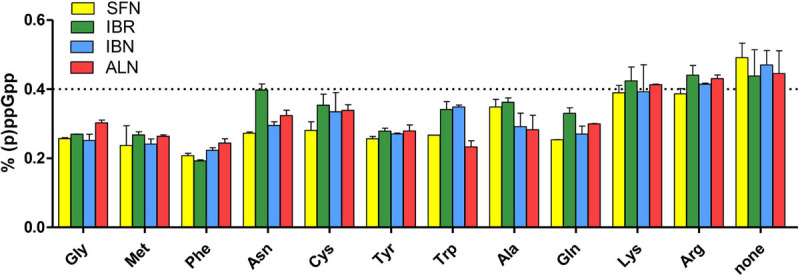
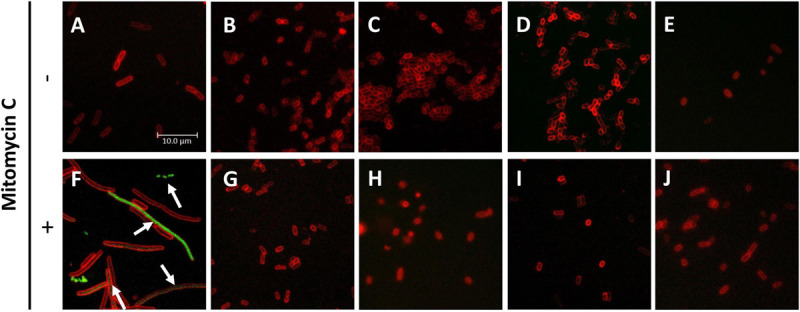
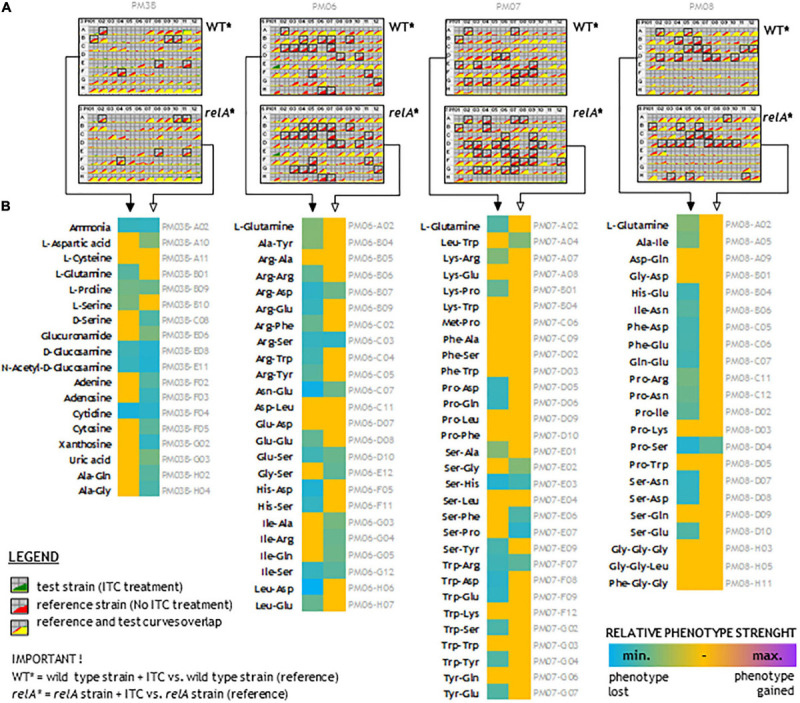
Bacterial resistance to known antibiotics comprises a serious threat to public health. Propagation of multidrug-resistant pathogenic strains is a reason for undertaking a search for new therapeutic strategies, based on newly developed chemical compounds and the agents present in nature. Moreover, antibiotic treatment of infections caused by enterotoxin toxin-bearing strain-enterohemorrhagic Escherichia coli (EHEC) is considered hazardous and controversial due to the possibility of induction of bacteriophage-encoded toxin production by the antibiotic-mediated stress. The important source of potentially beneficial compounds are secondary plant metabolites, isothiocyanates (ITC), and phytoncides from the Brassicaceae family. We reported previously that sulforaphane and phenethyl isothiocyanate, already known for their chemopreventive and anticancer features, exhibit significant antibacterial effects against various pathogenic bacteria. The mechanism of their action is based on the induction of the stringent response and accumulation of its alarmones, the guanosine penta- and tetraphosphate. In this process, the amino acid starvation path is employed via the RelA protein, however, the precise mechanism of amino acid limitation in the presence of ITCs is yet unknown. In this work, we asked whether ITCs could act synergistically with each other to increase the antibacterial effect. A set of aliphatic ITCs, such as iberin, iberverin, alyssin, erucin, sulforaphen, erysolin, and cheirolin was tested in combination with sulforaphane against E. coli. Our experiments show that all tested ITCs exhibit strong antimicrobial effect individually, and this effect involves the stringent response caused by induction of the amino acid starvation. Interestingly, excess of specific amino acids reversed the antimicrobial effects of ITCs, where the common amino acid for all tested compounds was glycine. The synergistic action observed for iberin, iberverin, and alyssin also led to accumulation of (p)ppGpp, and the minimal inhibitory concentration necessary for the antibacterial effect was four- to eightfold lower than for individual ITCs. Moreover, the unique mode of ITC action is responsible for inhibition of prophage induction and toxin production, in addition to growth inhibition of EHEC strains. Thus, the antimicrobial effect of plant secondary metabolites by the stringent response induction could be employed in potential therapeutic strategies.
Keywords: (p)ppGpp; enterohemorrhagic Escherichia coli; isothiocyanate; stringent response; sulforaphane.
Copyright © 2021 Nowicki, Krause, Szamborska, Żukowska, Cech and Szalewska-Pałasz.
Conflict of interest statement
The authors declare that the research was conducted in the absence of any commercial or financial relationships that could be construed as a potential conflict of interest.
Figures
Similar articles
-
Dietary Isothiocyanates, Sulforaphane and 2-Phenethyl Isothiocyanate, Effectively Impair Vibrio cholerae Virulence.Int J Mol Sci. 2021 Sep 22;22(19):10187. doi: 10.3390/ijms221910187. Int J Mol Sci. 2021. PMID: 34638525 Free PMC article.
-
Isothiocyanates as effective agents against enterohemorrhagic Escherichia coli: insight to the mode of action.Sci Rep. 2016 Feb 29;6:22263. doi: 10.1038/srep22263. Sci Rep. 2016. PMID: 26922906 Free PMC article.
-
Various modes of action of dietary phytochemicals, sulforaphane and phenethyl isothiocyanate, on pathogenic bacteria.Sci Rep. 2019 Sep 23;9(1):13677. doi: 10.1038/s41598-019-50216-x. Sci Rep. 2019. PMID: 31548597 Free PMC article.
-
Isothiocyanates: An Overview of Their Antimicrobial Activity against Human Infections.Molecules. 2018 Mar 9;23(3):624. doi: 10.3390/molecules23030624. Molecules. 2018. PMID: 29522501 Free PMC article. Review.
-
The antibacterial properties of isothiocyanates.Microbiology (Reading). 2015 Feb;161(Pt 2):229-243. doi: 10.1099/mic.0.082362-0. Epub 2014 Nov 6. Microbiology (Reading). 2015. PMID: 25378563 Review.
Cited by
-
Sulforaphane, a secondary metabolite in crucifers, inhibits the oxidative stress adaptation and virulence of Xanthomonas by directly targeting OxyR.Mol Plant Pathol. 2022 Oct;23(10):1508-1523. doi: 10.1111/mpp.13245. Epub 2022 Aug 8. Mol Plant Pathol. 2022. PMID: 35942507 Free PMC article.
-
Anti-pruritic effect of isothiocyanates: Potential involvement of toll-like receptor 3 signaling.Pharmacol Res Perspect. 2022 Dec;10(6):e01038. doi: 10.1002/prp2.1038. Pharmacol Res Perspect. 2022. PMID: 36507603 Free PMC article. Review.
-
Sulforaphane as a promising anti-caries agents: inhibitory effects on Streptococcus mutans and caries control in a rat model.Front Microbiol. 2025 Jan 3;15:1427803. doi: 10.3389/fmicb.2024.1427803. eCollection 2024. Front Microbiol. 2025. PMID: 39831123 Free PMC article.
-
Dietary Isothiocyanates, Sulforaphane and 2-Phenethyl Isothiocyanate, Effectively Impair Vibrio cholerae Virulence.Int J Mol Sci. 2021 Sep 22;22(19):10187. doi: 10.3390/ijms221910187. Int J Mol Sci. 2021. PMID: 34638525 Free PMC article.
-
Evaluation of the Anti-Shigellosis Activity of Dietary Isothiocyanates in Galleria mellonella Larvae.Nutrients. 2021 Nov 7;13(11):3967. doi: 10.3390/nu13113967. Nutrients. 2021. PMID: 34836222 Free PMC article.
References
-
- Bajaksouzian S., Visalli M. A., Jacobs M. R., Appelbaum P. C. (1996). Antipneumococcal activities of cefpirome and cefotaxime, alone and in combination with vancomycin and teicoplanin, determined by checkerboard and time-kill methods. Antimicrob. Agents Chemother. 40 1973–1976. 10.1128/AAC.40.9.1973 - DOI - PMC - PubMed
-
- Bener A., Dogan M., Azab I. A., Rashed A., Siddiqui M. (2006). Amino acid profiles among colorectal cancer patients. Biomed. Res. 17 149–154.
LinkOut - more resources
Full Text Sources
Other Literature Sources