. 2021 Jan 11:11:611080.
doi: 10.3389/fmicb.2020.611080. eCollection 2020.

Cold Adaptation Mechanisms of a Snow Alga Chlamydomonas nivalis During Temperature Fluctuations

Affiliations

Cold Adaptation Mechanisms of a Snow Alga Chlamydomonas nivalis During Temperature Fluctuations

Zhao Peng et al. Front Microbiol. .

Abstract

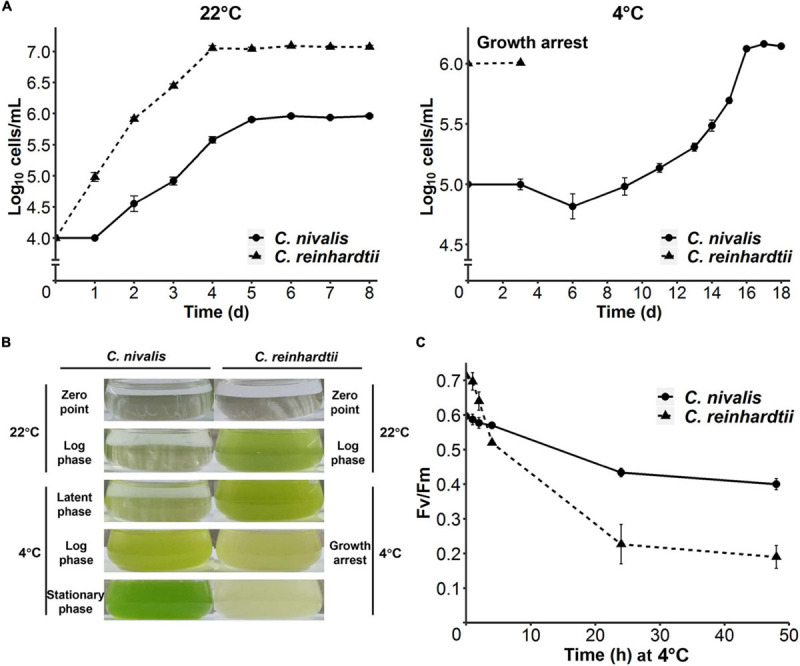
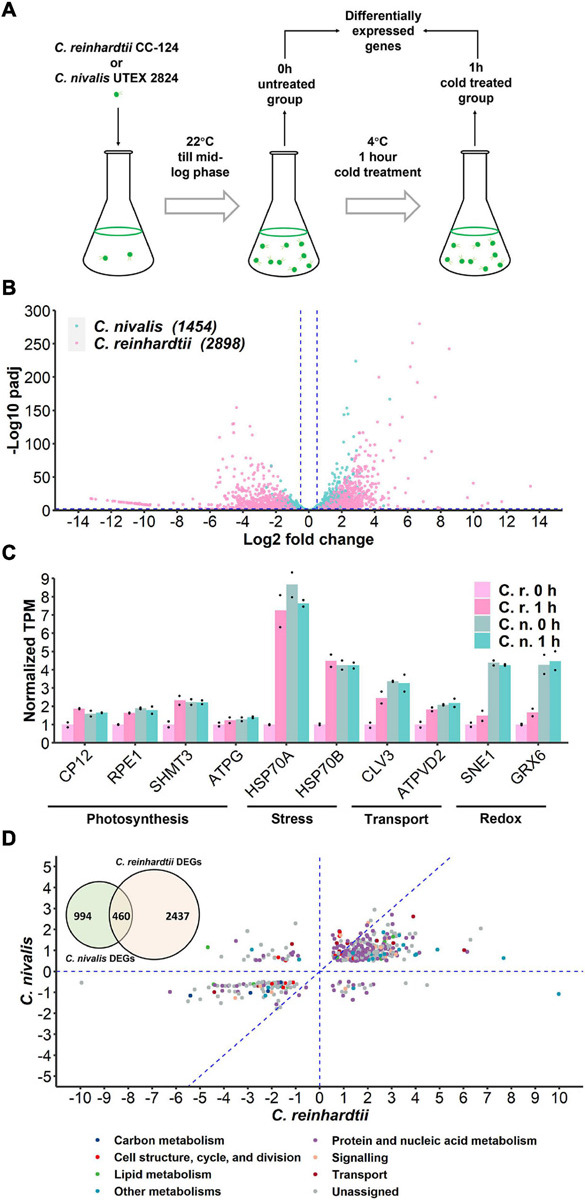
Cold environments, such as glaciers and alpine regions, constitute unique habitats for organisms living on Earth. In these harsh ecosystems, snow algae survive, florish, and even become primary producers for microbial communities. How the snow algae maintain physiological activity during violent ambient temperature changes remains unsolved. To explore the cold adaptation mechanisms of the unicellular snow alga Chlamydomonas nivalis, we compared its physiological responses to a model organism from the same genus, Chlamydomonas reinhardtii. When both cell types were exposed to a shift from 22°C to 4°C, C. nivalis exhibited an apparent advantage in cold tolerance over C. reinhardtii, as C. nivalis had both a higher growth rate and photosynthetic efficiency. To determine the cold tolerance mechanisms of C. nivalis, RNA sequencing was used to compare transcriptomes of both species after 1 h of cold treatment, mimicking temperature fluctuations in the polar region. Differential expression analysis showed that C. nivalis had fewer transcriptomic changes and was more stable during rapid temperature decrease relative to C. reinhardtii, especially for the expression of photosynthesis related genes. Additionally, we found that transcription in C. nivalis was precisely regulated by the cold response network, consisting of at least 12 transcription factors and 3 RNA-binding proteins. Moreover, genes participating in nitrogen metabolism, the pentose phosphate pathway, and polysaccharide biosynthesis were upregulated, indicating that increasing resource assimilation and remodeling of metabolisms were critical for cold adaptation in C. nivalis. Furthermore, we identified horizontally transferred genes differentially expressed in C. nivalis, which are critical for cold adaptation in other psychrophiles. Our results reveal that C. nivalis adapts rapid temperature decrease by efficiently regulating transcription of specific genes to optimize resource assimilation and metabolic pathways, providing critical insights into how snow algae survive and propagate in cold environments.

Keywords: Chlamydomonas reinhardtii; RNA-seq; cold adaptation; horizontal gene transfer; snow algae.


Conflict of interest statement

The authors declare that the research was conducted in the absence of any commercial or financial relationships that could be construed as a potential conflict of interest.

Figures

FIGURE 1
FIGURE 1
Divergent cold acclimation capacity between C. nivalis and C. reinhardtii. (A) Growth curves of C. nivalis and C. reinhardtii at 22°C and 4°C, measured everyday (22°C) or every 2–3 days (4°C). For 4°C growth curve, algae cells at 0 h point had been cultured at 22°C until mid-log phase was reached. The error bars represent standard deviations of three biological replicates. (B) Comparison between different culture states of C. nivalis and C. reinhardtii. Photographs show culture states at five phases of growth for C. nivalis, which was grown at 22°C until mid-log phase and then transferred to 4°C. For each phase, the culture state of C. reinhardtii is shown on the right for comparison. (C) FV/FM measurement of C. nivalis and C. reinhardtii upon cold treatment. Cells at log phase were transferred to 4°C condition, and then FV/FM was measured after 1, 2, 4, 24, and 48 h. The error bars represent standard deviations of three biological replicates.
FIGURE 2
FIGURE 2
Transcriptome of C. nivalis is relatively stable compared to C. reinhardtii. (A) Schematic of sampling for RNA-seq. Algal cells were grown at 22°C until mid-log phase (0 h) and transferred to 4°C immediately for 1 h. Samples at 0 h and 1 h were collected for RNA-seq and differential gene expression analysis. (B) Volcano plot of DEGs in C. nivalis and C. reinhardtii. The blue dashed lines indicate the threshold (fold change > 20.5, adjusted P-value < 0.01) for DEGs filtering. The number of DEGs is indicated in parentheses after the species name. padj, FDR-adjusted P-value. (C) Transcripts per million reads (TPM) of ten conserved genes. TPM values were normalized to TPM value of C. reinhardtii at 22°C. The dots indicate the two replicates for each bar. (D) Venn diagram in the upper-left corner shows overlapping DEGs in C. nivalis and C. reinhardtii. Scatter plot shows fold changes of the overlapping DEGs in the two species separately and the category of DEG is indicated by color. The blue dash lines (x = 0, y = 0, x = y) partition the DEGs to clarify the relationship between fold changes in C. nivalis and C. reinhardtii. LFC, log2 fold change.
FIGURE 3
FIGURE 3
Comparison of de novo assembled transcripts between C. nivalis and C. reinhardtii. (A) Quantity of transcripts and corresponding genes in de novo assembled transcriptomes at 0 h and 1 h (percent GC content is indicated in the legend). (B) The length statistics of the transcriptomes at 0 h and 1 h. For each transcriptome the average, median, and N50 transcript lengths are provided. (C) For each transcriptome, we matched the transcripts to the reference genome, and determined the coverage of the reference gene length aligned to the transcripts, then plotted the cumulative proportions of total reference genes with certain coverage. The starting point of the trend line is set as hits coverage 0% and cumulative proportion 100%.
FIGURE 4
FIGURE 4
Candidate transcription factors and RNA-binding proteins participate in the cold response of C. nivalis. (A) Numbers of differentially expressed transcription factors in C. nivalis and C. reinhardtii, classified into transcription factor families. For each family, upregulated and downregulated genes are indicated by the direction of the axis. (B) Graph and table (top) showing protein–protein interaction analysis of DEGs in C. nivalis based on STRING database. DEGs are shown as colored circles and named as nodes (colors are used as a visual aid to identify the nodes), and interactions are shown as lines and named as edges. The graph below represents the interaction between differentially expressed transcription factors and genes related to metabolism in C. nivalis. Avg., average. PPI, protein–protein interaction. (C) Interaction network of differentially expressed clock-relevant genes in C. nivalis. Homologous genes differentially expressed in C. reinhardtii are also shown.
FIGURE 5
FIGURE 5
Functional classification and enrichment analysis of DEGs in C. nivalis and C. reinhardtii. (A,B) Numbers of C. nivalis DEGs (A) and C. reinhardtii DEGs (B) in MapMan categories. For each category, upregulated and downregulated genes are indicated by color. (C–F) The bubble plots of enriched MapMan categories (C) and enriched KEGG pathways (D) in C. nivalis; enriched MapMan categories (E) and enriched KEGG pathways (F) in C. reinhardtii. Only categories with scores > 1.3 are listed, separated as up or downregulated genes. Score for each category was calculated using the P-value (Score = –log10 [P-value]) in enrichment analysis. OPP, the oxidative pentose phosphate pathway.
FIGURE 6
FIGURE 6
Differentially expressed genes in nitrogen metabolism in C. nivalis and C. reinhardtii. Arrows represent the direction of reactions. Enzymes are marked by solid rectangles, and substrates and products are marked by circles. Dashed rectangles indicate pathways connected to nitrogen metabolism. Upregulated and downregulated genes are indicated by red and blue, respectively. AMT, ammonium transporter; GDH, glutamate dehydrogenase; GLT, glutamate synthase; GS, glutamine synthetase; NIR, nitrite reductase; NR, nitrate reductase; NRT, nitrate/nitrite transporter.
FIGURE 7
FIGURE 7
Differentially expressed genes in central carbon metabolism in C. nivalis. Arrows represent the direction of reactions. Enzymes are marked by solid rectangles, and substrates and products are marked by circles. Dashed rectangles indicate pathways connected to carbon metabolism. Upregulated and downregulated genes are indicated by red and blue, respectively. ACAC, acetyl-CoA carboxylase/biotin carboxylase; ACO, aconitate hydratase; AGP: glucose-1-phosphate adenylyltransferase; ALDO, fructose-bisphosphate aldolase; AM, amylomaltase (4-alpha-glucanotransferase); AMY, beta-amylase; CS, citrate synthase; ENO, enolase; FBP, fructose-1,6-bisphosphatase; FUM, fumarate hydratase; G6PC, glucose-6-phosphatase; G6PDH, glucose-6-phosphate dehydrogenase; GLYK, glycerate 3-kinase; GPI, glucose-6-phosphate isomerase; HK, hexokinase; ICL, isocitrate lyase; IDH, isocitrate dehydrogenase; MDH, malate dehydrogenase; MGAM, maltase-glucoamylase; MS, malate synthase; OGDC, 2-oxoglutarate dehydrogenase complex; PC, pyruvate carboxylase; PCK, phosphoenolpyruvate carboxykinase; PDHC, pyruvate dehydrogenase complex; PFK, phosphofructokinase; PGAM, phosphoglycerate mutase; PGD, 6-phosphogluconate dehydrogenase; PGK, phosphoglycerate kinase; PGL, 6-phosphogluconolactonase; PGM, phosphoglucomutase; PK, pyruvate kinase; PRK, phosphoribulokinase; PRPP, phosphoribosylpyrophosphate; PRPS, ribose-phosphate pyrophosphokinase (PRPP synthase); RPI, ribose 5-phosphate isomerase; RuBisCO, ribulose-bisphosphate carboxylase; SCS, succinyl-CoA synthetase; SDH, succinate dehydrogenase; SS, starch synthase; TA, transaldolase; TK, transketolase; TPI, triosephosphate isomerase.
FIGURE 8
FIGURE 8
C. nivalis secreted more EPS in cold environments. (A) Photograph of two tubes where the walls were adhered by cultures of C. nivalis growing at 22°C and 4°C separately. (B) Bar plot shows concentrations of EPS in C. nivalis growing at 22°C and 4°C for 3 days. Error bars represent the standard deviations of three biological replicates.
FIGURE 9
FIGURE 9
Overview of cold adaptation mechanisms in C. nivalis. Black bold text indicates the main processes in the cold adaptation mechanism, and black non-bolded text indicates the detailed pathways and genes related to the process identified in this study. Green text indicates the chemicals in the pathways. Pink text indicates the function of the compounds in cold resistance. Rectangles indicate the nitrate and ammonium transporters. Upon cold stress from the extracellular environment, signals upstream are transferred to regulate the processing of RNA and synthesis of functional proteins. The functional proteins then allow for increased material assimilation and remodeling of metabolisms, to produce specific chemicals needed for cold resistance. CHO, carbohydrate. EPS, exopolysaccharides. IBP, ice-binding protein. PUFA, polyunsaturated fatty acid. Ribulose-5P, ribulose 5-phosphate.

Similar articles

Cited by

References

    1. Alexa A., Rahnenfuhrer J. (2010). topGO: Enrichment Analysis for Gene Ontology. R package version 2(0), 2010.
    1. Arai T., Fukami D., Hoshino T., Kondo H., Tsuda S. (2019). Ice-binding proteins from the fungus Antarctomyces psychrotrophicus possibly originate from two different bacteria through horizontal gene transfer. FEBS J. 286 946–962. 10.1111/febs.14725 - DOI - PubMed
    1. Blaby I. K., Blaby-Haas C. E., Tourasse N., Hom E. F. Y., Lopez D., Aksoy M., et al. (2014). The Chlamydomonas genome project: a decade on. Trends Plant Sci. 19 672–680. 10.1016/j.tplants.2014.05.008 - DOI - PMC - PubMed
    1. Blanc G., Agarkova I., Grimwood J., Kuo A., Brueggeman A., Dunigan D. D., et al. (2012). The genome of the polar eukaryotic microalga Coccomyxa subellipsoidea reveals traits of cold adaptation. Genome Biol. 13:R39. 10.1186/gb-2012-13-5-r39 - DOI - PMC - PubMed
    1. Capella-Gutierrez S., Silla-Martinez J. M., Gabaldon T. (2009). trimAl: a tool for automated alignment trimming in large-scale phylogenetic analyses. Bioinformatics 25 1972–1973. 10.1093/bioinformatics/btp348 - DOI - PMC - PubMed

LinkOut - more resources