. 2021 Jan 29:11:621222.
doi: 10.3389/fimmu.2020.621222. eCollection 2020.

Persistent Systemic Inflammation in Patients With Severe Burn Injury Is Accompanied by Influx of Immature Neutrophils and Shifts in T Cell Subsets and Cytokine Profiles

Affiliations

Persistent Systemic Inflammation in Patients With Severe Burn Injury Is Accompanied by Influx of Immature Neutrophils and Shifts in T Cell Subsets and Cytokine Profiles

Patrick P G Mulder et al. Front Immunol. .

Abstract

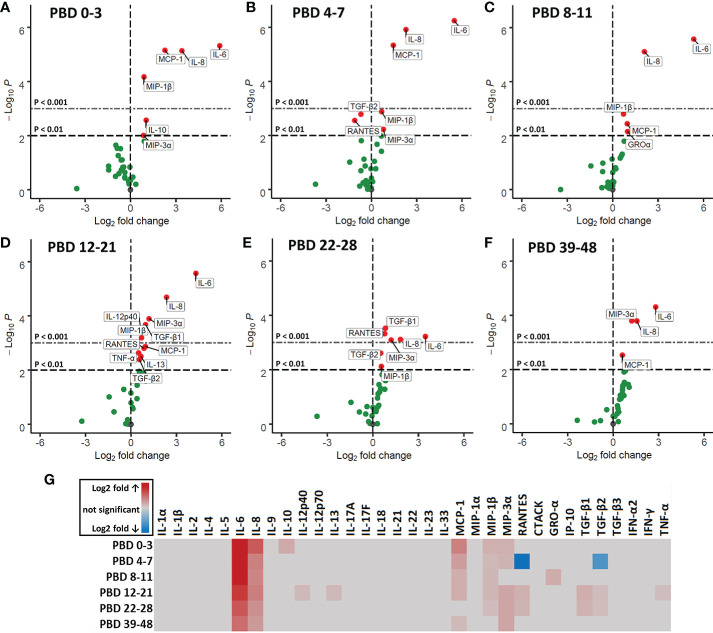
Severe burn injury causes local and systemic immune responses that can persist up to months, and can lead to systemic inflammatory response syndrome, organ damage and long-term sequalae such as hypertrophic scarring. To prevent these pathological conditions, a better understanding of the underlying mechanisms is essential. In this longitudinal study, we analyzed the temporal peripheral blood immune profile of 20 burn wound patients admitted to the intensive care by flow cytometry and secretome profiling, and compared this to data from 20 healthy subjects. The patient cohort showed signs of systemic inflammation and persistently high levels of pro-inflammatory soluble mediators, such as IL-6, IL-8, MCP-1, MIP-1β, and MIP-3α, were measured. Using both unsupervised and supervised flow cytometry techniques, we observed a continuous release of neutrophils and monocytes into the blood for at least 39 days. Increased numbers of immature neutrophils were present in peripheral blood in the first three weeks after injury (0.1-2.8 × 10⁶/ml after burn vs. 5 × 10³/ml in healthy controls). Total lymphocyte numbers did not increase, but numbers of effector T cells as well as regulatory T cells were increased from the second week onward. Within the CD4+ T cell population, elevated numbers of CCR4+CCR6- and CCR4+CCR6+ cells were found. Altogether, these data reveal that severe burn injury induced a persistent innate inflammatory response, including a release of immature neutrophils, and shifts in the T cell composition toward an overall more pro-inflammatory phenotype, thereby continuing systemic inflammation and increasing the risk of secondary complications.

Keywords: burn injury; flow cytometry; immune response; inflammation; lymphocytes; monocytes; neutrophils; systemic.


Conflict of interest statement

The authors declare that the research was conducted in the absence of any commercial or financial relationships that could be construed as a potential conflict of interest.

Figures

Figure 1
Figure 1
Blood immune cells after severe burn injury. Flow cytometry was used for phenotyping of leukocytes: (A) Total leukocyte numbers (gray). (B) Granulocyte numbers (red). (C) Lymphocyte numbers (blue). (D) Monocyte numbers (green). (E) Relative amount of leukocyte subtypes. Number of subjects per time interval is shown on top of the graphs. Values of burn wound patients and healthy controls (HC) are shown as mean (line and dots) ± standard deviation (colored band). Asterisks indicate significant differences in time within the burn patient group (linear mixed model analysis): *p < 0.05; **p < 0.01. Significant differences of outcomes in burn patients of PBD 0-3 compared to healthy controls are indicated by × (×××p < 0.001).
Figure 2
Figure 2
Unsupervised FlowSOM analysis of granulocyte and monocyte subtypes after severe burn injury. FlowSOM plots present proportions of populations and the expression of markers that were used in the innate flow cytometry panel (CD10, CD11b, CD14, CD15 and CD16). (A) Cluster structure based on flow cytometry data of 10 healthy controls and 7 burn wound patients that were observed for 4 weeks. The most pronounced subtypes are encircled by dashed lines: CD16+ monocytes (node 1), CD10bright neutrophils (nodes 2-7), CD10dim neutrophils (nodes 8-13), CD16- granulocytes (node 14), CD14dim- CD14brightCD16- monocytes (node 16). FlowSOM plots of: (B) Week 1; (C) Week 2; (D) Week 3; (E) Week 4 after burn; (F) Healthy controls.
Figure 3
Figure 3
Supervised analysis of blood granulocyte and monocyte subsets after severe burn injury. Flow cytometry results of: (A) Neutrophils (CD15+CD16+ granulocytes). (B) Eosinophils (CD15+CD16-CD9+ granulocytes). (C) Immature neutrophils (CD10dim neutrophils). (D) Mature neutrophils (CD10bright neutrophils). (E) Classical monocytes (CD14brightCD16- monocytes). (F) Intermediate monocytes (CD14brightCD16+ monocytes). (G) Non-classical monocytes (CD14dimCD16+ monocytes). Number of subjects per time interval is shown on top of the graphs. Values of burn wound patients and healthy controls (HC) are shown as mean (line and dots) ± standard deviation (colored band). Asterisks indicate significant differences in time within the burn patient group (linear mixed model analysis): *p < 0.05; **p < 0.01. Significant differences of outcomes in burn patients on PBD 0-3 compared to healthy controls are indicated by × (×××p < 0.001).
Figure 4
Figure 4
Unsupervised FlowSOM analysis of lymphocyte subtypes after severe burn injury. FlowSOM plots present proportions of populations and the expression of markers that were used in the lymphocyte flow cytometry panel (CD3, CD4, CD25, CD127, CCR4 and CCR6). (A) Cluster structure based on flow cytometry data of 10 healthy controls and 12 burn wound patients that were observed for 4 weeks. The most pronounced subtypes are encircled by dashed lines: CD4+ T cells (nodes 1-7), Tregs (nodes 6, 7), CD4- T cells (nodes 8-12), CD3- lymphocytes (nodes 13-16). FlowSOM plots of: (B) Week 1; (C) Week 2; (D) Week 3; (E) Week 4 after burn; (F) Healthy controls.
Figure 5
Figure 5
Supervised analysis of blood lymphocyte subsets after severe burn injury. Flow cytometry results of: (A) CD4- T cells (CD3+CD4- lymphocytes). (B) CD4+ T cells (CD3+CD4+ lymphocytes). (C) Tregs (CD3+CD4+CD25+CD127- lymphocytes). (D) CCR4-CCR6+ CD4+ (non-Treg) T cells; (E) CCR4+CCR6- CD4+ (non-Treg) T cells; (F) CCR4+CCR6+ CD4+ (non-Treg) T cells; (G) CCR4-CCR6+ Tregs; (H) CCR4+CCR6- Tregs; (I) CCR4+CCR6+ Tregs. Number of subjects per time interval is shown on top of the graphs. Cell subset concentrations of burn wound patients and healthy controls (HC) are shown as mean (line and dots) ± standard deviation (colored band). Asterisks indicate significant differences in time within the burn patient group (linear mixed model analysis): *p < 0.05. Significant differences of outcomes in burn patients on PBD 0-3 compared to healthy controls are indicated by × (××p < 0.01).
Figure 6
Figure 6
Volcano plots of 33 plasma immune factors after severe burn injury. Soluble mediators were analyzed in plasma of burn patients and healthy controls by Luminex immunoassay: MCP-1 (CCL2), MIP-1α (CCL3), MIP-1β (CCL4), MIP-3α (CCL20), GRO-α (CXCL1), IP-10 (CXCL10), IFN-α2, IFN-γ, TNF-α, TGF-β1, TGF-β2, TGF-β3, CTACK (CCL27), RANTES (CCL5), IL-1α, IL-1β, IL-2, IL-4, IL-5, IL-6, IL-8 (CXCL8), IL-9, IL-10, IL-12p40, IL-12p70, IL-13, IL-17A (CTLA-8), IL-17F, IL-18, IL-21, IL-22, IL-23, and IL-33 (NF-HEV). Differences between burn and healthy group were expressed as (Log2) fold change of healthy group (n = 13) on the x-axis and the (-Log10) p value on the y-axis of various time intervals after burn. (A) PBD 0 to 3 (n = 10 patients). (B) PBD 4 to 7 (n = 14 patients). (C) PBD 8 to 11 (n = 13 patients). (D) PBD 12 to 21 (n = 15 patients). (E) PBD 22-28 (n = 13 patients). (F) PBD 39 to 48 (n = 8 patients). Because of multiple testing, we considered a p value of < 0.01 to be significant. Black dashed line shows p = 0.01, gray dashed line shows p = 0.001, green dots indicate non-significant changes and red dots show significant changes. (G) Heatmap of significant (p < 0.01) fold changes compared to healthy controls (Log2 fold). Fold changes are shown in gray (not significant), red (increase) or blue (decrease).
Figure 7
Figure 7
Heatmap of correlation coefficients of immune cells and soluble mediators over time. Significant (p < 0.05) correlation coefficients (r) of immune cell counts and fold change of soluble mediators at: (A) Week 1 (n = 13 patients); (B) Week 2 (n = 15 patients); (C) Week 3 (n = 10 patients); (D) Week 4 (n = 5 patients) after burn injury. Correlations were measured by Pearson tests and results are shown in gray (not significant), red (positive correlation) or blue (negative correlation).

Similar articles

Cited by

References

    1. Jeschke MG, van Baar ME, Choudhry MA, Chung KK, Gibran NS, Logsetty S. Burn injury. Nat Rev Dis Prim (2020) 6:1–25. 10.1038/s41572-020-0145-5 - DOI - PMC - PubMed
    1. Nielson CB, Duethman NC, Howard JM, Moncure M, Wood JG. Burns: Pathophysiology of Systemic Complications and Current Management. J Burn Care Res (2017) 38:e469–81. 10.1097/BCR.0000000000000355 - DOI - PMC - PubMed
    1. Eming SA, Krieg T, Davidson JM. Inflammation in wound repair: Molecular and cellular mechanisms. J Invest Dermatol (2007) 127:514–25. 10.1038/sj.jid.5700701 - DOI - PubMed
    1. Zhu Z, Ding J, Tredget EE. The molecular basis of hypertrophic scars. Burn Trauma (2016) 4:2. 10.1186/s41038-015-0026-4 - DOI - PMC - PubMed
    1. Bergquist M, Hästbacka J, Glaumann C, Freden F, Huss F, Lipcsey M. The time-course of the inflammatory response to major burn injury and its relation to organ failure and outcome. Burns (2019) 45:354–63. 10.1016/j.burns.2018.09.001 - DOI - PubMed

Publication types

MeSH terms