. 2021 Jan 14:11:573197.
doi: 10.3389/fpls.2020.573197. eCollection 2020.

Metabolic Modeling of the C3-CAM Continuum Revealed the Establishment of a Starch/Sugar-Malate Cycle in CAM Evolution

Affiliations

Metabolic Modeling of the C3-CAM Continuum Revealed the Establishment of a Starch/Sugar-Malate Cycle in CAM Evolution

Ignacius Y Y Tay et al. Front Plant Sci. .

Abstract

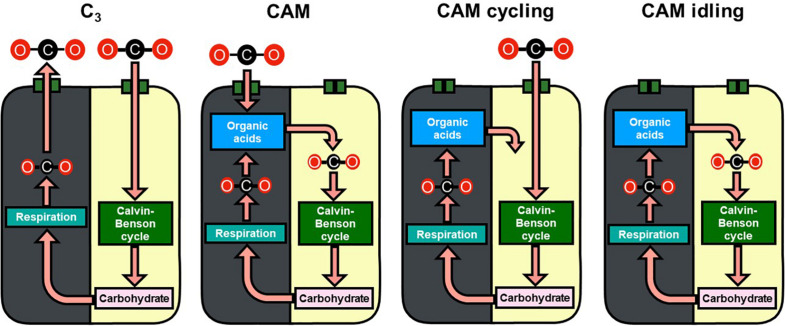
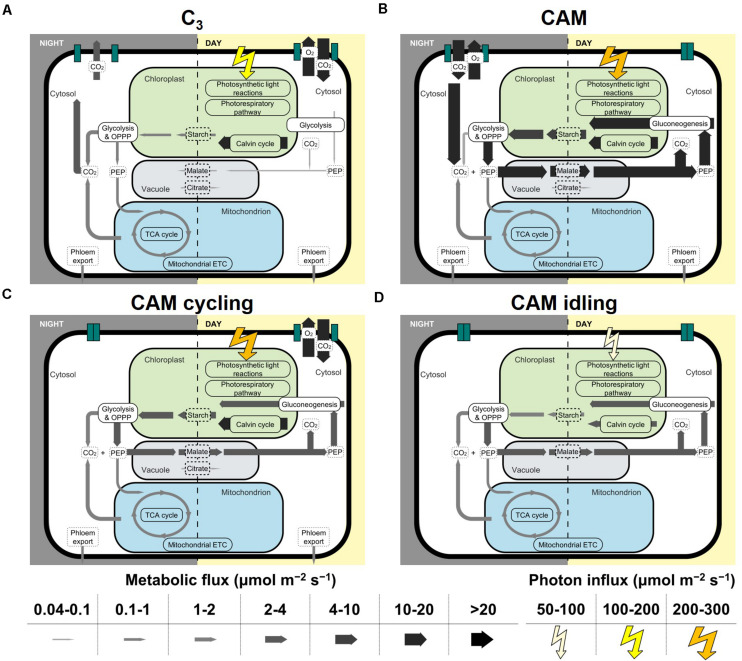
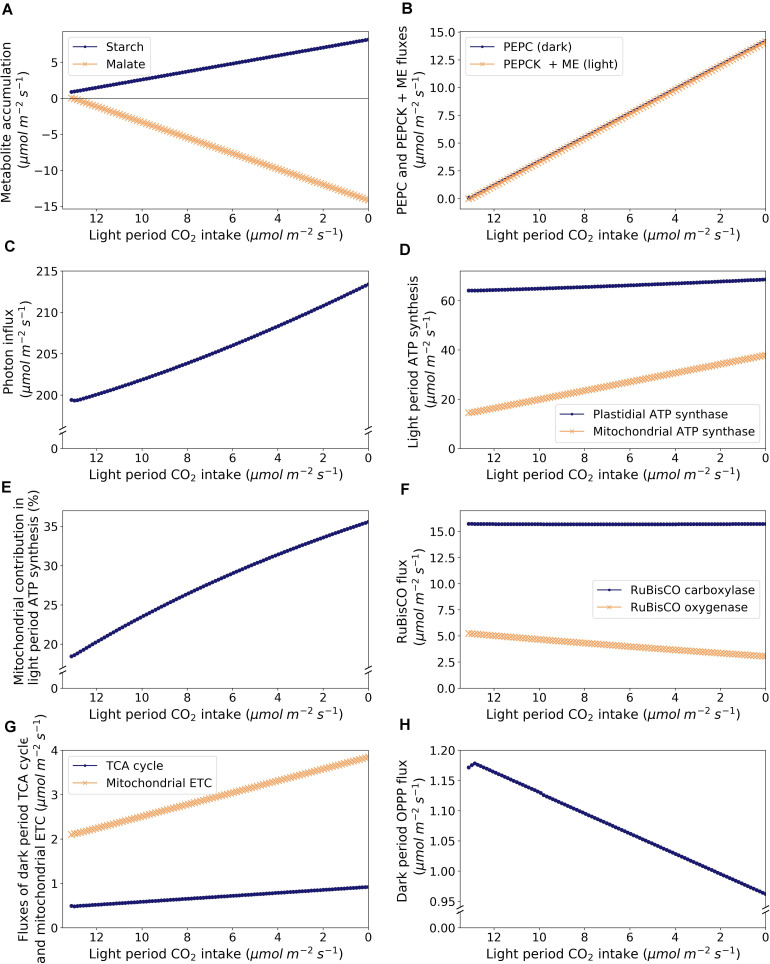
The evolution of Crassulacean acid metabolism (CAM) is thought to be along a C3-CAM continuum including multiple variations of CAM such as CAM cycling and CAM idling. Here, we applied large-scale constraint-based modeling to investigate the metabolism and energetics of plants operating in C3, CAM, CAM cycling, and CAM idling. Our modeling results suggested that CAM cycling and CAM idling could be potential evolutionary intermediates in CAM evolution by establishing a starch/sugar-malate cycle. Our model analysis showed that by varying CO2 exchange during the light period, as a proxy of stomatal conductance, there exists a C3-CAM continuum with gradual metabolic changes, supporting the notion that evolution of CAM from C3 could occur solely through incremental changes in metabolic fluxes. Along the C3-CAM continuum, our model predicted changes in metabolic fluxes not only through the starch/sugar-malate cycle that is involved in CAM photosynthetic CO2 fixation but also other metabolic processes including the mitochondrial electron transport chain and the tricarboxylate acid cycle at night. These predictions could guide engineering efforts in introducing CAM into C3 crops for improved water use efficiency.

Keywords: CAM cycling; CAM evolution; CAM idling; crassulacean acid metabolism; flux balance analysis; metabolic modeling.


Conflict of interest statement

The authors declare that the research was conducted in the absence of any commercial or financial relationships that could be construed as a potential conflict of interest.

Figures

FIGURE 1
FIGURE 1
Schematic diagram of carbon flow in C3, CAM, CAM cycling, and CAM idling. Gray and yellow backgrounds represent the dark and light phases, respectively. The recycling of carbon skeleton from carbohydrate to organic acids in the dark phase was not illustrated for simplicity.
FIGURE 2
FIGURE 2
Core sets of metabolic fluxes in the four modes of photosynthesis modeled: (A) C3, (B) CAM, (C) CAM cycling, and (D) CAM idling. The width of the arrows represents the magnitude of the reaction flux according to the scale on the bottom of the figure in μmol m–2 s–1. The photorespiratory pathway is shown in chloroplast for simplicity, which in reality spans multiple compartments. Flux from 3-phosphoglycerate to PEP was taken as the flux for glycolysis and gluconeogenesis. Flux for succinate dehydrogenase was taken as the TCA cycle flux. Note that only cyclic mode of the TCA cycle was shown. RuBisCO carboxylase flux was taken as the flux through the Calvin-Benson cycle.
FIGURE 3
FIGURE 3
Model predictions of metabolic changes along the C3-CAM continuum, as modeled by varying CO2 exchange during the light period. (A) Accumulation of starch (dots) and malate (crosses), (B) Dark period PEPC flux in the dark period (dots) and malate carboxylation flux as the sum of fluxes of PEPCK and malic enzyme in the light period (crosses), (C) Photon intake in the light period, (D) ATP synthesis in the light period by plastidial ATP synthase (dots) and mitochondrial ATP synthase (crosses), (E) Proportion of light period ATP synthesis by the mitochondrial ATP synthase, (F) Fluxes of RuBisCO carboxylase (dots) and oxygenase (crosses), (G) Fluxes through the TCA cycle (taken as the flux of succinate dehydrogenase; dots) and the mitochondrial ETC (taken as the flux of NADH dehydrogenase; crosses) in the dark period, and (H) flux through the OPPP (taken as the sum of fluxes of plastidial and cytosolic glucose 6-phosphate dehydrogenases) in the dark period.

Similar articles

Cited by

References

    1. Borland A. M., Hartwell J., Weston D. J., Schlauch K. A., Tschaplinski T. J., Tuskan G. A., et al. (2014). Engineering crassulacean acid metabolism to improve water-use efficiency. Trends in Plant Sci. 19 327–338. 10.1016/j.tplants.2014.01.006 - DOI - PMC - PubMed
    1. Bräutigam A., Schlüter U., Eisenhut M., Gowik U. (2017). On the Evolutionary Origin of CAM Photosynthesis. Plant Physiol. 174 473–477. 10.1104/pp.17.00195 - DOI - PMC - PubMed
    1. Chatterjee A., Huma B., Shaw R., Kundu S. (2017). Reconstruction of Oryza sativa indica Genome Scale Metabolic Model and Its Responses to Varying RuBisCO Activity, Light Intensity, and Enzymatic Cost Conditions. Front. Plant Sci. 8:2060. 10.3389/fpls.2017.02060 - DOI - PMC - PubMed
    1. Cheung C. Y. M., Poolman M. G., Fell D. A., Ratcliffe R. G., Sweetlove L. J. (2014). A Diel Flux Balance Model Captures Interactions between Light and Dark Metabolism during Day-Night Cycles in C3 and Crassulacean Acid Metabolism Leaves. Plant Physiol. 165 917–929. 10.1104/pp.113.234468 - DOI - PMC - PubMed
    1. Cushman J. C. (2001). Crassulacean Acid Metabolism. A Plastic Photosynthetic Adaptation to Arid Environments. Plant Physiol. 127 1439–1448. 10.1104/pp.010818 - DOI - PMC - PubMed

LinkOut - more resources