

Past and Future of Plant Stress Detection: An Overview From Remote Sensing to Positron Emission Tomography
- PMID: 33584752
- PMCID: PMC7873487
- DOI: 10.3389/fpls.2020.609155
Past and Future of Plant Stress Detection: An Overview From Remote Sensing to Positron Emission Tomography
Abstract
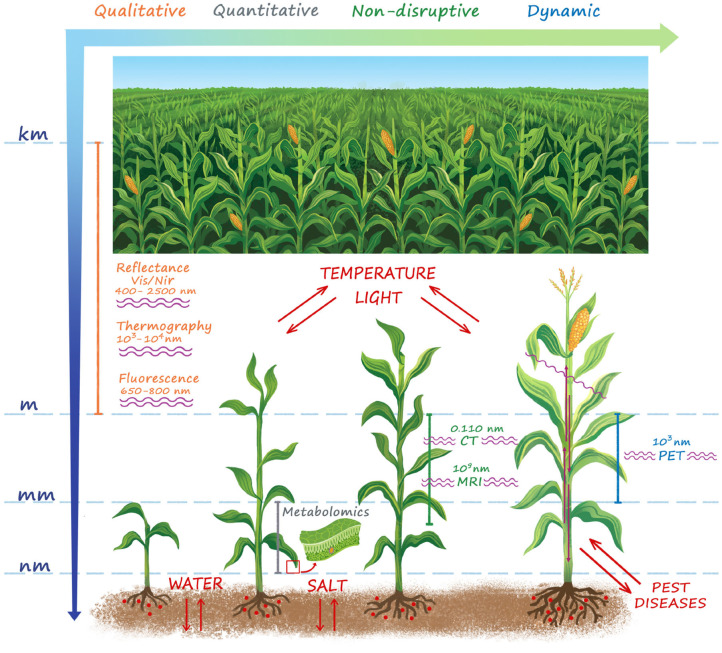
Plant stress detection is considered one of the most critical areas for the improvement of crop yield in the compelling worldwide scenario, dictated by both the climate change and the geopolitical consequences of the Covid-19 epidemics. A complicated interconnection of biotic and abiotic stressors affect plant growth, including water, salt, temperature, light exposure, nutrients availability, agrochemicals, air and soil pollutants, pests and diseases. In facing this extended panorama, the technology choice is manifold. On the one hand, quantitative methods, such as metabolomics, provide very sensitive indicators of most of the stressors, with the drawback of a disruptive approach, which prevents follow up and dynamical studies. On the other hand qualitative methods, such as fluorescence, thermography and VIS/NIR reflectance, provide a non-disruptive view of the action of the stressors in plants, even across large fields, with the drawback of a poor accuracy. When looking at the spatial scale, the effect of stress may imply modifications from DNA level (nanometers) up to cell (micrometers), full plant (millimeters to meters), and entire field (kilometers). While quantitative techniques are sensitive to the smallest scales, only qualitative approaches can be used for the larger ones. Emerging technologies from nuclear and medical physics, such as computed tomography, magnetic resonance imaging and positron emission tomography, are expected to bridge the gap of quantitative non-disruptive morphologic and functional measurements at larger scale. In this review we analyze the landscape of the different technologies nowadays available, showing the benefits of each approach in plant stress detection, with a particular focus on the gaps, which will be filled in the nearby future by the emerging nuclear physics approaches to agriculture.
Keywords: fluorescence imaging; metabolomics; plant imaging; plant positron emission tomography; plant stress; remote sensing; spectroscopy; thermal imaging.
Copyright © 2021 Galieni, D'Ascenzo, Stagnari, Pagnani, Xie and Pisante.
Conflict of interest statement
The authors declare that the research was conducted in the absence of any commercial or financial relationships that could be construed as a potential conflict of interest.
Figures


References
-
- Abdulridha J., Batuman O., Ampatzidis Y. (2019). UAV-based remote sensing technique to detect citrus canker disease utilizing hyperspectral imaging and machine learning. Remote Sens. 11:1373 10.3390/rs11111373 - DOI
-
- Ahmed A., Ibrahim A., Hussein S. (2019). Detection of Palm Tree Pests Using Thermal Imaging: A Review. Cham: Springer International Publishing; 10.1007/978-3-030-02357-7_12 - DOI
-
- Al-doski J., Shattri B., Helmi-Zulhai B. M.-S. (2016). Thermal imaging for pests detecting-a review. Int. J. Agric. For. Plant 2, 10–30.
-
- Alexoff D. L., Dewey S. L., Vaska P., Krishnamoorthy S., Ferrieri R., Schueller M., et al. (2011). Pet imaging of thin objects: measuring the effects of positron range and partial-volume averaging in the leaf of Nicotiana tabacum. Nuclear Med. Biol. 38, 191–200. 10.1016/j.nucmedbio.2010.08.004 - DOI - PubMed
Publication types
LinkOut - more resources
Full Text Sources
Other Literature Sources
Miscellaneous