. 2021 Jan 28:12:628521.
doi: 10.3389/fpls.2021.628521. eCollection 2021.

Improving Nitrogen Use Efficiency Through Overexpression of Alanine Aminotransferase in Rice, Wheat, and Barley

Affiliations

Improving Nitrogen Use Efficiency Through Overexpression of Alanine Aminotransferase in Rice, Wheat, and Barley

Jingwen Tiong et al. Front Plant Sci. .

Abstract

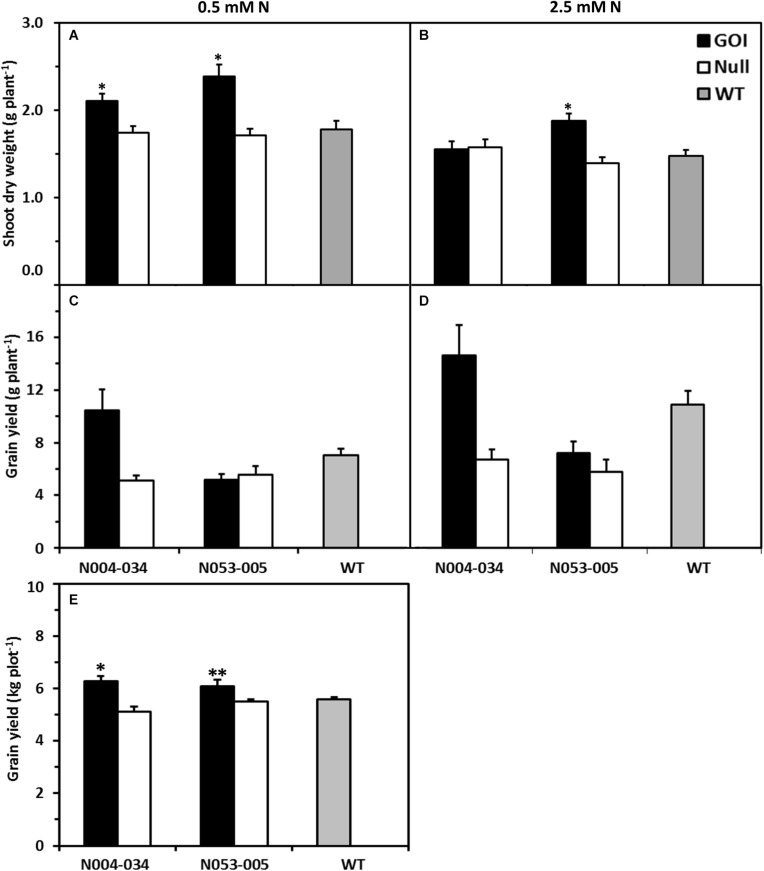
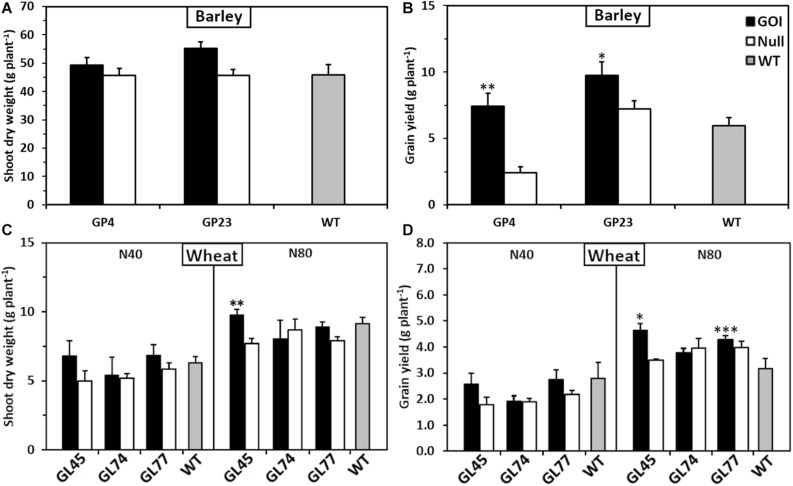
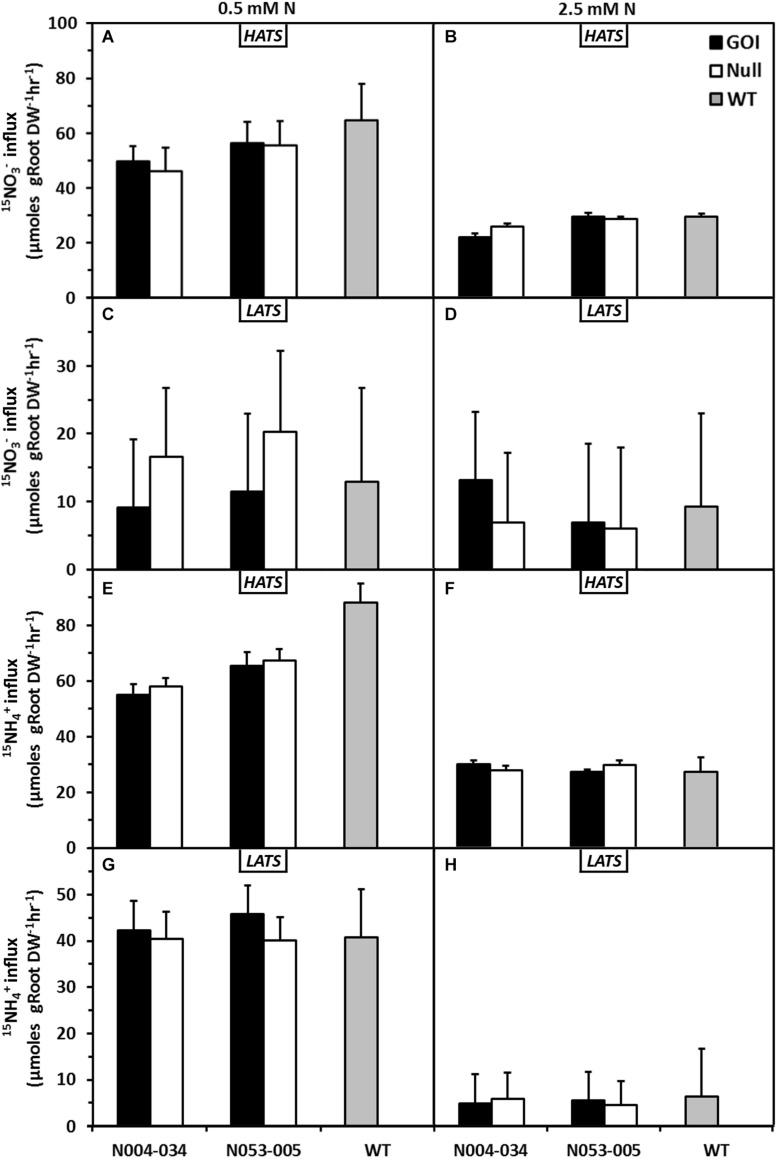
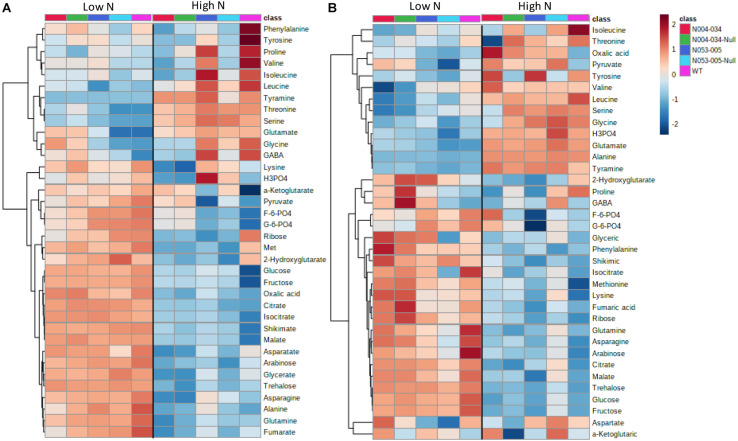
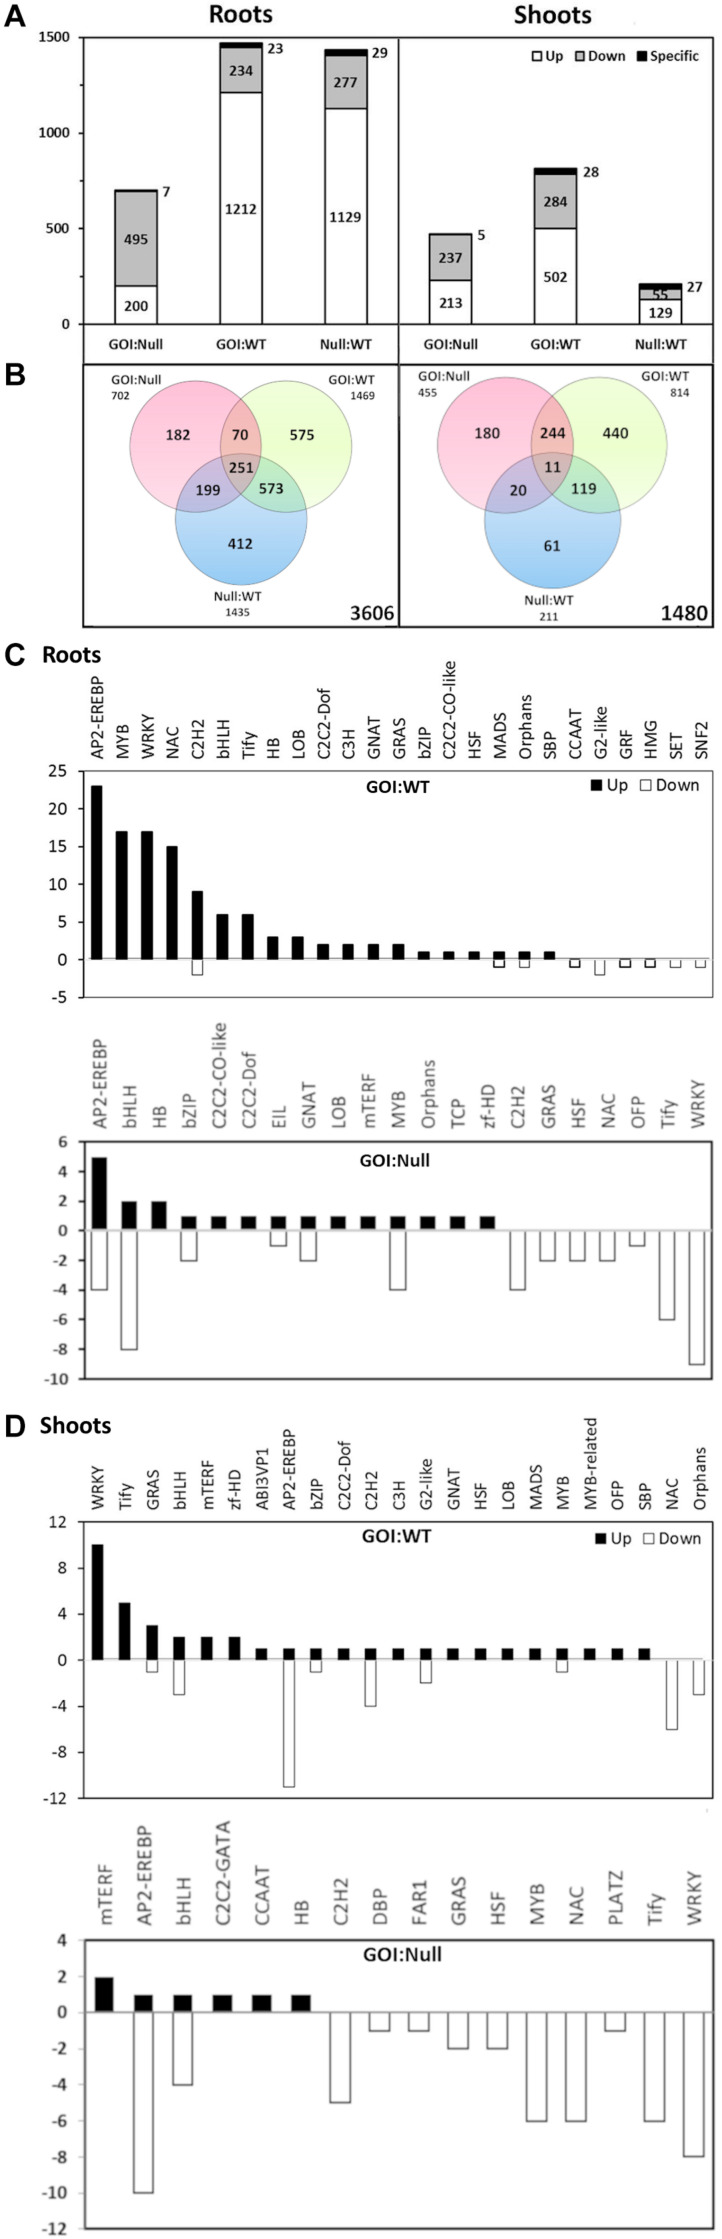
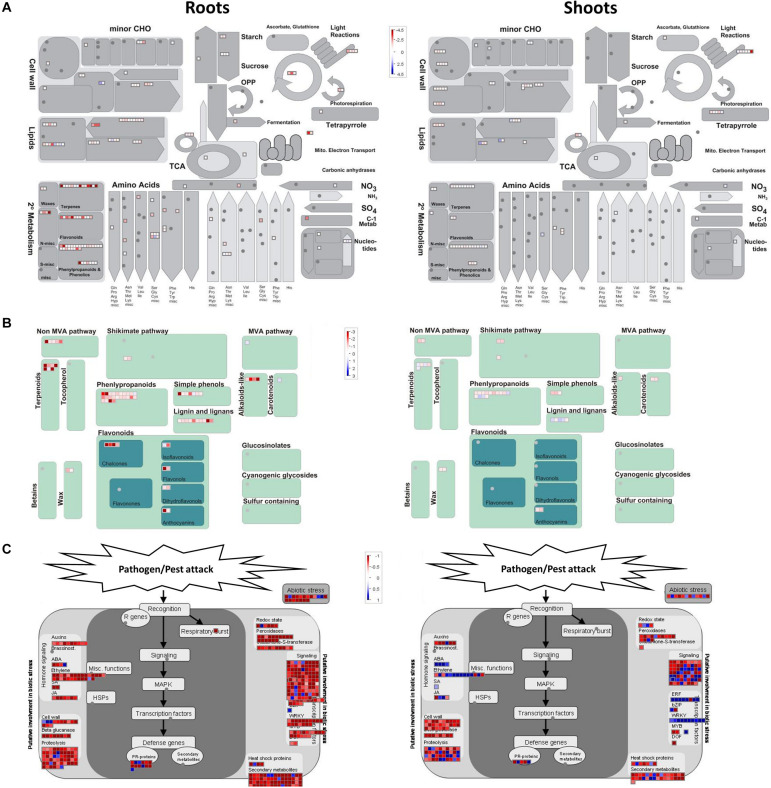
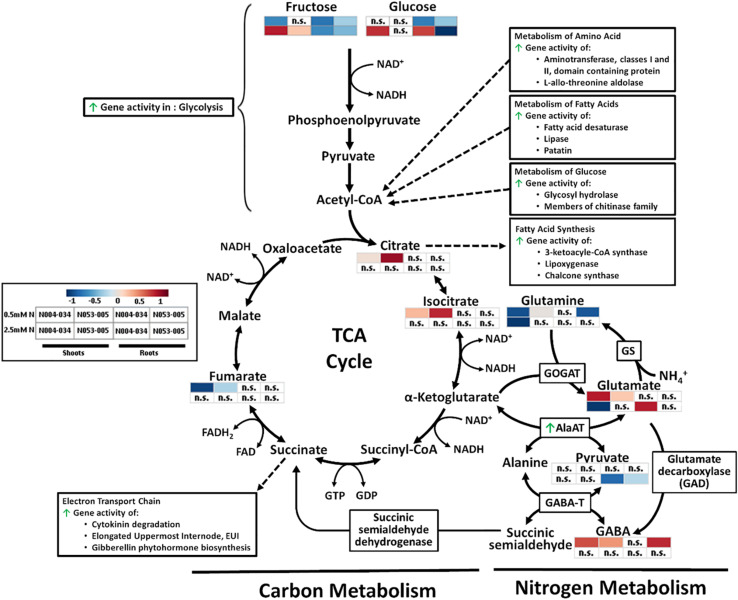
Nitrogen is an essential nutrient for plants, but crop plants are inefficient in the acquisition and utilization of applied nitrogen. This often results in producers over applying nitrogen fertilizers, which can negatively impact the environment. The development of crop plants with more efficient nitrogen usage is, therefore, an important research goal in achieving greater agricultural sustainability. We utilized genetically modified rice lines over-expressing a barley alanine aminotransferase (HvAlaAT) to help characterize pathways which lead to more efficient use of nitrogen. Under the control of a stress-inducible promoter OsAnt1, OsAnt1:HvAlaAT lines have increased above-ground biomass with little change to both nitrate and ammonium uptake rates. Based on metabolic profiles, carbon metabolites, particularly those involved in glycolysis and the tricarboxylic acid (TCA) cycle, were significantly altered in roots of OsAnt1:HvAlaAT lines, suggesting higher metabolic turnover. Moreover, transcriptomic data revealed that genes involved in glycolysis and TCA cycle were upregulated. These observations suggest that higher activity of these two processes could result in higher energy production, driving higher nitrogen assimilation, consequently increasing biomass production. Other potential mechanisms contributing to a nitrogen-use efficient phenotype include involvements of phytohormonal responses and an alteration in secondary metabolism. We also conducted basic growth studies to evaluate the effect of the OsAnt1:HvAlaAT transgene in barley and wheat, which the transgenic crop plants increased seed production under controlled environmental conditions. This study provides comprehensive profiling of genetic and metabolic responses to the over-expression of AlaAT and unravels several components and pathways which contribute to its nitrogen-use efficient phenotype.

Keywords: RNAseq; alanine aminotransferase; carbohydrate metabolism; nitrogen use efficiency; transgenic cereals.


Conflict of interest statement

JK was a named inventor on United States Patents Nitrogen-Efficient Monocot Plants US 8642840 and 8288611, and Arcadia Biosciences has exclusively licensed these patents and others concerning the NUE technology described. JK, WS, YL, and ZL are employees of Arcadia Biosciences, Inc. and as such Arcadia partially funded the work described. The remaining authors declare that the research was conducted in the absence of any commercial or financial relationships that could be construed as a potential conflict of interest.

Figures

FIGURE 1
FIGURE 1
Shoot biomass and grain yield of rice plants expressing OsAnt1:HvAlaAT grown in hydroponics and field (grain yield only for the latter). Two T9 independent homozygous lines (Gene of Interest, GOI, black bars), their corresponding nulls (white bars) and wildtype (WT, gray bars) were assessed for biomass and grain yield. Plants were grown in an ebb and flow hydroponic system under 0.5 mM (A) and 2.5 mM N (B) for 42 days for vegetative shoot biomass (A,B), and grown to maturity in a fill/drain cycle hydroponic system under 0.5 mM (C) and 2.5 mM N (D) for grain yield (C,D). Means and SE values (error bars) of five replicates are presented, while asterisks indicate the least significant difference at P < 0.05 against both null and WT. These lines were also field tested (Five Points, California, 2009) under limiting N (E). In total, 123 kg N ha– 1 was supplied throughout the season, corresponding to approximately 70% of typical N rates for rice in California. Means and SE values (error bars) of three replicates are presented, while asterisks indicate least significant difference at P < 0.05 against both null and WT or against null only∗∗.
FIGURE 2
FIGURE 2
Shoot biomass and grain yield of glasshouse-grown barley and wheat plants expressing OsAnt1:HvAlaAT. Transgenic plants of three independent homozygous lines, null and wildtype were grown in a glasshouse. For barley (A,B), T2 lines were grown in a single N treatment [110 mg as Ca(NO3)2, 400 mg as Osmocote N kg– 1 soil] in individual pots. For wheat (C,D), T4 lines were grown in rows of ten in soil bins under two N treatments (N40, 40 kg N ha– 1; N80, 80 kg N ha– 1). Asterisks indicate least significant difference at P < 0.05 against null and WT, only against null∗∗, or only against WT∗∗∗. Means and SE values (error bars) of ten replicates are presented.
FIGURE 3
FIGURE 3
Effects of low and adequate N treatment on nitrate and ammonium uptake in rice plants via high- and low-affinity transport systems (HATS and LATS). Nitrate HATS influx (A,B) or LATS influx (C,D) and ammonium HATS influx (E,F) or LATS influx (G,H) of plants previously grown in 0.5 and 2.5 mM N. Transgenic plants of two independent lines, their corresponding nulls and wildtype were grown in a hydroponic system for 42 days (52 DAI) and subjected to uptake measurements using 15N labeled N sources at 100 μM (HATS) and 1000 μM (LATS). HATS values are means + SE (Standard Error, n = 5), whereas LATS are calculated means + SED (Standard Error of Difference between two means, n = 5).
FIGURE 4
FIGURE 4
Metabolic heatmaps of rice plants expressing OsAnt1:HvAlaAT. Two transgenic rice lines, their corresponding nulls, and wildtype were grown hydroponically in low N (0.5 mM N) and high N (2.5 mM N) for 42 days. Metabolite levels of the shoot (A) and root (B) were processed by median normalization, log-transformed, and auto-scaling with MetaboAnalyst (Chong et al., 2019). The hierarchical clustering analysis was performed with Pearson’s distance measure.
FIGURE 5
FIGURE 5
Differential gene expression of OsAnt1:AlaAT rice line N053-005 (GOI) compared with its null and wildtype (WT) in roots and shoots under 0.5 mM N (A,B). The number of up- and down-regulated genes (white and gray bars, respectively) is shown in the bar graph (A), with the number of specific transcripts (i.e., transcripts unique only to each comparison) being shown on top of each bar. The Venn diagram (B) shows the number of genes differentially expressed in each of the genotype comparisons. The numbers of differentially expressed transcripts between OsAnt1:HvAlaAT lines and wildtype/nulls representing different transcription factor families are shown in roots (C) and shoots (D).
FIGURE 6
FIGURE 6
MapMan diagrams of differentially expressed genes between OsAnt1:HvAlaAT lines and wildtype for metabolism overview (A), secondary metabolism (B), and biotic stress response (C). Color shades represent upregulation (red) or downregulation (blue) of genes.
FIGURE 7
FIGURE 7
Simplified depiction of the influence of the OsAnt1:HvAlaAT transgene on the carbon and nitrogen metabolism pathway, consisting of glycolysis, TCA cycle, and GABA shunt. Increased gene activities are indicated with green arrows. Heatmaps of metabolites of the shoot and root where both transgenic lines show significant differences to WT in low N (0.5 mM N) and high N (2.5 mM N) are presented. Metabolite levels were processed by median normalization, log-transformed, and auto-scaling with MetaboAnalyst (Chong et al., 2019). Processes associated with certain metabolites were also presented (Acetyl-CoA, Citrate, and Succinate), with dotted arrows linking the aforementioned metabolites to represent either an end product (arrow direction toward it) or a substrate/catalyst (arrow direction away from it).

Similar articles

Cited by

References

    1. Ashhurst D. E. (2001). Chitin and chitinases. Cell Biochem. Funct. 19 228–228. 10.1002/cbf.916 - DOI
    1. Ashraf M., Foolad M. R. (2007). Roles of glycine betaine and proline in improving plant abiotic stress resistance. Environ. Exp. Bot. 59 206–216. 10.1016/j.envexpbot.2005.12.006 - DOI
    1. Avice J.-C., Etienne P. (2014). Leaf senescence and nitrogen remobilization efficiency in oilseed rape (Brassica napus L.). J. Exp. Bot. 65 3813–3824. 10.1093/jxb/eru177 - DOI - PubMed
    1. Avraham T., Badani H., Galili S., Amir R. (2005). Enhanced levels of methionine and cysteine in transgenic alfalfa (Medicago sativa L.) plants over-expressing the Arabidopsis cystathionine γ-synthase gene. Plant Biotechnol. J. 3 71–79. 10.1111/j.1467-7652.2004.00102.x - DOI - PubMed
    1. Beatty P. H., Carroll R. T., Shrawat A. K., Guevara D., Good A. G. (2013). Physiological analysis of nitrogen-efficient rice overexpressing alanine aminotransferase under different N regimes. Bot. Botanique 91 866–883. 10.1139/cjb-2013-0171 - DOI

LinkOut - more resources