. 2021 Jan 28:12:631314.
doi: 10.3389/fpls.2021.631314. eCollection 2021.

Wheat Can Access Phosphorus From Algal Biomass as Quickly and Continuously as From Mineral Fertilizer

Affiliations

Wheat Can Access Phosphorus From Algal Biomass as Quickly and Continuously as From Mineral Fertilizer

Lisa Mau et al. Front Plant Sci. .

Abstract

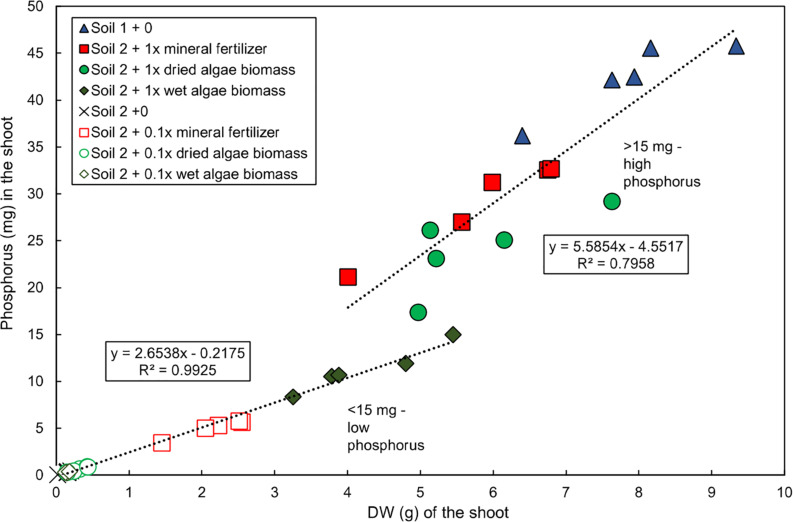
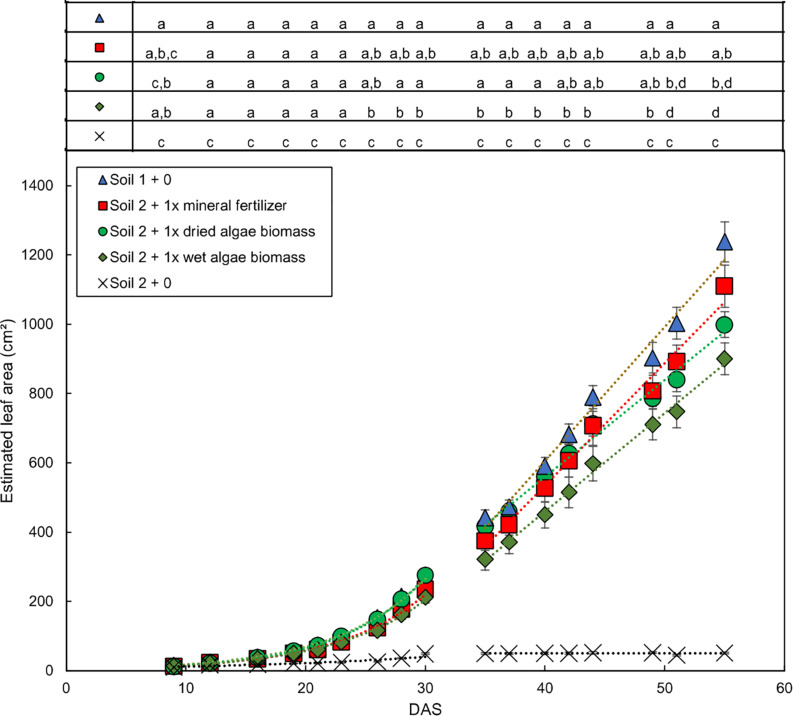
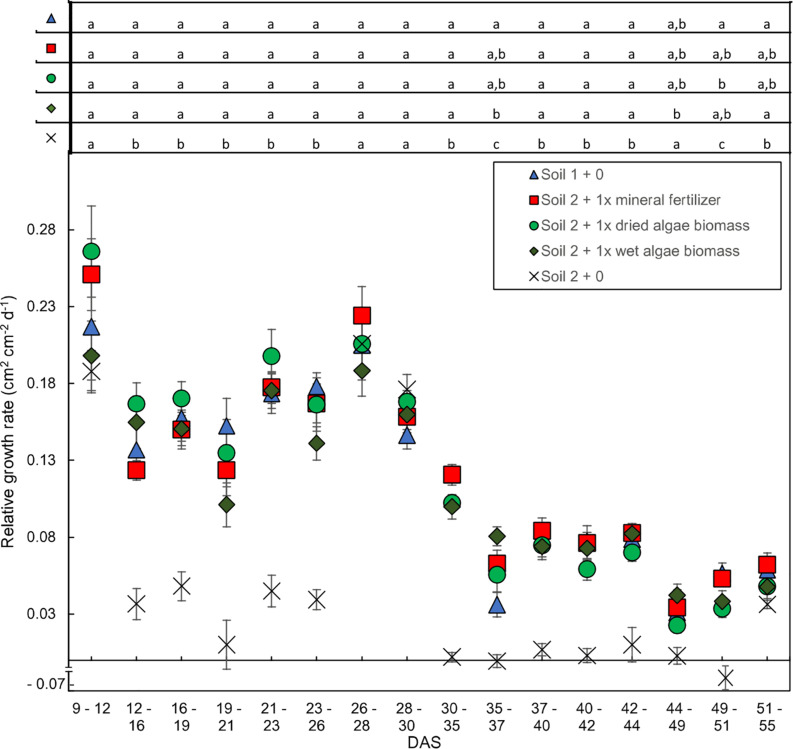
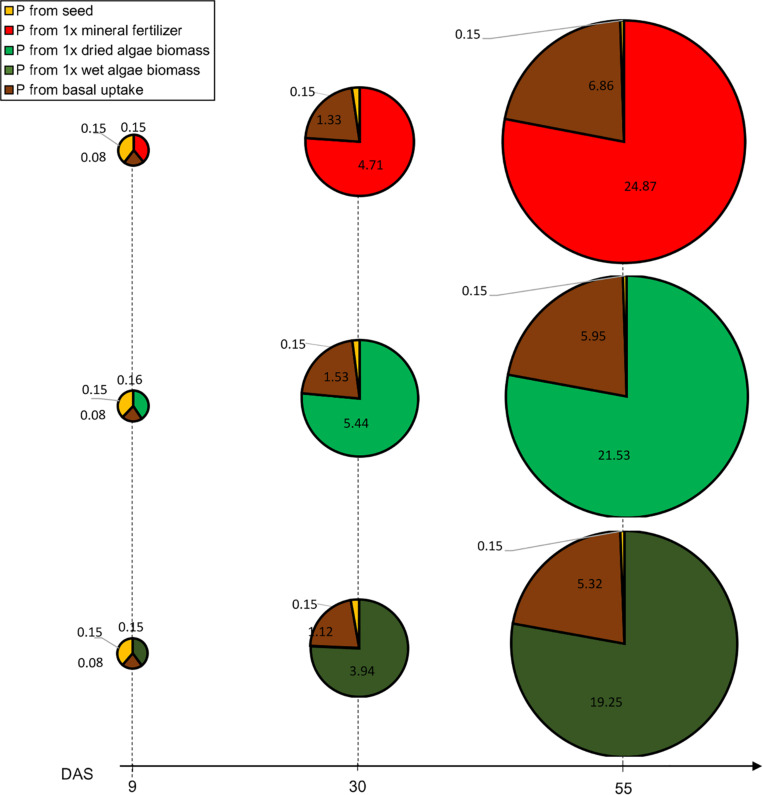
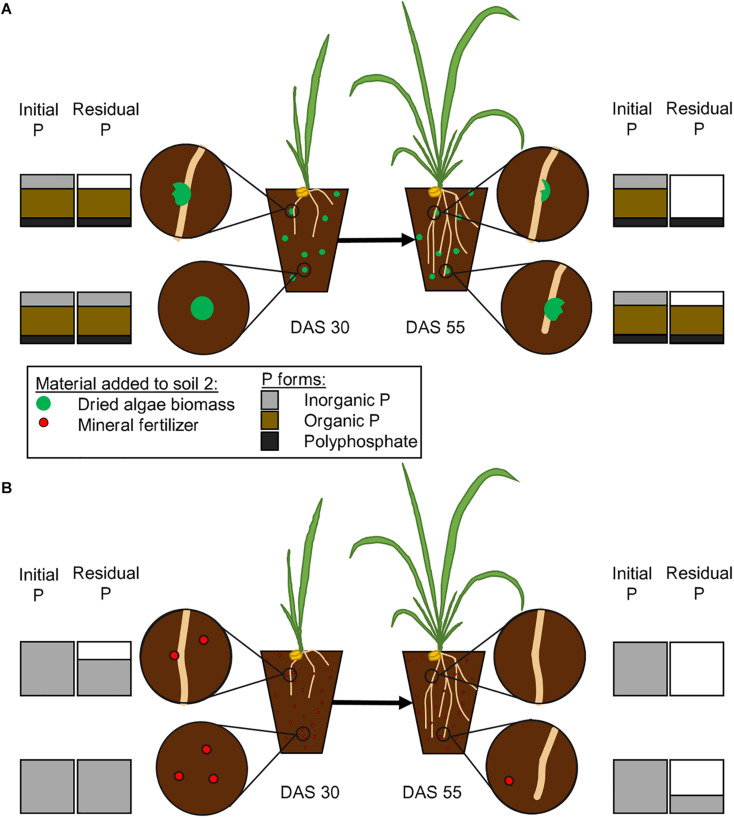
Algae can efficiently take up excess nutrients from waterways, making them a valuable resource potentially capable of replacing synthesized and mined fertilizers for agriculture. The capacity of algae to fertilize crops has been quantified, but it is not known how the algae-derived nutrients become available to plants. We aimed to address this question: what are the temporal dynamics of plant growth responses to algal biomass? to better propose mechanisms by which plants acquire nutrients from algal biomass and thereby study and promote those processes in future agricultural applications. Data from various sources were transformed and used to reconstruct the nutrient release from the algae Chlorella vulgaris and subsequent uptake by wheat (Triticum aestivum L.) (as reported in Schreiber et al., 2018). Plants had received 0.1x or 1x dried algae or wet algae, or zero, 0.1x or 1x mineral fertilizer calculated from agricultural practices for P application and grown to 55 days in three soils. Contents of P and other nutrients acquired from algae were as high as from mineral fertilizer, but varied based on moisture content and amount of algae applied to soils (by 55 days after sowing plants with 1x mineral fertilizer and 1x dried algae had 5.6 mg P g DWshoot; 2.2-fold more than those with 0 or 0.1x mineral fertilizer, 0.1x dried algae and wet algae, and 1x wet algae). Absolute and relative leaf area growth and estimated P uptake rates showed similar dynamics, indicating that wheat acquires P from algae quickly. A model proposes that algal fertilizer promotes wheat growth after rapid transformation in soil to inorganic nutrients. We conclude theoretically that phosphorus from algal biomass is available to wheat seedlings upon its application and is released gradually over time with minor differences related to moisture content on application. The growth and P uptake kinetics hint at nutrient forms, including N, and biomass stimulation worthy of research to further exploit algae in sustainable agriculture practices. Temporal resolved phenotype analyses in combination with a mass-balance approach is helpful for understanding resource uptake from recycled and biofertilizer sources by plants.

Keywords: algae fertilizer; mass balance; phosphorus; plant growth; resource efficiency; wheat.


Conflict of interest statement

The authors declare that the research was conducted in the absence of any commercial or financial relationships that could be construed as a potential conflict of interest.

Figures

FIGURE 1
FIGURE 1
Linear relationship of total P and shoot dry weight of wheat grown with various nutrient sources. Data for total shoot P and shoot dry weight replotted directly from Schreiber et al. (2018). Plants were grown in controlled conditions in the following substrates: soil 1 (nutrient-rich; triangles); soil 2 (nutrient-poor; crosses); or soil 2 with addition of: mineral fertilizer (squares), dried algae biomass (circles) or wet algae biomass (diamonds) either with high (filled forms, 1x) or low amounts (empty forms, 0.1x). Linear correlations were manually fitted to two groups: low P content plants and high P content plants. Each point represents a single plant. n = 20 plants for low P group; n = 15 for high P group.
FIGURE 2
FIGURE 2
Dynamic development of wheat leaf area dependent on nutrient source mineral fertilizer or algal biomass. Estimated leaf area was calculated by conversion using the relationship shown in Supplementary Figure S1. Leaf area growth over time exhibited an exponential and a linear phase, separated by a line. Plants were grown in controlled conditions in the following substrates: soil 1 (triangles); soil 2 (crosses); or soil 2 with addition of: mineral fertilizer (squares), dried algae biomass (circles) or wet algae biomass (green diamonds) in high (filled forms) amounts. Depicted are means per nutrient sources (n = 10 per time point (mineral fertilizer with n = 8), error bars represent SE. Statistical differences were analyzed using ANOVA and Tukey multiple comparison of means test post hoc test both compared between days (top of the figure) and between growth slopes based on individual growth curves (see Table 2). Different letters indicate significant differences with p < 0.05. Equations are fitted to growth curves per phase and their p-values (Table 2).
FIGURE 3
FIGURE 3
Relative shoot growth rates over time dependent on nutrient source. Relative growth rates are based on change in leaf area per unit leaf area during 2–5-day intervals. Plants were grown in controlled conditions in the following substrates: soil 1 + 0 (triangles); soil 2 + 0 (crosses); or soil 2 with addition of: 1x mineral fertilizer (squares), 1x dried algae biomass (circles) or 1x wet algae biomass (diamonds). Each point represents the mean of n = 10 plants with standard error bars. Statistical differences were analyzed using ANOVA and Tukey multiple comparison of means test post hoc test both compared between days (top of the figure). Different letters indicate significant differences with p < 0.05. The break in y-axis was inserted manually together with the negative growth value for soil 2 + 0 on interval 49–51 (–0.068 cm2 cm−2 d−1).
FIGURE 4
FIGURE 4
Contribution to P uptake from seed, soil or nutrient source in plants provided with mineral fertilizer or dried algae over time. Values indicate P (in mg) at different time points. P uptake is represented for plants grown in soil 2 + 1x mineral fertilizer (top row), plants grown in soil 2 + 1x dried algae biomass (middle row), and soil 2 + 1x wet algae biomass (bottom row). The area of the circle represents the total P measured at harvest (55 DAS), each circle piece the indicated source. The basal P uptake from the was approximated based on plants grown in soil 2 without addition of nutrients (see section “Materials and Methods”). During the growth period, total P uptake was calculated based on the projected leave area. Values are means per nutrient source (n = 5) per time point.
FIGURE 5
FIGURE 5
Proposed pattern of phosphate release from mineral fertilizer and dried algae biomass. The initial P bars represent the amount initially added in Schreiber et al., 2018 with either dried algae biomass (A) or mineral fertilizer (B). The figure states our hypothesis on how algal biomass will release phosphate from different bound forms (A), including inorganic P, organically bound P and polyphosphates. The algae biomass will release its nutrients close to the roots or in abundance of microbial activity. The plants will take up inorganic portions first (upper left, DAS 30), then facilitate the release of phosphates from organic forms (upper right, DAS 55) and then the polyphosphates. The uptake from mineral fertilizer (B) will be less complicated, inorganic phosphate will be taken up, as soon as it is close to the root (upper left, DAS 30) and therefore completely taken up faster (upper right, DAS 55). The amounts of different P forms are estimated from literature Feng et al., 2016.

Similar articles

Cited by

References

    1. Alobwede E., Leake J. R., Pandhal J. (2019). Circular economy fertilization: testing micro and macro algal species as soil improvers and nutrient sources for crop production in greenhouse and field conditions. Geoderma 334 113–123. 10.1016/j.geoderma.2018.07.049 - DOI
    1. Aoki S., Miyachi S. (1964). Chromatographic analyses of acid-soluble polyphosphates in chlorella cells. Plant Cell Physiol. 5 241–250. 10.1093/oxfordjournals.pcp.a079038 - DOI
    1. Bloem E., Albihn A., Elving J., Hermann L., Lehmann L., Sarvi M., et al. (2017). Contamination of organic nutrient sources with potentially toxic elements, antibiotics and pathogen microorganisms in relation to P fertilizer potential and treatment options for the production of sustainable fertilizers: a review. Sci. Total Environ. 60 225–242. 10.1016/j.scitotenv.2017.06.274 - DOI - PubMed
    1. Conley D. J., Paerl H. W., Howarth R. W., Boesch D. F., Seitzinger S. P., Havens K. E., et al. (2009). Ecology – controlling eutrophication: nitrogen and phosphorus. Science 323 1014–1015. 10.1126/science.1167755 - DOI - PubMed
    1. De Wit C. T. (1992). Resource use efficiency in agriculture. Agric. Syst. 40 125–151.