

Electrical Impedance Myography for Assessing Paraspinal Muscles of Patients with Low Back Pain
- PMID: 33584890
- PMCID: PMC7851978
- DOI: 10.2478/joeb-2019-0015
Electrical Impedance Myography for Assessing Paraspinal Muscles of Patients with Low Back Pain
Abstract
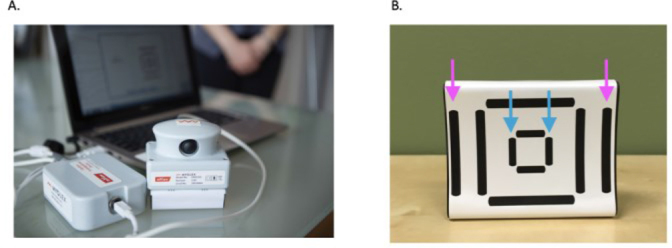
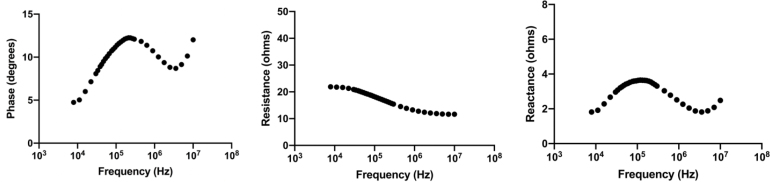
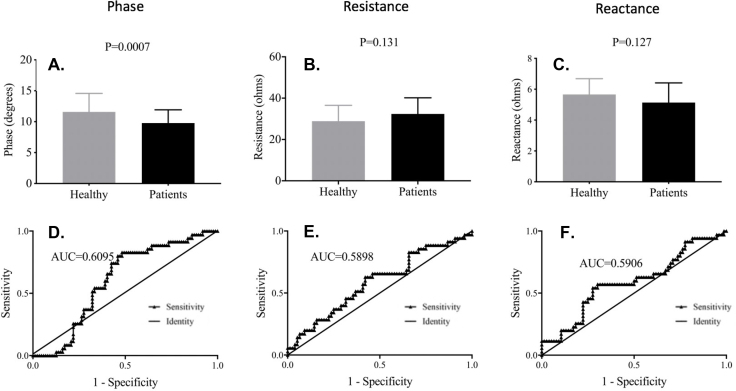
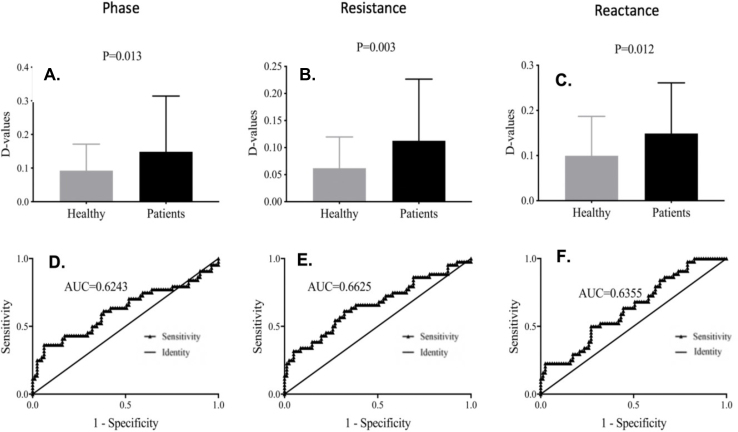
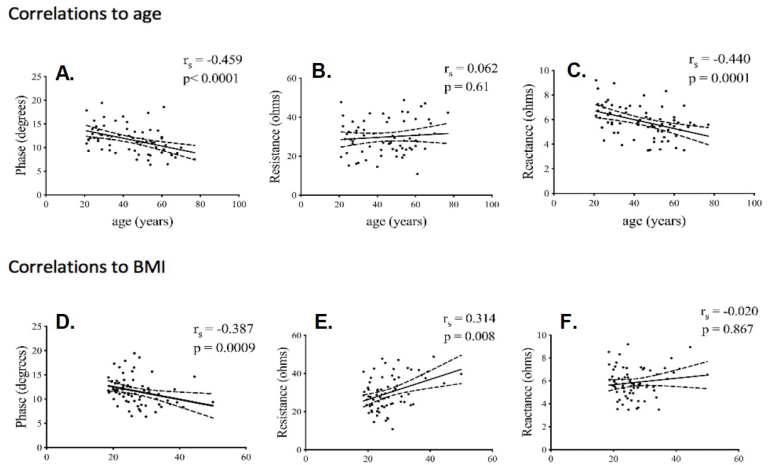
The objective of this study was to determine the potential value of electrical impedance myography (EIM) for assessing lumbosacral paraspinal muscle (LPM) condition in lower back pain (LBP) patients. Standard methods for assessing the condition of LPMs, such as magnetic resonance imaging, are inconvenient and expensive. One tool that could be useful for this purpose is electrical impedance myography (EIM) a technique that can be performed rapidly at the bedside. After undergoing a screening history and examination, subjects were studied with the mView EIM device (Myolex, Inc, Boston). Bilateral LPMs were measured three times each and the two closest sets of measurements averaged on each side. Data analysis included non-parametric two-group comparisons between healthy subjects and back pain patients, receiver-operating curve analyses, and correlation analyses to age and body mass index. A total of 86 healthy individuals (median age (interquartile range) (IQR), 45.5 years (30.3-56.0 years), 42 men, 44 women) and 47 LBP (median age 51.0 year (39.5-57.5) years, 21 men, 26 women) were enrolled. Median EIM 100kHz phase was lower in the LBP patients (9.3°(IQR 8.4°-10.6°) versus 11.4°(IQR 9.4°-13.0°), p = 0.0007). Significantly increased normalized side-to-side differences were present for all three EIM variables (e.g., median 100 kHz phase 0.15 (IQR 0.07-0.31 in LBP patients versus 0.09 (IQR 0.04-0.17) in healthy individuals). A significant correlation between 100 kHz EIM phase and reactance was found with age (Rspearman=-0.46, P=0.0002 and Rspearman=-0.440, P=0.0003) but not for resistance. This study provides early evidence supporting that EIM has the potential to serve as a useful tool for evaluating the condition of LPMs.
Keywords: Low back pain; age; asymmetry; bioimpedance; body mass index; electrical impedance; musculoskeletal; paraspinal muscles; radiculopathy.
© 2019 Yun Wang et al., published by Sciendo.
Conflict of interest statement
Conflict of interest Drs. Rutkove and Bohorquez hold equity in Myolex, Inc, have or currently serve on the board of directors, have received salary or consulting income from the company, and are named as inventors on patents owned or licensed to Myolex, Inc. Laura Freedman holds equity in Myolex and receives a salary. Martin Buck, receives a salary from Myolex. None of the other authors have any specific conflicts to report. This work was funded by National Institutes of Health Grant R44 AR064142 to Myolex, Inc (formerly Skulpt/Convergence Medical Devices).
Figures
References
-
- Chen KY, Shaparin N, Gritsenko K. Low back pain. Pain Medicine: An Essential Review. 2017. In. Epub 1. Chen KY, Shaparin N, Gritsenko K. Low back pain. In: Pain Medicine: An Essential Review. 2017. Epub ahead of print 2017. https://doi.org/10.1007/978-3-319-43133-8_121 .
-
- Maher C, Underwood M, Buchbinder R.. Non-specific low back pain. The Lancet. Epub ahead of print 2017. https://doi.org/10.1016/s0140-6736(16)30970-9 . - PubMed
-
- Goubert D, Oosterwijck J Van, Meeus M. et al. Structural Changes of Lumbar Muscles in Non-Specific Low Back Pain. Pain Physician. 19(7):E985–E999. - PubMed
-
- Yamato TP, Maher CG, Saragiotto BT. et al. Pilates for low back pain. Sao Paulo Med J. Epub ahead of print 2016. https://doi.org/10.1590/1516-3180.20161344t1 . - PMC - PubMed
-
- Bogduk N.. Management of chronic low back pain. Medical Journal of Australia. 180(2):79–83. - PubMed
Grants and funding
LinkOut - more resources
Full Text Sources
Miscellaneous