

Multi-Omics Driven Metabolic Network Reconstruction and Analysis of Lignocellulosic Carbon Utilization in Rhodosporidium toruloides
- PMID: 33585414
- PMCID: PMC7873862
- DOI: 10.3389/fbioe.2020.612832
Multi-Omics Driven Metabolic Network Reconstruction and Analysis of Lignocellulosic Carbon Utilization in Rhodosporidium toruloides
Abstract
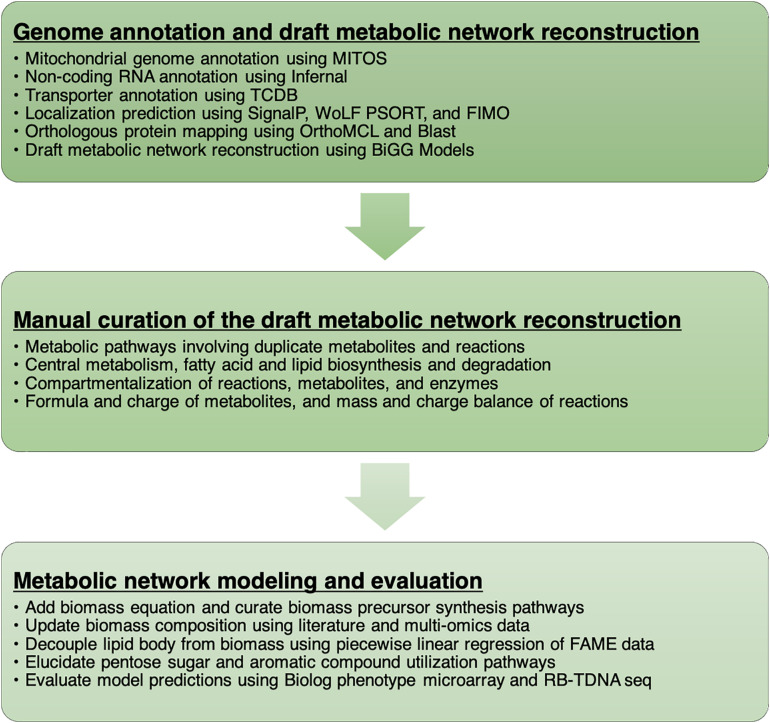
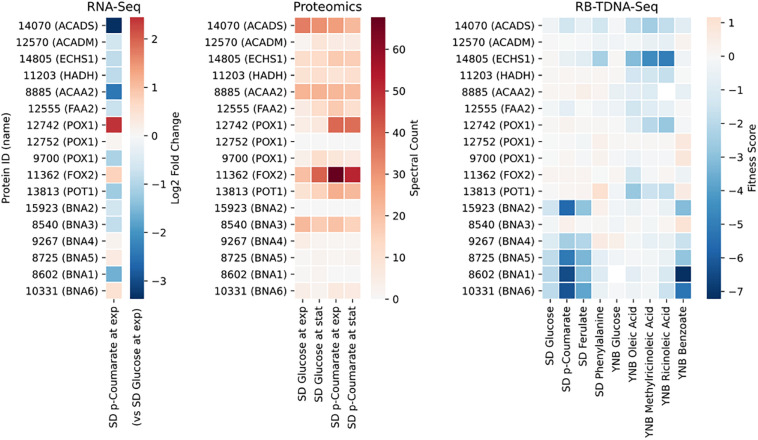
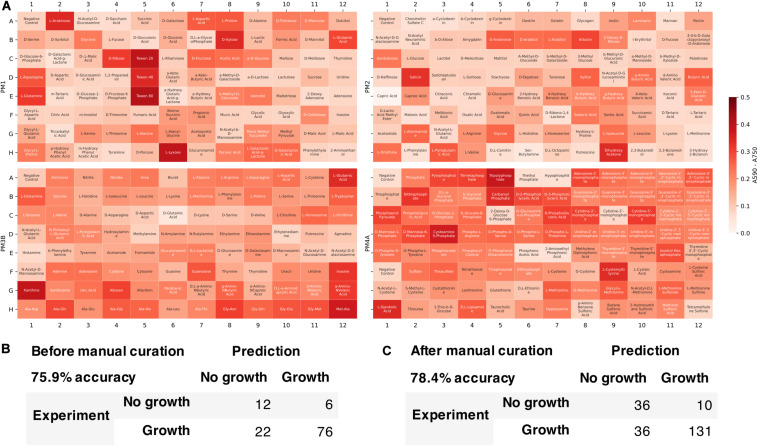
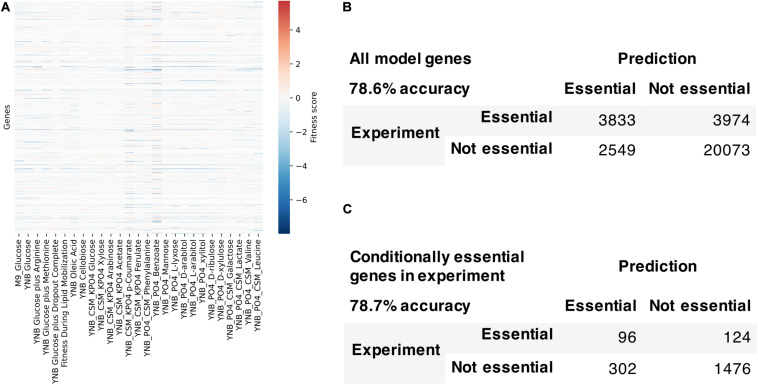
An oleaginous yeast Rhodosporidium toruloides is a promising host for converting lignocellulosic biomass to bioproducts and biofuels. In this work, we performed multi-omics analysis of lignocellulosic carbon utilization in R. toruloides and reconstructed the genome-scale metabolic network of R. toruloides. High-quality metabolic network models for model organisms and orthologous protein mapping were used to build a draft metabolic network reconstruction. The reconstruction was manually curated to build a metabolic model using functional annotation and multi-omics data including transcriptomics, proteomics, metabolomics, and RB-TDNA sequencing. The multi-omics data and metabolic model were used to investigate R. toruloides metabolism including lipid accumulation and lignocellulosic carbon utilization. The developed metabolic model was validated against high-throughput growth phenotyping and gene fitness data, and further refined to resolve the inconsistencies between prediction and data. We believe that this is the most complete and accurate metabolic network model available for R. toruloides to date.
Keywords: Rhodosporidium toruloides; genome-scale models; lignocellulosic biomass; metabolic networks; multi-omics.
Copyright © 2021 Kim, Coradetti, Kim, Gao, Yaegashi, Zucker, Munoz, Zink, Burnum-Johnson, Baker, Simmons, Skerker, Gladden and Magnuson.
Conflict of interest statement
The authors declare that the research was conducted in the absence of any commercial or financial relationships that could be construed as a potential conflict of interest.
Figures
Similar articles
-
Integrating transcriptomic and metabolomic analysis of the oleaginous yeast Rhodosporidium toruloides IFO0880 during growth under different carbon sources.Appl Microbiol Biotechnol. 2021 Oct;105(19):7411-7425. doi: 10.1007/s00253-021-11549-8. Epub 2021 Sep 7. Appl Microbiol Biotechnol. 2021. PMID: 34491401
-
Genomewide and Enzymatic Analysis Reveals Efficient d-Galacturonic Acid Metabolism in the Basidiomycete Yeast Rhodosporidium toruloides.mSystems. 2019 Dec 17;4(6):e00389-19. doi: 10.1128/mSystems.00389-19. mSystems. 2019. PMID: 31848309 Free PMC article.
-
Monoterpene production by the carotenogenic yeast Rhodosporidium toruloides.Microb Cell Fact. 2019 Mar 18;18(1):54. doi: 10.1186/s12934-019-1099-8. Microb Cell Fact. 2019. PMID: 30885220 Free PMC article.
-
Potential of Rhodosporidium toruloides for Fatty Acids Production Using Lignocellulose Biomass.Appl Biochem Biotechnol. 2024 May;196(5):2881-2900. doi: 10.1007/s12010-023-04681-w. Epub 2023 Aug 24. Appl Biochem Biotechnol. 2024. PMID: 37615852 Review.
-
Rhodosporidium toruloides - A potential red yeast chassis for lipids and beyond.FEMS Yeast Res. 2020 Aug 1;20(5):foaa038. doi: 10.1093/femsyr/foaa038. FEMS Yeast Res. 2020. PMID: 32614407 Free PMC article. Review.
Cited by
-
Genome-scale model development and genomic sequencing of the oleaginous clade Lipomyces.Front Bioeng Biotechnol. 2024 Apr 4;12:1356551. doi: 10.3389/fbioe.2024.1356551. eCollection 2024. Front Bioeng Biotechnol. 2024. PMID: 38638323 Free PMC article.
-
Top-down and bottom-up microbiome engineering approaches to enable biomanufacturing from waste biomass.J Ind Microbiol Biotechnol. 2024 Jan 9;51:kuae025. doi: 10.1093/jimb/kuae025. J Ind Microbiol Biotechnol. 2024. PMID: 39003244 Free PMC article. Review.
-
Enhanced glycerol assimilation and lipid production in Rhodotorula toruloides CBS14 upon addition of hemicellulose primarily correlates with early transcription of energy-metabolism-related genes.Biotechnol Biofuels Bioprod. 2023 Mar 10;16(1):42. doi: 10.1186/s13068-023-02294-3. Biotechnol Biofuels Bioprod. 2023. PMID: 36899390 Free PMC article.
-
Engineering of xylose metabolic pathways in Rhodotorula toruloides for sustainable biomanufacturing.FEMS Yeast Res. 2025 Jan 30;25:foaf029. doi: 10.1093/femsyr/foaf029. FEMS Yeast Res. 2025. PMID: 40498526 Free PMC article. Review.
-
Engineering transcriptional regulation of pentose metabolism in Rhodosporidium toruloides for improved conversion of xylose to bioproducts.Microb Cell Fact. 2023 Aug 3;22(1):144. doi: 10.1186/s12934-023-02148-5. Microb Cell Fact. 2023. PMID: 37537586 Free PMC article.
References
-
- Bailey T. L., Elkan C. (1994). Fitting a mixture model by expectation maximization to discover motifs in biopolymers. Proc. Int. Conf. Intell. Syst. Mol. Biol. 2 28–36. - PubMed
LinkOut - more resources
Full Text Sources
Other Literature Sources
Molecular Biology Databases