. 2021 Jan 25:8:533543.
doi: 10.3389/fcell.2020.533543. eCollection 2020.

Inducing Non-genetically Modified Induced Embryonic Sertoli Cells Derived From Embryonic Stem Cells With Recombinant Protein Factors

Affiliations

Inducing Non-genetically Modified Induced Embryonic Sertoli Cells Derived From Embryonic Stem Cells With Recombinant Protein Factors

Chenze Xu et al. Front Cell Dev Biol. .

Abstract

Embryonic Sertoli cells (eSCs) possess multiple supporting functions and research value in gonadal development and sex determination. However, the limitation of acquiring quality eSCs had hindered the further application. Herein, we successfully derived non-genetically modified (non-GM)-induced embryonic Sertoli-like cells (eSLCs) from mouse embryonic stem cells (ESCs) with a TM4 cell-derived conditioned medium containing recombinant endogenous protein factors Sry, Sox9, Sf1, Wt1, Gata4, and Dmrt1. These eSLCs were determined through morphology; transcriptional expression levels of stage-specific, epithelial, and mesenchymal marker genes; flow cytometry, immunofluorescence; and immunocytochemistry and functionally determined by coculture with spermatogonia stem cells. Results indicated that these eSLCs performed similarly to eSCs in specific biomarkers and expression of marker genes and supported the maturation of spermatogonia. The study induced eSLCs from mouse ESCs by defined protein factors. However, the inducing efficiency of the non-GM method was still lower than that of the lentiviral transduction method. Thus, this work established a foundation for future production of non-GM eSLCs for clinical applications and fundamental theory research.

Keywords: Sertoli cells; embryonic stem cells; lentiviral transduction; non-genetically modified; recombinant endogenous protein factors.


Conflict of interest statement

The authors declare that the research was conducted in the absence of any commercial or financial relationships that could be construed as a potential conflict of interest.

Figures

FIGURE 1
FIGURE 1
Cell recovery treated with proteins, lentiviral infection, and TM4 cells after cryopreservation. (A) Recombinant protein factors produced by HEK293 cells were detected by WB. The loading quantity of samples was adjusted according to β-actin. “-” represented HEK293 cells of the control group. “+” represented HEK293 cells transduced with target genes. (B) Cell populations of different test groups were counted in the first 5-day. Cells in mES+MEF (control group) were cultured with MEF feeder layers. In group mES+Trans, ESCs were transduced with the six factors by lentiviral infection. In group mES+TM4, ESCs were cultured in TM4-conditioned medium. In group mES+Protein, ESCs were cultured in medium containing the six protein factors. In group mES+TM4+Protein, ESCs were cultured in TM4-conditioned medium containing the six protein factors. Results were expressed as mean ± SD (n = 3 independent experiments). The PCs from (C) group mES+MEF and (D) group mES+Protein+TM4 were blown off by a pipette and observed under a light microscope. Scale bar = 400 μm. In panel (D), the enlarged image is shown on the right. At day 3, optical images indicated the cells in panel (E) group mES+MEF and (F) group mES+Protein+TM4. Some PCs were marked with a circle. (G) The number of PCs viewed under a microscope per sight were counted. The amplification of the microscope was 100×. Results were expressed as mean ± SD (n = 3 independent experiments). (H) qPCR results show changes in pluripotency markers, Oct4, Sox2, Nanog, Klf4, and lin28, after 5 days of culture among different groups in gene expression relative to expression of the control group (mES+MEF). Results were expressed as mean ± SD (n = 3 independent experiments). The dotted horizontal line represents the gene expression level of each pluripotency marker in mES + MEF. Asterisks indicate statistical significance of differences in the mean gene expression according to the control group (mES+MEF) (P-value <0.05, ∗∗P-value < 0.01, ∗∗∗P-value < 0.001). (I) qPCR results show changes in 6 test factors after 5 days of culture after 5 days of culture among groups mES+MEF, mES+Protein, and mES+Trans in gene expression relative to expression of β-actin in self-comparison. Results were expressed as mean ± SD (n = 3 independent experiments). Asterisks indicate statistical significance of differences in the mean gene expression relative to the control group (mES+MEF).
FIGURE 2
FIGURE 2
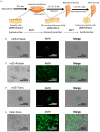
Morphology of PCs and potential progenitor cells of eSCs. (A) Stepwise development of progenitor cells to eSCs. PCs in panel (B) group mES+Protein at day 20, (C) epithelial-like cells in group mES+Protein, (D) PCs in group mES+Trans at day 20, and (E) epithelial-like cells in group mES+Trans express AMH (green fluorescence). Results show light microscope, IF, and merged images. Among panels (B–E), scale bar = 200 μm.
FIGURE 3
FIGURE 3
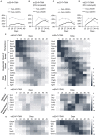
Identification of development process in group mES+P+TM4 and mES+T+TM4 by FCM and qPCR. The cell portions of FasL/AMH+ and FasL+/AMH+ cells were detected via FCM. (A) The whole cell population was identified in group mES+P+TM4. (B) The cell population was detected in group mES+P+TM4 after PCs were removed. (C) The whole cell population was identified in group mES+T+TM4. (D) The cell population was detected in group mES+T+TM4 after PCs were removed. Tests were performed every 7-day and expressed as mean ± SD (n = 3 independent experiments). Heat map indicates the gene expression levels of major transcription factors for (E) pluripotency and onset of gonad, bi-potential gonad, and male gonad in group mES+P+TM4 and in group mES+T+TM4. (F) Epithelial and mesenchymal markers in group mES+P+TM4 and in group mES+T+TM4. (G) The inducing factors in group mES+P+TM4 and in group mES+T+TM4. qPCR was performed every 5-day and expressed relative to the highest expression value between groups mES+P+TM4 and mES+T+TM4. qPCR results took the mean value and are shown in a heat map (n = 3 independent experiments).
FIGURE 4
FIGURE 4
Coculture of induced eSCs with SSCs. FasL+ cells were sorted in group mES+P+TM4 by FCM sorter at day 30. These cells showed (A) 91.1% of AMH+ and (B) 53.3% of SOX9+ by FCM. Most of these cells were speculated as eSCs (n = 5. mean ± SD). SSCs were isolated by Percoll inconsecutive density gradient centrifugation. These cells showed (C) 100% of C-kit+ and (D) 91.8% of CD9+ by FCM (n = 5. mean ± SD). (E) The FasL+ cells sorted from mES+P+TM4 were planted in culture flasks. After 1 day, the cells were stained with DAPI (blue) and FasL antibodies (green) under IF. (F) Under IF, cell nuclei of the coculture of SSCs and eSCs were stained by DAPI (blue). eSCs were FasL+ shown in green. An enlarged image was on the right. The cells having round blue nuclei with green membrane were eSCs, and those without green membrane were supposed to be SSCs. The cells having narrow blue nuclei were speculated to be the sperm cells. (G) SSCs and eSCs were cocultured in SSC differentiation medium for 1 week. Via ICC, SSCs shown in dark brown as DDX4+ cells. eSCs and sperm-like cells were DDX4 shown in blue. (H) SSCs and eSCs were cocultured in SSC differentiation medium for 1 week. Via ICC, SSCs and sperm-like cells are shown in dark brown as PGP9.5+ cells. eSCs were PGP9.5 shown in blue.

Similar articles

Cited by

References

    1. Baazm M., Mashayekhi F. J., Babaie S., Bayat P., Beyer C., Zendedel A. (2017). Effects of different Sertoli cell types on the maintenance of adult spermatogonial stem cells in vitro. In Vitro Cell. Dev. Biol. Anim. 53 752–758. 10.1007/s11626-017-0172-z - DOI - PubMed
    1. Barrionuevo F., Burgos M., Jimenez R. (2011). Origin and function of embryonic sertoli cells. Biomol. Concepts 2 537–547. 10.1515/bmc.2011.044 - DOI - PubMed
    1. Bernardino R. L., Alves M. G., Oliveira P. F. (2018). Establishment of primary culture of sertoli cells. Methods Mol. Biol. 1748 1–8. 10.1007/978-1-4939-7698-0_1 - DOI - PubMed
    1. Bouma G. J., Washburn L. L., Albrecht K. H., Eicher E. M. (2007). Correct dosage of Fog2 and Gata4 transcription factors is critical for fetal testis development in mice. Proc. Natl. Acad. Sci. U.S.A. 104 14994–14999. 10.1073/pnas.0701677104 - DOI - PMC - PubMed
    1. Bucay N., Yebra M., Cirulli V., Afrikanova I., Kaido T., Hayek A., et al. (2009). A novel approach for the derivation of putative primordial germ cells and sertoli cells from human embryonic stem cells. Stem Cells 27 68–77. 10.1634/stemcells.2007-1018 - DOI - PubMed