Review
. 2021 Jan 27:7:603358.
doi: 10.3389/fvets.2020.603358. eCollection 2020.

Intravenous and Oral Fluid Therapy in Neonatal Calves With Diarrhea or Sepsis and in Adult Cattle

Affiliations
Review

Intravenous and Oral Fluid Therapy in Neonatal Calves With Diarrhea or Sepsis and in Adult Cattle

Peter D Constable et al. Front Vet Sci. .

Abstract

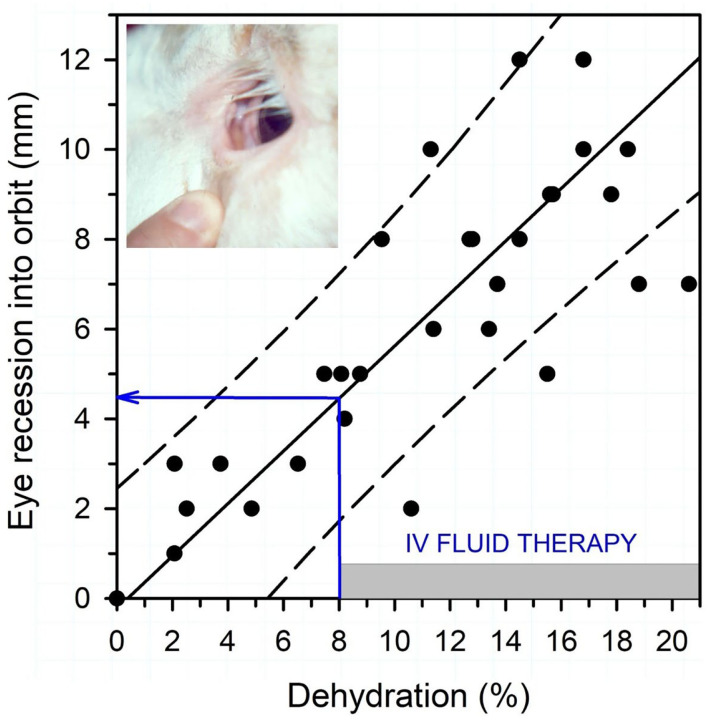
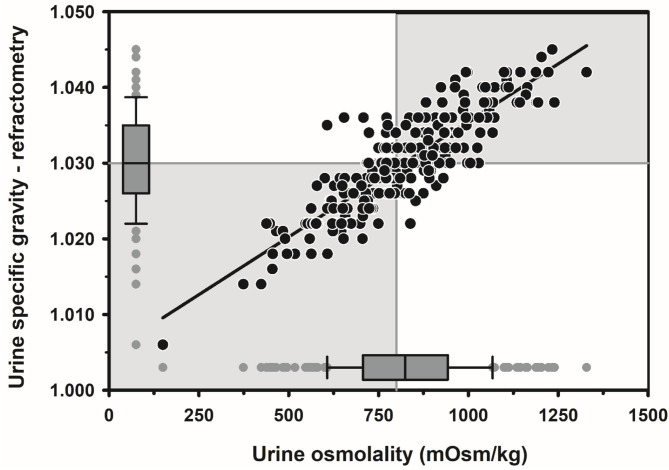
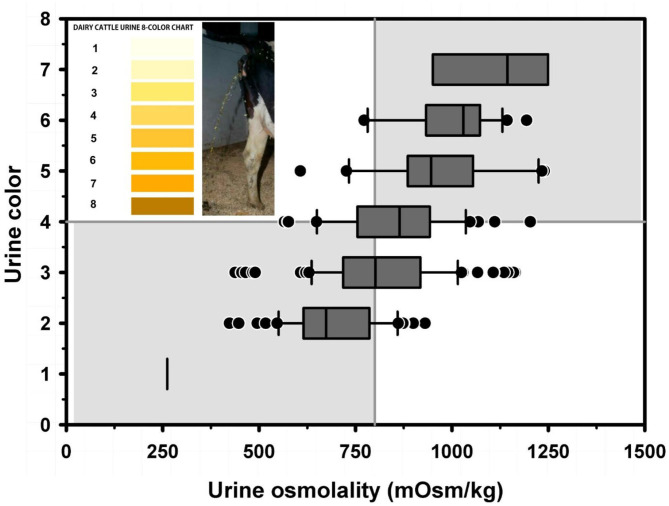
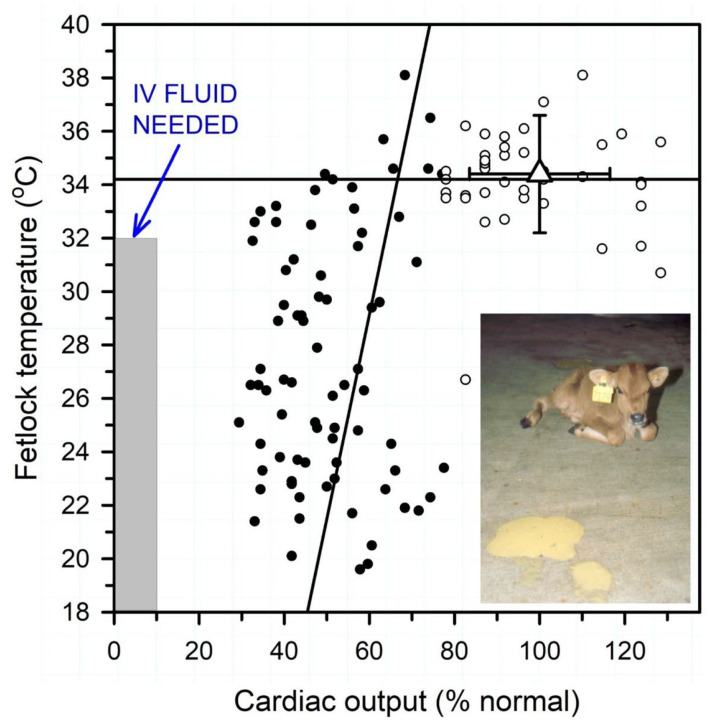
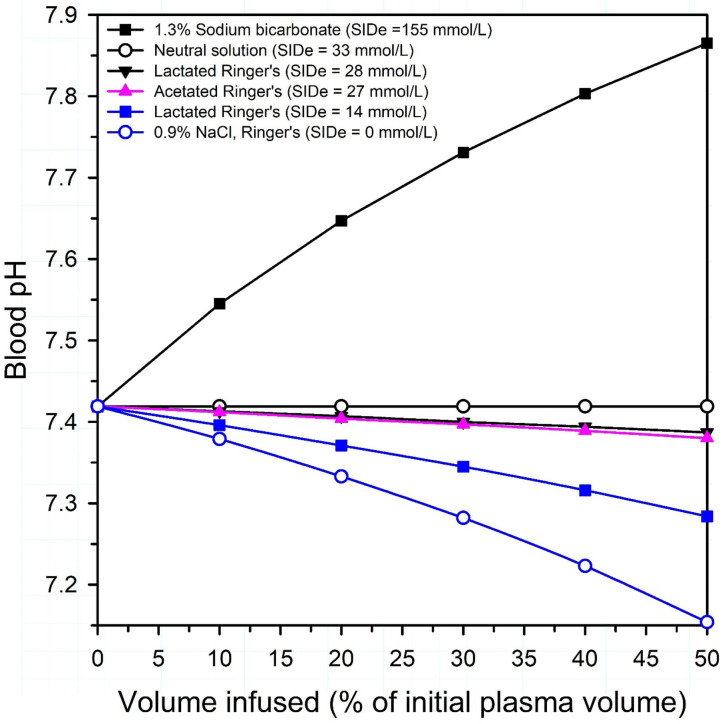
Optimal fluid therapy protocols in neonatal calves and adult cattle are based on consideration of signalment, history, and physical examination findings, and individually tailored whenever laboratory analysis is available. Measurement of the magnitude of eye recession, duration of skin tenting in the lateral neck region, and urine specific gravity by refractometry provide the best estimates of hydration status in calves and cattle. Intravenous and oral electrolyte solutions (OES) are frequently administered to critically ill calves and adult cattle. Application of physicochemical principles indicates that 0.9% NaCl, Ringer's solution, and 5% dextrose are equally acidifying, lactated Ringer's and acetated Ringer's solution are neutral to mildly acidifying, and 1.3-1.4% sodium bicarbonate solutions are strongly alkalinizing in cattle. Four different crystalloid solutions are recommended for intravenous fluid therapy in dehydrated or septic calves and dehydrated adult cattle: (1) lactated Ringer's solution and acetated Ringer's solution for dehydrated calves, although neither solution is optimized for administration to neonatal calves or adult cattle; (2) isotonic (1.3%) or hypertonic (5.0 or 8.4%) solutions of sodium bicarbonate for the treatment of calves with diarrhea and severe strong ion (metabolic) acidosis and hyponatremia, and adult cattle with acute ruminal acidosis; (3) Ringer's solution for the treatment of metabolic alkalosis in dehydrated adult cattle, particularly lactating dairy cattle; and (4) hypertonic NaCl solutions (7.2%) and an oral electrolyte solution or water load for the rapid resuscitation of dehydrated neonatal calves and adult cattle. Much progress has been made since the 1970's in identifying important attributes of an OES for diarrheic calves. Important components of an OES for neonatal calves are osmolality, sodium concentration, the effective SID that reflects the concentration of alkalinizing agents, and the energy content. The last three factors are intimately tied to the OES osmolality and the abomasal emptying rate, and therefore the rate of sodium delivery to the small intestine and ultimately the rate of resuscitation. An important need in fluid and electrolyte therapy for adult ruminants is formulation of a practical, effective, and inexpensive OES.

Keywords: acidosis; acid–base balance; alkalosis; fluid therapy; oral electrolyte solution; osmolality.


Conflict of interest statement

The authors declare that the research was conducted in the absence of any commercial or financial relationships that could be construed as a potential conflict of interest.

Figures

Figure 1
Figure 1
Association between eye recession into the orbit and dehydration (percent body weight) in 15 neonatal calves with experimentally induced diarrhea and dehydration. The filled circles are individual data points (total of 45, 3/calf), the solid line is the linear regression line, and the dashed lines are the 95% confidence interval for prediction. Dehydration (percent of body weight) can be estimated by multiplying the degree of eye recession into the orbit in mm by 1.6. Intravenous fluid administration is recommended when dehydration is estimated at 8% or more of body weight, equivalent to an eye recession into the orbit of 4 mm or more. Figure modified with permission from: Constable et al. (4).
Figure 2
Figure 2
Scatterplot of the linear relationship between urine specific gravity measured by optical refractometry (USG-R) and urine osmolality (UOsm, reference method) for 242 urine samples obtained periodically from 20 multiparous periparturient Holstein-Friesian cows from late gestation to early lactation. Some data points are superimposed. The solid black line is the linear regression line. The solid gray vertical line indicates the recommended threshold value for diagnosing dehydration (UOsm ≥ 800 mOsm/kg), and the solid gray horizontal line indicates the optimal cut point of USG-R (≥ 1.030) identified by logistic regression for diagnosing dehydration. The box and whiskers plots represent the median (middle line), interquartile range (ends of the shaded rectangle), 10% to 90% confidence interval (whiskers), and values outside this confidence interval (small gray circles). Figure modified with permission from: Megahed et al. (5).
Figure 3
Figure 3
Box and whiskers plot of the association between urine color (8 levels) and urine osmolality (UOsm; reference method) for 237 urine samples obtained periodically from 20 multiparous periparturient Holstein-Friesian cows. The solid gray vertical line indicates the recommended cut point for UOsm (≥800 mOsm/kg) for diagnosing dehydration. The solid gray horizontal line indicates the optimal cut point for color (≥4) identified by logistic regression for diagnosing dehydration. See Figure 2 legend for additional information. Figure modified with permission from: Megahed et al. (5).
Figure 4
Figure 4
Relationship between peripheral temperature (hind fetlock) and cardiac output (percent of normal) in diarrheic calves with varying degrees of dehydration housed in a thermoneutral environment. Normal mean cardiac output was 8.5 L/min or 218 ml/min/kg BW. Linear regression lines for cardiac output < 65% normal (solid circles) and >65% normal (open circles). Triangle with error bars indicates reference values for healthy neonatal calves. Note that fetlock temperature is positively correlated with cardiac output when cardiac output <65% of normal. Intravenous fluid therapy is recommended when hindlimb fetlock temperature is <32°C (<90°F) when calves are housed in a thermoneutral environment. Figure modified with permission from Constable et al. (6).
Figure 5
Figure 5
Theoretical effect of intravenous administration of four crystalloid solutions on venous blood pH in healthy neonatal calves. SIDe = the effective strong ion difference between the charge of strong cations (Na in 1.3% sodium bicarbonate and 0.9% NaCl; Na, K and Ca in lactated Ringer's, Na, K, and Mg in acetated Ringer's) and strong anions that are not metabolized or are minimally metabolized by the calf (Cl in 0.9% NaCl; Cl and D-Lactate in lactated Ringer's; Cl and gluconate in acetated Ringer's). Because D-lactate in lactated Ringer's is present in a racemic mixture in some commercially available formulations, lactated Ringer's is presented as two solutions: (1) an equimolar solution of L-lactate and D-lactate, with an SIDe = 14 mmol/L; (2) a solution where lactate is only in the L-isomer form, with an SIDe = 28 mmol/L. Note that all solutions, except 1.3% sodium bicarbonate, are acidifying in neonatal calves. Adapted from: Constable (19).
Figure 6
Figure 6
Decision tree for treating neonatal calves with diarrhea. The ability to stand is evaluated by lifting recumbent calves. Enophthalmos reflects a visible gap of 3–4 mm between the corneal surface of the eye and normal position of the lower eyelid. Reprinted with permission from: Trefz et al. (47).
Figure 7
Figure 7
Cardiac output in healthy neonatal calves (time = −24 h) and after experimentally induced diarrhea and dehydration (time = 0 h). Calves were then randomly assigned to no treatment (Control; black circles, n = 4) or treatment with an intravenous hypertonic saline-dextran (HSD) solution (2,400 mOsm/L NaCl in 6% dextran-70 at 4 ml/kg BW once over 4 min; cyan triangles, n = 4), an isotonic alkalinizing oral electrolyte solution (55 ml/kg BW every 8 h for three treatments; pink circles, n = 4); or a combination of intravenous HSD and oral treatments (blue triangles, n = 4). *P < 0.05, compared with t = 0 value; aP < 0.05 compared with hypertonic saline dextran group; bP < 0.05 compared with oral electrolyte solution; and cP < 0.05, compared with the untreated control group. Adapted, with permission, from: Constable et al. (66).
Figure 8
Figure 8
Cardiac output in severely dehydrated diarrheic calves treated with no fluid (Control, black circles; n = 5); intravenous lactated Ringer's solution (80 ml/kg BW for 1 h then 4 ml/kg BW for 7 h) and an oral electrolyte solution (OES; 40 ml/kg BW at 8 and 16 h; red circles, n = 5); or intravenous hypertonic saline-dextran solution (HSD, 2,400 mOsm/L NaCl in 6% dextran-70 at 4 ml/kg BW once over 4 min) combined with an OES (60 ml/kg BW every 8 h for three treatments, blue triangles, n = 5). Base refers to baseline, the time before induction of diarrhea and dehydration. *significantly different from time = 0 h; significantly different from control group at the same time; ¶significantly different from the lactated Ringer's group at the same time. Revised, with permission, from: Walker et al. (13).
Figure 9
Figure 9
Changes in echocardiographically determined cardiac index (left panel) and systolic, mean, and diastolic arterial pressure (right panel) over 72 h after the start of a standardized treatment protocol in 20 septic calves that included intravenous fluids and vasopressors. Data are presented as least squares mean and SE. The number of calves alive at each measurement time were 20 at 0 and 6 h, 17 at 24 h, 14 at 48 h, and 12 at 72 h. The gray shaded rectangle is the 95% confidence interval for the mean value for 10 healthy calves of similar age and body weight (right panel, mean value for mean arterial pressure). *P < 0.0125 compared to time = 0 h value. Reproduced with permission from: Naseri et al. (86).
Figure 10
Figure 10
Representative pressure-volume loops, end-systolic pressure-volume relationship (straight blue line), and end-diastolic pressure-volume relationship (dashed exponential blue line) in an endotoxemic calf. Caudal vena-caval occlusion was used to decrease preload while left ventricular (LV) pressure and volume were recorded. The left panel is before endotoxin was administered. The right panel is 1 h after start of endotoxin administration. Note that the administration of endotoxin markedly decreased end-systolic pressure and increased End-systolic elastance (Ees; the gold standard index of cardiac contractility), decreased stroke volume and end-diastolic volume, slightly increased LV diastolic stiffness, and increased heart rate (not shown). The figure indicates that systemic arterial hypotension is the dominant cardiovascular derangement in acute endotoxemia. Reproduced with permission from: Constable (89).
Figure 11
Figure 11
Abomasal luminal pH in a healthy dairy calf suckling an all-milk protein milk replacer (solid black line), a hypertonic high-bicarbonate oral electrolyte solution (OES, blue line), or an isotonic acetate- and propionate-containing OES (red line) in random order at 0 h. Note that the isotonic acetate- and propionate-containing OES is emptied much faster than milk replacer and a hypertonic high-bicarbonate OES. Also note that the hypertonic high-bicarbonate OES causes a marked and sustained increase in abomasal luminal pH. Figure from Peter Constable, unpublished.
Figure 12
Figure 12
Serum glucose concentrations in neonatal calves with experimentally induced diarrhea and dehydration, and response to oral administration (2 L of solution at 12 h intervals) of milk replacer (n = 6), a hypertonic oral electrolyte solution (OES; osmolarity = 606 mOsm/L; glucose = 330 mmol/L; n = 6), or an isotonic OES (osmolarity = 307 mOsm/L; glucose = 85 mmol/L; n = 6). Note that continued feeding of milk replacer maintained serum glucose concentrations, whereas serum glucose concentration was decreased in calves fed a high glucose or low glucose OES. Values expressed as mean ± SD. *P < 0.05, compared to time = 0 value; P < 0.05, compared to Group M value at the same time interval; ¶P < 0.05, compared to Group I value at the same time interval. Reproduced with permission from: Constable et al. (136).
Figure 13
Figure 13
Change in plasma glucose concentration (least squares mean ± standard error) in seven calves that were administered 2 L of a high-glucose oral electrolyte solution (OES; glucose = 405 mmol/L) by suckling or esophageal intubation, or 2 L of a low-glucose OES (glucose = 56 mmol/L) by suckling. The horizontal dashed lines indicate the range of values (140–160 mg/dl) for the renal threshold for glucose in neonatal calves. An asterisk (*) indicates significantly different from the time = 0 min value. A dagger () indicates significantly different from the value for the high-glucose OES suckled group at the same time. Reproduced with permission from: Nouri and Constable (102).

Similar articles

Cited by

References

    1. Muir W. Effect of intravenously administered crystalloid solutions on acid-base balance in domestic animals. J Vet Intern Med. (2017) 31:1371–81. 10.1111/jvim.14803 - DOI - PMC - PubMed
    1. Pfortmueller CA, Kabon B, Schefold JC, Fleischmann E. Crystalloid fluid choice in the critically ill. Wiener klinische Wochenschrift. (2018) 130:273–82. 10.1007/s00508-018-1327-y - DOI - PubMed
    1. Dillane P, Krump L, Kennedy E, Sayers RG, Sayers GP. Determining the predictive capability of a Clinical Assessment Scoring Chart to differentiate severity of the clinical consequences of neonatal calf diarrhea relative to gold-standard blood gas analysis. PLoS ONE. (2020) 15:e0230708. 10.1371/journal.pone.0230708 - DOI - PMC - PubMed
    1. Constable PD, Walker PG, Morin DE, Foreman JH. Clinical and laboratory assessment of hydration status of neonatal calves with diarrhea. J Am Vet Med Assoc. (1998) 212:991–6. - PubMed
    1. Megahed AA, Grünberg W, Constable PD. Clinical utility of urine specific gravity, electrical conductivity, and color as on-farm methods for evaluating urine concentration in dairy cattle. J Vet Intern Med. (2019) 33:1530–9. 10.1111/jvim.15502 - DOI - PMC - PubMed

LinkOut - more resources